. 2017 Apr 18;19(3):441-450.
doi: 10.1016/j.celrep.2017.03.062.

How a Mutation that Slows Aging Can Also Disproportionately Extend End-of-Life Decrepitude

Affiliations

How a Mutation that Slows Aging Can Also Disproportionately Extend End-of-Life Decrepitude

Katie Podshivalova et al. Cell Rep. .

Abstract

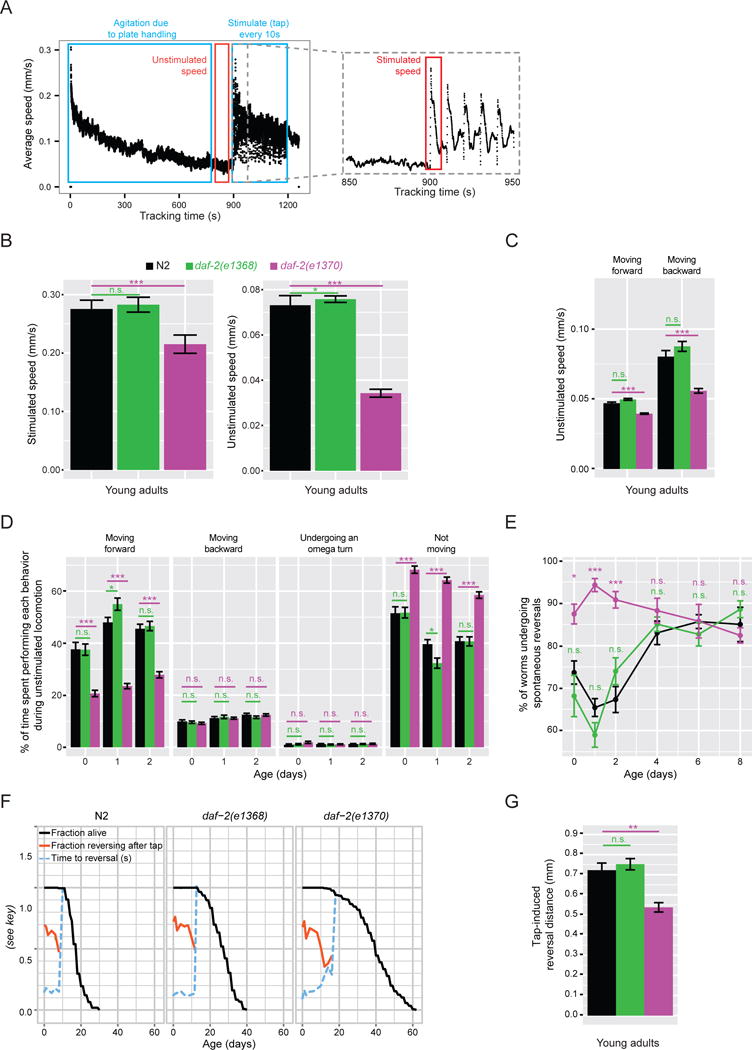
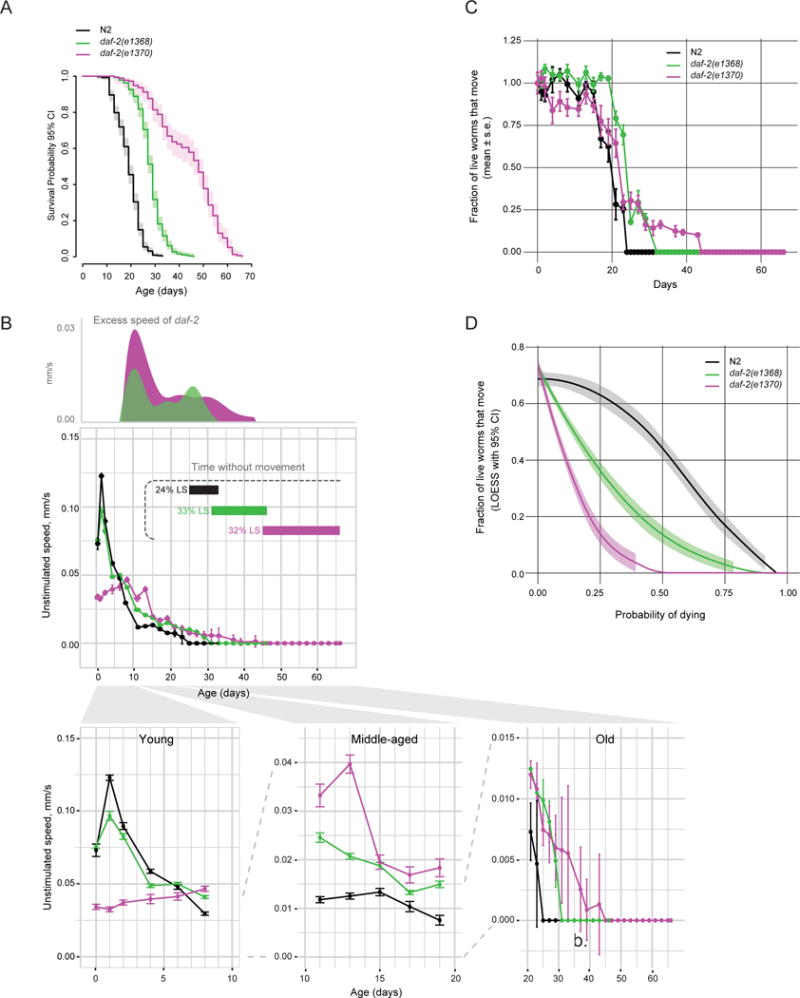
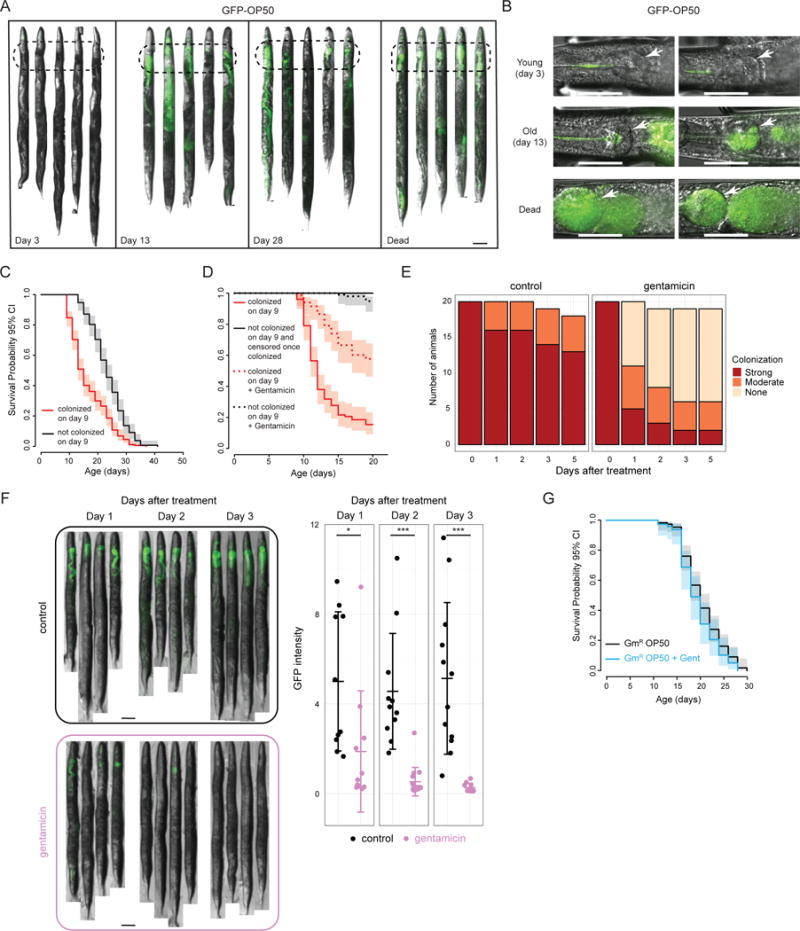
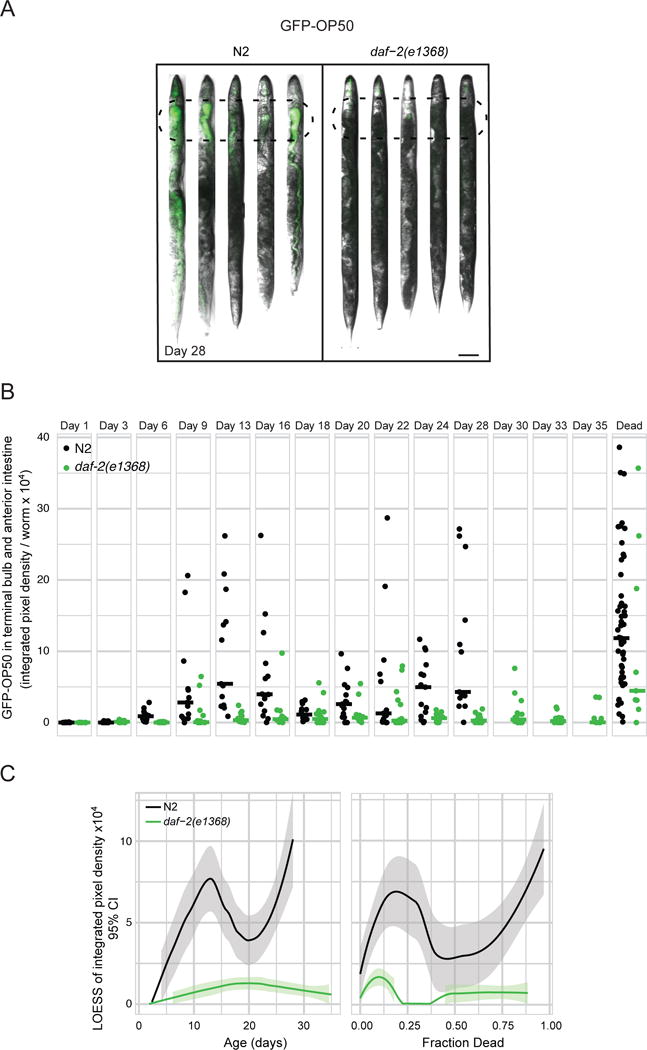
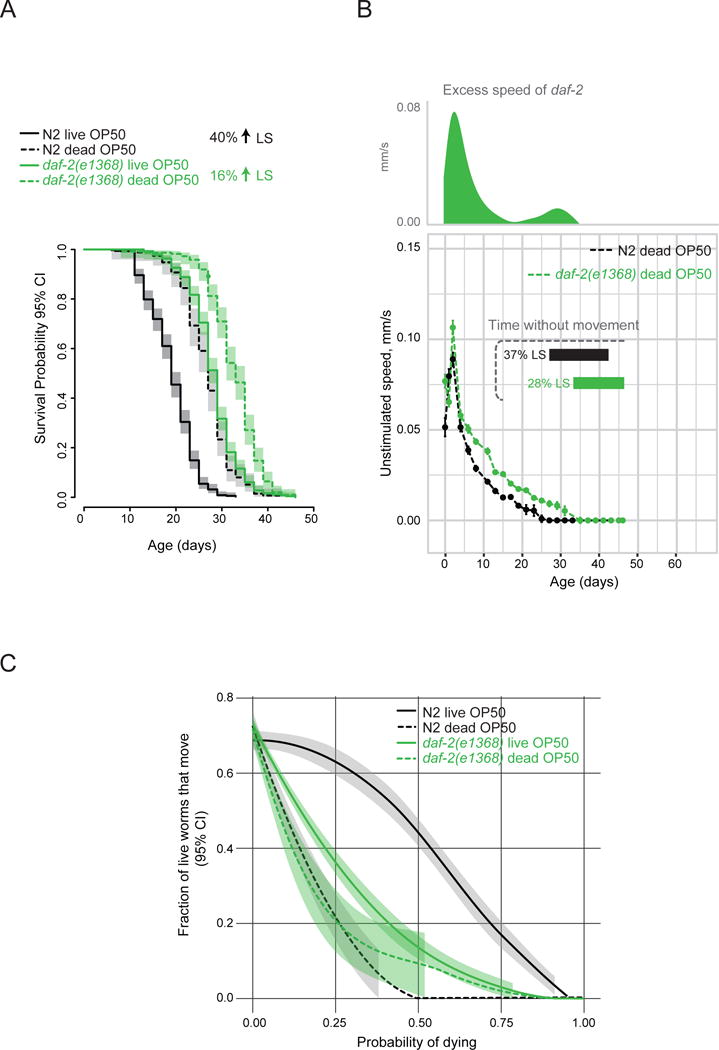
The goal of aging research is to extend healthy, active life. For decades, C. elegans daf-2 insulin/insulin-like growth factor 1 (IGF-1) receptor mutants have served as a model for extended lifespan and youthfulness. However, a recent report suggested that their longevity is associated with an undesirable phenotype: a disproportionately long period of decrepitude at the end of life. In the human population, such an outcome would be a burden to society, bringing into question the relevance of daf-2 mutants as a model for life extension. However, here we report that, following an extended period of movement, daf-2 mutants survive longer in a decrepit state because of a beneficial trait: they are resistant to colonization of the digestive tract by dietary bacteria, a condition that leads to premature death in the wild-type and prevents their manifestation of decrepitude. If bacterial colonization is prevented, then daf-2 mutants lead both chronologically and proportionately healthier lives relative to the wild-type.

Keywords: IGF-1; aging; daf-2; healthspan; lifespan; mortality; pathogenesis.


Figures

Figure 1
Figure 1. daf-2(e1370) but not daf-2(e1368) mutants exhibit several behavioral phenotypes during early adulthood
a) Data collection using the Multi-Worm Tracker. As an example, speed of N2 young adults on a single plate over the course of a tracking session is shown: 0–900 s – no stimulation; starting at 900 s, a mechanical tap stimulus was delivered every 10 seconds 30 times. b) Average speed of stimulated and unstimulated locomotion. c) Speed of unstimulated locomotion in forward and backward directions. d) Time spent by each animal performing each of the four stereotypical behaviors and e) fraction of the population spontaneously reversing movement direction during unstimulated locomotion (measured over a 60 s window). f) Fraction of animals responding (i.e. reversing) and average response time to a mechanical tap stimulus (the first tap). A reversal following the tap cannot be interpreted as a response to the tap if the time to a reversal is equal to the time between spontaneous reversals. Once this happens, tap response curves are no longer shown (i.e. in older animals). g) Distance traveled backward following a tap stimulus before resuming forward locomotion. Age – adult age (0 – young adult). n > 200. * − p < 0.05; ** − p < 0.005; *** − p < 0.0005; n.s. – not significant. Figure S1A–C shows behavioral phenotypes in the absence of FUDR. Figure S2E–F shows young adult behavior in additional daf-2 mutants.
Figure 2
Figure 2. daf-2 mutants maintain vigor longer but have an extended period of immobility at the end of life
a) Survival analysis of daf-2(e1368) and daf-2(e1370) mutants under standard growth conditions. b) Unstimulated movement speed of detected animals as a function of adult age. Excess speed of daf-2 mutants is calculated by subtracting wild-type speed from mutant speed. Locomotion of young, middle-aged and old animals is also plotted separately below. Horizontal bars indicate duration of life and proportion of maximal lifespan without any detectable movement in the population. See Figure S1D for analysis of stimulated movement. n > 200 on day 0. c) Fraction of live worms exhibiting detectable movement at a given age. The data are averages of 8 independent replicate plates with 30–50 worms per plate on day 0. d) Same as (c) but plotted versus survival probability (i.e. normalized to lifespan). If every animal exhibited movement right until death regardless of whether it died early or late (i.e. there were no late-life decrepitude), this plot would be a straight horizontal line. Local polynomial regression (LOESS) fit with a 95% confidence interval is shown. Figure S1E–F shows stimulated and unstimulated speed scaled to maximal lifespan. Figure S2A–E shows early and late-life movement phenotypes in additional daf-2 mutants. Table S1 shows survival statistics for all lifespan experiments.
Figure 3
Figure 3. Colonization by the E. coli food source is a risk factor for death in C. elegans
(a–b) Representative images of GFP-labeled OP50 E. coli accumulating in the terminal bulb and anterior intestine (dashed ovals) of wild-type worms with age. For quantification using > 15 animals, see Figure 4B,C. Worms were grown on GFP-OP50 starting at L1. Images of dead worms were taken at a lower exposure to avoid saturation. Arrows point to the terminal bulb of the pharynx. Scale bar = 100 μm. c) Survival of wild-type animals that did or did not display colonization of the terminal bulb and anterior intestine on day 9 of adulthood. d) Worms that displayed colonization on day 9 were treated with gentamicin starting on day 9 and for the remainder of their lifespan. Solid black curve – population of worms that did not display any colonization on day 9 and from which any live worm that developed colonization was physically removed. Survival curves end when there were no more animals left in this group, since all wild-type worms eventually developed colonization. Note that there were no deaths in worms without colonization. e) Gentamicin effectively reduces bacterial load in colonized worms. Worms colonized by GFP-OP50 on day 9 were isolated and split into two groups. Experimental animals were transferred to GFP-OP50 lawns treated with gentamicin. Because dead OP50 do not make GFP, to monitor clearance of colonizing bacteria that could normally occur in these worms, control animals were transferred to vehicle-treated plates seeded with non-GFP-expressing OP50. Twenty worms were singled out from each treatment group and if alive, scored in the days following treatment as strongly colonized (same as on day 9), moderately colonized (less than on day 9) or not colonized (not detectable by eye). f) Animals were treated as in (e), but >10 animals were picked randomly from gentamicin-treated and untreated plates and imaged. Representative images as well as mean GFP intensity per worm (mean ± s.d.) are shown. Scale bar = 100 μm. * − p < 0.05; *** − p < 0.0005. g) C. elegans lifespan is not affected by life-long gentamicin treatment when grown on gentamicin-resistant OP50 E. coli. Figure S3A–C shows that gentamicin-killed OP50 does not induce dietary restriction.
Figure 4
Figure 4. daf-2 mutants resist bacterial colonization
a) Representative images and b) quantification of GFP-OP50 accumulation in the terminal bulb and anterior intestine (100 μm from the terminal bulb; dashed ovals) in N2 and daf-2(e1368) with age. Scale bar = 100 μm. Each dot represents a worm, and horizontal bars represent medians. n > 15. The extent of colonization appears to be biphasic. This could be due to bacteria that accumulate in relatively young adults being cleared by the animal, or due to a subpopulation of highly-colonized worms dying, while the remaining, less colonized, worms go on to develop further colonization later in life. We favor the second idea, given that there is little clearance of colonizing bacteria in day 9 animals (Figure 3E) and given the wide distribution of colonization severities in day 9–16 animals. c) Local regression of data for live worms in (c) plotted as a function of age (days of adulthood) or lifespan. Note that the daf-2 curve ends when 88% of animals are dead rather than 100%. Figure S5 shows colonization in daf-2(e1370).
Figure 5
Figure 5. The extended period of decrepitude in daf-2 mutants can be attributed to a reduced risk of death by bacterial colonization
a) Lifespans of wild-type and daf-2(e1368) mutants grown on gentamicin-killed OP50 E. coli from hatching. This diet did not affect the amount of time it took the animals to reach adulthood (data not shown). b) Unstimulated movement speed of wild-type and daf-2(e1368) animals when grown on dead OP50. Excess speed of daf-2 mutants was calculated by subtracting wild-type speed from mutant speed. Horizontal bars indicate duration of life and proportion of maximal lifespan without any detectable movement in the population. n > 200. c) Fraction of live worms exhibiting detectable movement at a given survival probability (i.e. normalized to lifespan). Local polynomial regression (LOESS) fit of data from 8 independent replicate plates with 30–50 worms per plate on day 0 and a 95% confidence interval are shown. Figure S3D–F shows rates of behavioral changes on live and dead bacteria. See Figure S4 for additional quantification of healthspan. Figure S5 shows effect of dead bacteria in daf-2(e1370).

References

    1. Arantes-Oliveira N, Berman JR, Kenyon C. Healthy animals with extreme longevity. Science. 2003;302:611. doi: 10.1126/science.1089169. - DOI - PubMed
    1. Bansal A, Kwon ES, Conte DJ, Liu H, Gilchrist MJ, MacNeil LT, Tissenbaum HA. Transcriptional regulation of Caenorhabditis elegans FOXO/DAF-16 modulates lifespan. Longevity & healthspan. 2014;3:5. doi: 10.1186/2046-2395-3-5. - DOI - PMC - PubMed
    1. Bansal A, Zhu LJ, Yen K, Tissenbaum HA. Uncoupling lifespan and healthspan in Caenorhabditis elegans longevity mutants. Proceedings of the National Academy of Sciences of the United States of America. 2015 doi: 10.1073/pnas.1412192112. - DOI - PMC - PubMed
    1. Bartke A. Insulin and aging. Cell cycle. 2008;7:3338–3343. - PubMed
    1. Centers for Medicare & Medicaid Services. NHE fact sheet. Baltimore: p. 2015.

MeSH terms

Substances