. 2017 Apr 18;19(3):545-557.
doi: 10.1016/j.celrep.2017.03.073.

Oligodendrocyte Nf1 Controls Aberrant Notch Activation and Regulates Myelin Structure and Behavior

Affiliations

Oligodendrocyte Nf1 Controls Aberrant Notch Activation and Regulates Myelin Structure and Behavior

Alejandro López-Juárez et al. Cell Rep. .

Abstract

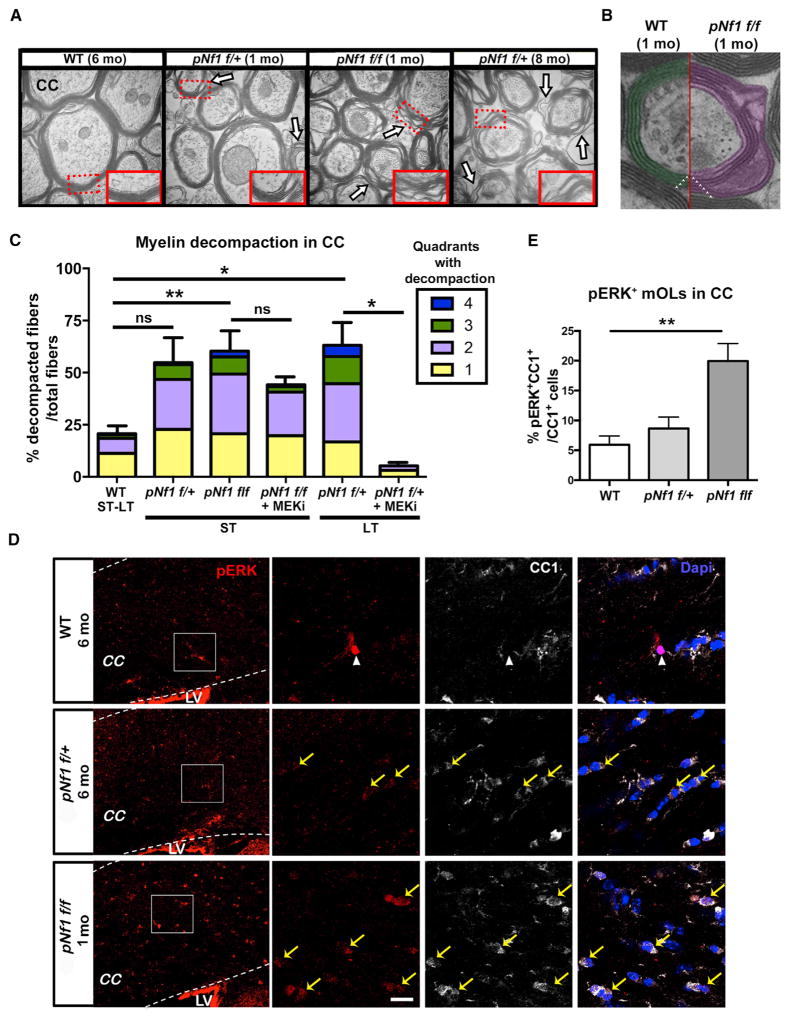
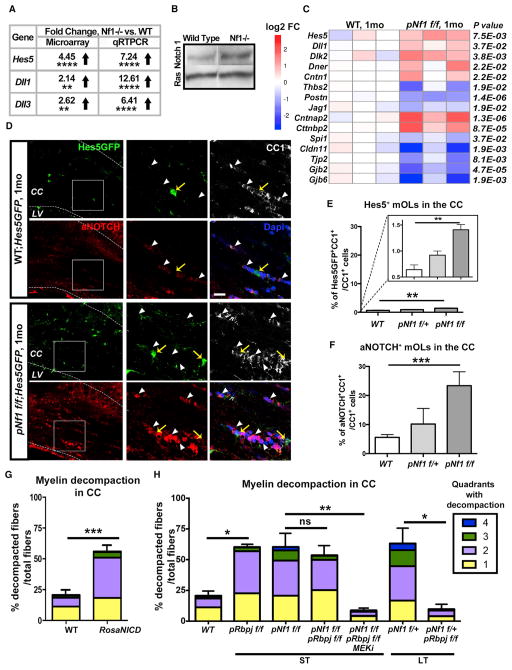
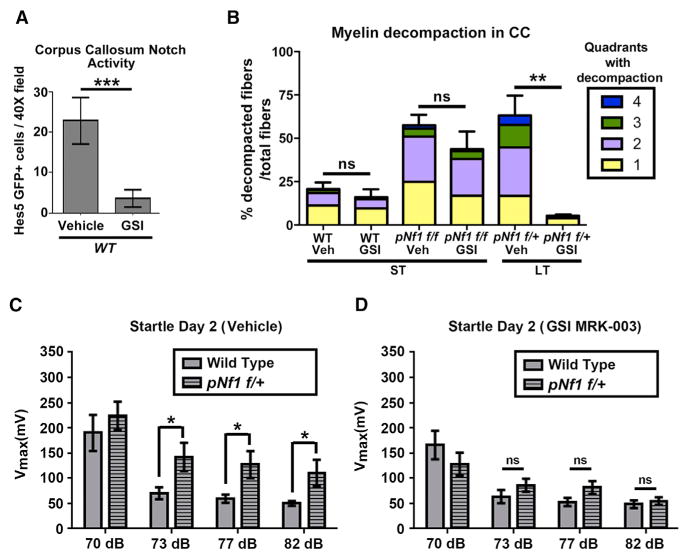
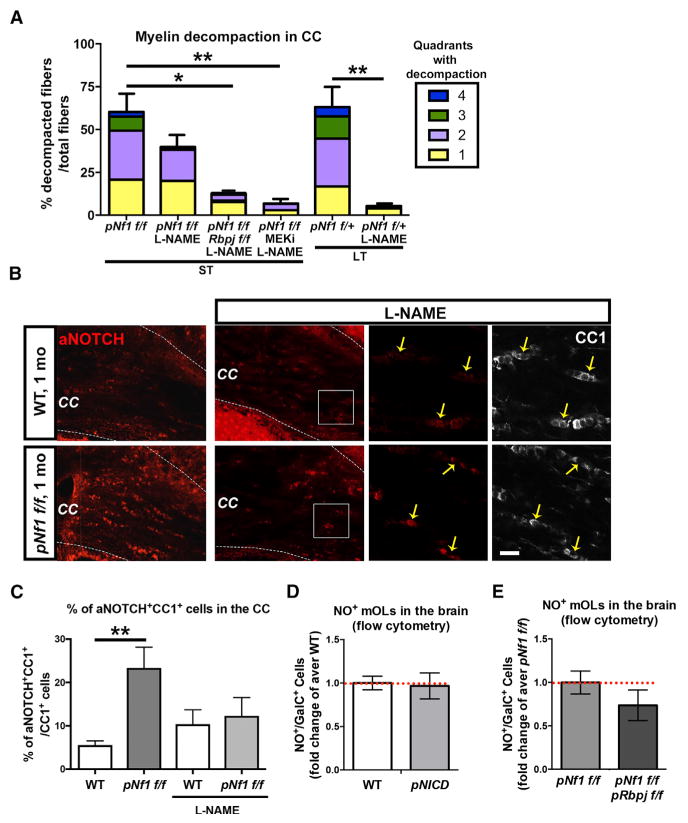
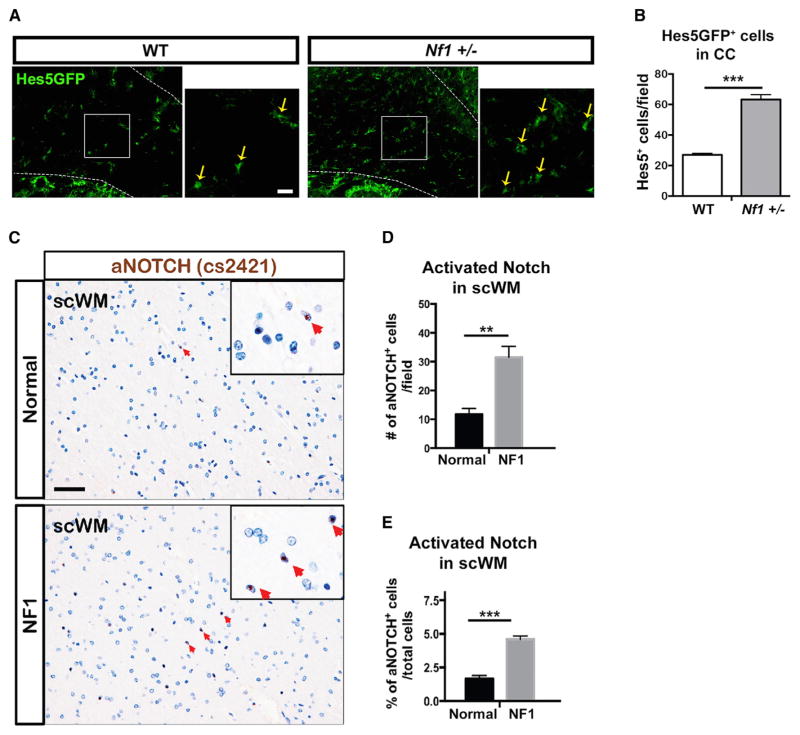
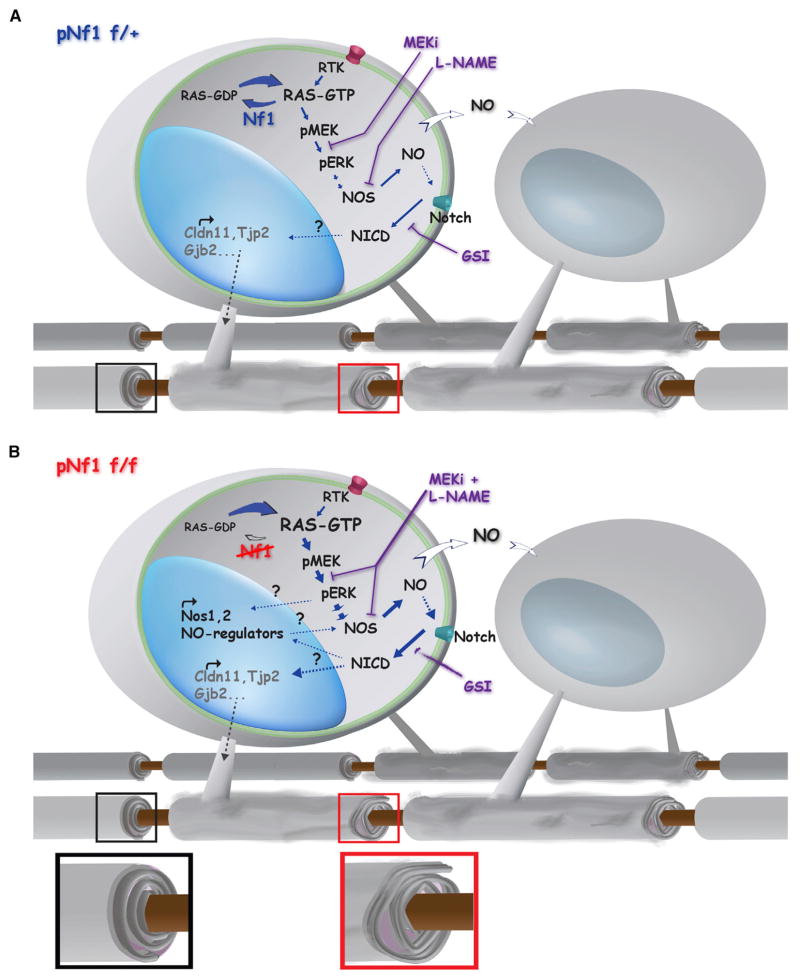
The RASopathy neurofibromatosis type 1 (NF1) is one of the most common autosomal dominant genetic disorders. In NF1 patients, neurological issues may result from damaged myelin, and mice with a neurofibromin gene (Nf1) mutation show white matter (WM) defects including myelin decompaction. Using mouse genetics, we find that altered Nf1 gene-dose in mature oligodendrocytes results in progressive myelin defects and behavioral abnormalities mediated by aberrant Notch activation. Blocking Notch, upstream mitogen-activated protein kinase (MAPK), or nitric oxide signaling rescues myelin defects in hemizygous Nf1 mutants, and pharmacological gamma secretase inhibition rescues aberrant behavior with no effects in wild-type (WT) mice. Concomitant pathway inhibition rescues myelin abnormalities in homozygous mutants. Notch activation is also observed in Nf1+/- mouse brains, and cells containing active Notch are increased in NF1 patient WM. We thus identify Notch as an Nf1 effector regulating myelin structure and behavior in a RASopathy and suggest that inhibition of Notch signaling may be a therapeutic strategy for NF1.

Keywords: glia; rasopathy.


Figures

Figure 1
Figure 1. Progressive Myelin Decompaction Regulated by MAPK Signaling in pNf1 Mutants
(A and B) Electron micrographs of the corpus callosum (CC) of WT, pNf1f/+, and pNf1f/f mice show regions of myelin decompaction (A, arrows; B, purple) at the indicated months (mo) post-tamoxifen treatment. Insets: regions from dotted rectangles (50,000×). Number of myelin wraps (triangles) in WT and pNf1f/f mutants are shown in (B). (C) The percent of decompacted fibers among total fibers and number of quadrants with decompaction (color code) in the short-term (ST; 1 month) and long-term (LT; 6–10 months) post-tamoxifen is shown. Significantly increased decompaction is found in pNf1f/f mice at ST (n = 5 mice,**p < 0.01), and in pNf1f/+ mice at LT (n = 3 mice,*p < 0.05), as compared to WT (ST-LT, n = 6 mice). Moderate (1–3 quadrants), but not significant (ns), decompaction is observed in pNf1f/+ mice at ST (n = 3 mice). MEKi treatment rescues decompaction in pNf1f/+ mutants (n = 3 mice, *p < 0.05) but does not change decompaction in pNf1f/f mutants (n = 3 mice). Data are presented as the mean + SEM. One-way ANOVA; p = 0.0005, and Tukey’s multiple comparisons test. (D) Immunostaining of pERK (red) and CC1 (white) in the CC of the indicated genotypes. Magnifications of squared regions (left) depict a pERK+;CC1 cell in WT (nuclear signal, arrowhead), pERK+(faint);CC1+ mOLs (yellow arrows) in pNf1f/+, and pERK+(strong);CC1+ mOLs in pNf1f/f mice. LV, lateral ventricle. Scale bar, 10 μm. (E) Significantly increased pERK+;CC1+/total CC1+ mOLs are found in pNf1f/f mice as compared to WT (n = 4 mice/genotype, t test;**p = 0.0053, data are the mean + SEM). See also Figures S1 and S2.
Figure 2
Figure 2. Increased Notch Pathway Activity in mOLs Causes Myelin Decompaction in pNf1 Mutants
(A) Data from microarray analysis and qRT-PCR validation show increased expression of genes in Nf1/ glial-enriched cultures (t test, Hes5****p < 0.0001; Dll1**p = 0.0055, Dll3**p = 0.004, n = 3 cultures). (B) Western blot analysis of Notch1 and Ras10 (loading control) indicates increased activated Notch 1 (97 kD) in Nf1−/− glia-enriched cultures. (C) RNA-seq analysis of pNf1f/f ON 1 month post-tamoxifen. Heatmap showing gene expression levels (log2 fold change) and p values for genes of canonical and non-canonical Notch ligands (Dll1, Dlk2, Dner, Cntn1, Thbs2, Postn, Jag1), Notch targets (Hes5, Cntnap2, Cttnbp2, Spi1), tight junctions (Cldn11, Tjp2), and GAP junctions (Gjb6, Gjb2). Expression of Mbp, Plp1, Mag, Mog, and Omg did not show significant changes (n = 3/genotype, DESeq normalization method). (D) Immunofluorescence of Hes5GFP (green), aNOTCH (red), and CC1 (white) 1 month post-tamoxifen. In magnification (right) of squared regions: Hes5GFP (yellow arrows) is detected in rare CC1+ (weak) mOLs, aNOTCH (arrowheads) is detected in cytoplasm of mOLs in WT (Hes5GFP) and nuclei of abundant mOLs in pNf1f/f;Hes5GFP mutant (pink, bottom/right). CC, corpus callosum; LV, lateral ventricle. Scale bar, 10 μm. (E) The percent of Hes5GFP+;CC1+/CC1+ cells significantly increases in pNf1f/f mutants as compared to WT (n = 4 mice/genotype, t test; **p = 0.0013). Inset: y axis enlargement. (F) The percent of aNOTCH+;CC1+/CC1+ cells significantly increases in pNf1f/f mutants (n = 7 mice) as compared to WT (n = 4 mice, t test; ***p = 0.001). Data are the mean + SEM. (G and H) Percent of decompacted fibers and severity of decompaction (quadrants) in the indicated genotypes in the short- (1 month) or long-term (6–9 months) post-tamoxifen. Increased decompaction is shown in PlpCre;RosaNICD (G, n = 4 mice, t test, ***p < 0.0001), and pRbpjf/f (H, n = 3 mice, *p < 0.01) as compared to WTs (n = 6 mice). Note that decompaction is not rescued in pNf1f/f;Rbpjf/f (versus pNf1f/f), but it is rescued by additional treatment with MEKi (n = 3, **p < 0.001, one-way ANOVA). Decompaction is fully rescued in pNf1f/+;Rbpjf/f mutants (versus pNf1 f/+, n = 3 mice/genotype, *p < 0.01 one-way ANOVA). Error bars show ± SEM. See also Figures S3 and S4.
Figure 3
Figure 3. Pharmacological Inhibition of Notch Activation in pNf1 Mutants Rescues Decompaction and Aberrant Behavior
(A) Number of Hes5GFP+ cells in the CC of vehicle-treated (n = 5 mice) or gamma secretase inhibitor (GSI)-treated (n = 12 mice) WT mice (t test, *p = 0.0001). (B) The percent of decompacted fibers and quadrants with decompaction does not change after GSI treatment in WT animals (n = 6 vehicle-treated, n = 4 GSI-treated animals, t test, ns, p = 0.4516) and pNf1f/f mutants (n = 5 mice/genotype, ns, p = 0.2768). Decompaction is rescued in pNf1f/+ mice treated with GSI (n = 4 mice, t test, **p = 0.0019) as compared to vehicle-treated pNf1f/+ (n = 3). ST, 1 month post-tamoxifen; LT, 6–10 months post-tamoxifen. (C and D) Evaluation of the acoustic startle response. (C) pNf1f/+ mutant mice (n = 21 mice) present increased Vmax to the acoustic startle response following the 73 dB, 77 dB, and 82 dB pre-pulse stimuli, as compared to WT mice (n = 19 mice, two-way ANOVA, F[4,152] = 3.05, *p < 0.05). (D) The heightened startle response in pNf1f/+ mutants is abolished after treatment with GSI MRK-003, as no significant difference in Vmax is observed between WT (n = 21 mice) and pNf1 mutants (n = 19 mice, two-way ANOVA, F[4,152] = 2.73). Error bars show ± SEM. See also Figure S4.
Figure 4
Figure 4. NO Controls Notch Activation and Concomitant Inhibition of Notch/NO or NO/MAPK Signaling Rescues Decompaction in pNf1f/f Mutants
(A) Decompacted fibers (%) and quadrants with decompaction in mice treated with L-NAME (7 days) and MEKi (21 days). L-NAME treatment rescues myelin compaction in the long-term (LT) pNf1f/+ mice (n = 4 mice/treatment, **p < 0.01). Note that % of decompacted fibers does not significantly change in L-NAME-treated pNf1f/f mice (ST, short-term), but decompaction is fully rescued in L-NAME-treated pNf1f/f;Rbpjf/f (n = 3 mice, *p < 0.05), or in L-NAME;MEKi-treated pNf1f/f (n = 3 mice, **p < 0.01), as compared to pNf1f/f mice. (B) Immunostaining of aNOTCH (red) and CC1 (white) in the CC of vehicle- or L-NAME-treated WTs and pNf1f/f mutants. Note the lower number of aNOTCH+;CC1+ cells in L-NAME-treated pNf1f/f mutants, as compared to untreated mutants. Scale bar, 10 μm. (C) WT and pNf1f/f mice show no significantly different numbers of aNOTCH+;CC1+ mOLs (yellow arrows in B) after L-NAME treatment (n = 3 mice/genotype, t test, p = 0.9721). Untreated animals (from Figure 2F) are shown for comparison. (D) Flow cytometry analysis of forebrain cells indicates that the number of GalC+ mOLs showing NO signals does not change in PlpCreER;RosaNICD (pNICD) mice, as compared to WT animals (n = 3 mice/genotype, t test, p = 0.86). (E) Flow cytometry analysis of forebrain cells indicates that the number of GalC+ mOLs showing NO signals does not change in pNf1f/f;pRbpjf/f mice as compared to pNf1f/f mutants (n = 3 mice/genotype, t test, p = 0.29). Error bars show ± SEM. See also Figure S4.
Figure 5
Figure 5. Notch Signaling Increases in Nf1+/− mice, and aNotch+ Cells Are Increased in NF1 Patient WM
(A and B) The number of Hes5GFP+ cells in the CC (A) of Nf1+/− mice is significantly increased (B), as compared to WT animals (n = 3 mice/genotype, t test, ***p = 0.0004). (C) Immunodetection of NICD (aNOTCH) with a specific antibody (Cell Signaling, cs2421) in the subcortical WM (scWM) of NF1 patient brains (n = 2) and normal human brains (n = 2). Representative aNOTCH nuclear signals are shown with red arrows (insets). Scale bars, 50 μm. (D) Quantification of total aNOTCH+ cells per 20× field suggests increased Notch activity in the scWM of NF1 patients, as compared to normal brain (n = 2 NF1 patients, n = 2 normal brains, 2 technical replicates/condition, t test, **p = 0.0042). (E) Quantification of aNOTCH+ cells as percent of total cells per 20× field supports increased Notch activity in the scWM of NF1 patients, as compared to normal brain (n = 2 NF1 patients, n = 2 normal brains, 2 technical replicates/condition, t test, ***p = 0.0014). Error and significance of the graphs reflect only experimental variability. Error bars show ± SEM. See also Figure S5.
Figure 6
Figure 6. Model of Nf1 Loss-Driven Myelin Decompaction
Increased MAPK/NO/Notch signaling may mediate myelin decompaction (gray-dotted arrows and insets), by downregulation of TJ/GJ proteins involved in myelin compaction such as Claudin 11 (Cldn11), ZO-2 (Tjp2), and Connexin 26 (Gjb2) in pNf1 mutants. (A) Decreased Nf1 (blue) results in increased RAS-GTP in mature oligodendrocytes, leading to hyperactive MAPK signaling (RTK →RAS →pMEK →pERK). Production of NO increases in response to hyperactive MAPK pathway (NOS, dashed arrow). Subsequently, NO promotes directly or indirectly (dotted line) Notch cleavage and translocation of NICD to the nucleus, where it regulates gene expression. Furthermore, diffusion of NO from Nf1 mutant oligodendrocytes (white arrows) might affect nearby oligodendrocytes increasing the number of decompacted fibers (bottom). Either pharmacological treatment alone (MEKi, L-NAME or GSI) rescues decompaction (purple lines). (B) Absent Nf1 (red) results in accumulation of RAS-GTP and stronger induction (thick arrows) of MAPK signaling and NO production. It is possible that long-lasting transcriptional and/or post-transcriptional changes (dotted lines with question marks) in molecules controlling NO levels (for example NOS1-2) might contribute to increases in NO. Subsequently, NO promotes Notch activation and regulation of myelin genes. Combination of inhibitors (MEKi and L-NAME, purple fused lines) rescues decompaction, while single agent treatments (for example GSI, fading purple arrow) improves severity but does not rescue decompaction. Note that genetic inactivation of Notch (Figure 5) combined with MEKi or L-NAME, also rescues compaction in this setting.

Similar articles

Cited by

References

    1. Acosta MT, Gioia GA, Silva AJ. Neurofibromatosis type 1: new insights into neurocognitive issues. Curr Neurol Neurosci Rep. 2006;6:136–143. - PubMed
    1. Acosta MT, Bearden CE, Castellanos FX, Cutting L, Elgersma Y, Gioia G, Gutmann DH, Lee YS, Legius E, Muenke M, et al. The Learning Disabilities Network (LeaDNet): using neurofibromatosis type 1 (NF1) as a paradigm for translational research. Am J Med Genet A. 2012;158A:2225–2232. - PMC - PubMed
    1. Anastasaki C, Woo AS, Messiaen LM, Gutmann DH. Elucidating the impact of neurofibromatosis-1 germline mutations on neurofibromin function and dopamine-based learning. Hum Mol Genet. 2015;24:3518–3528. - PMC - PubMed
    1. Barrett SD, Bridges AJ, Dudley DT, Saltiel AR, Fergus JH, Flamme CM, Delaney AM, Kaufman M, LePage S, Leopold WR, et al. The discovery of the benzhydroxamate MEK inhibitors CI-1040 and PD 0325901. Bioorg Med Chem Lett. 2008;18:6501–6504. - PubMed
    1. Bearden CE, Hellemann GS, Rosser T, Montojo C, Jonas R, Enrique N, Pacheco L, Hussain SA, Wu JY, Ho JS, et al. A randomized placebo-controlled lovastatin trial for neurobehavioral function in neurofibromatosis I. Ann Clin Transl Neurol. 2016;3:266–279. - PMC - PubMed

Publication types

MeSH terms