. 2017 Apr 18;19(3):584-600.
doi: 10.1016/j.celrep.2017.03.059.

Hepatocellular Carcinomas Originate Predominantly from Hepatocytes and Benign Lesions from Hepatic Progenitor Cells

Affiliations

Hepatocellular Carcinomas Originate Predominantly from Hepatocytes and Benign Lesions from Hepatic Progenitor Cells

Krishna S Tummala et al. Cell Rep. .

Abstract

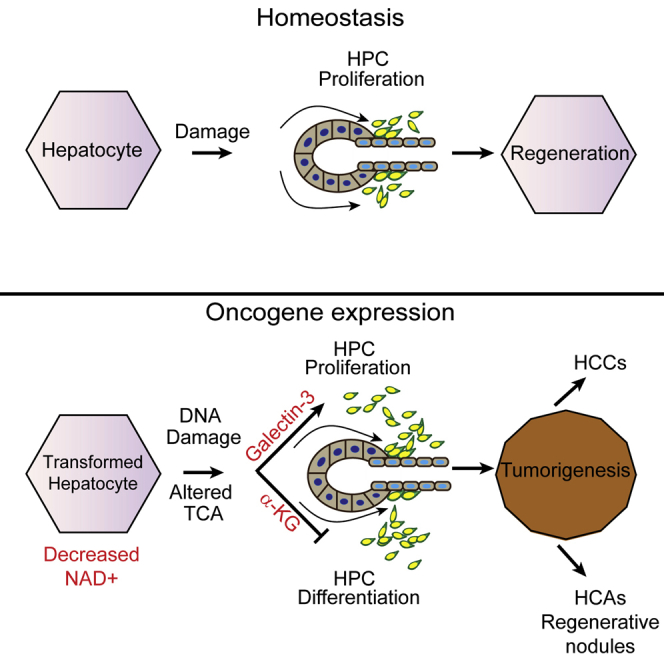
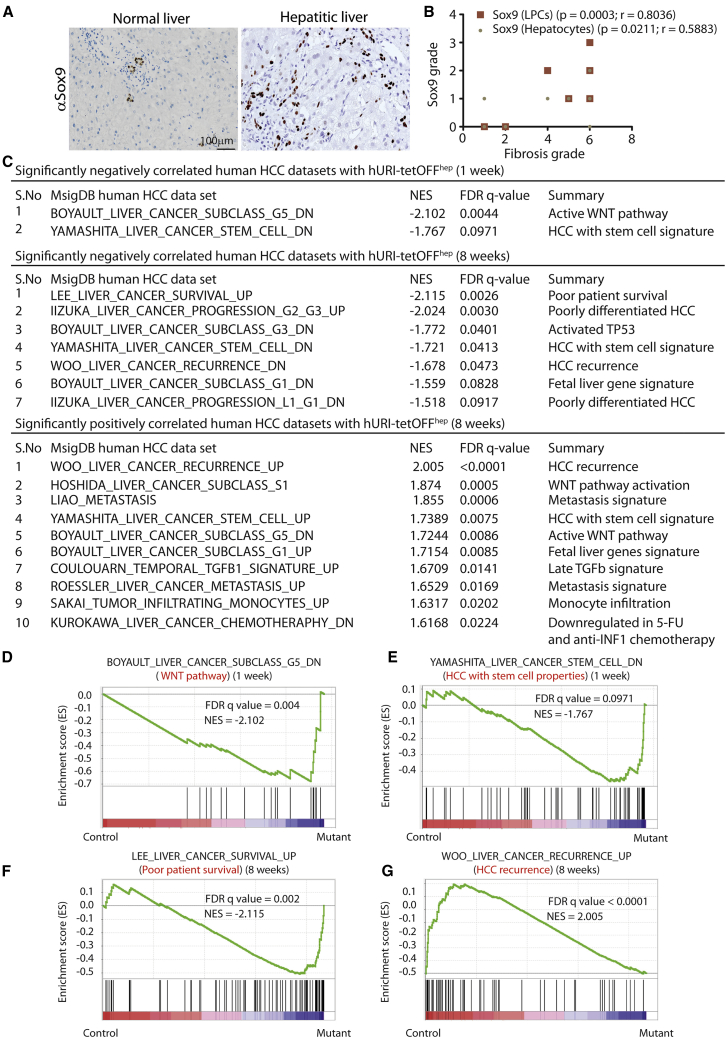
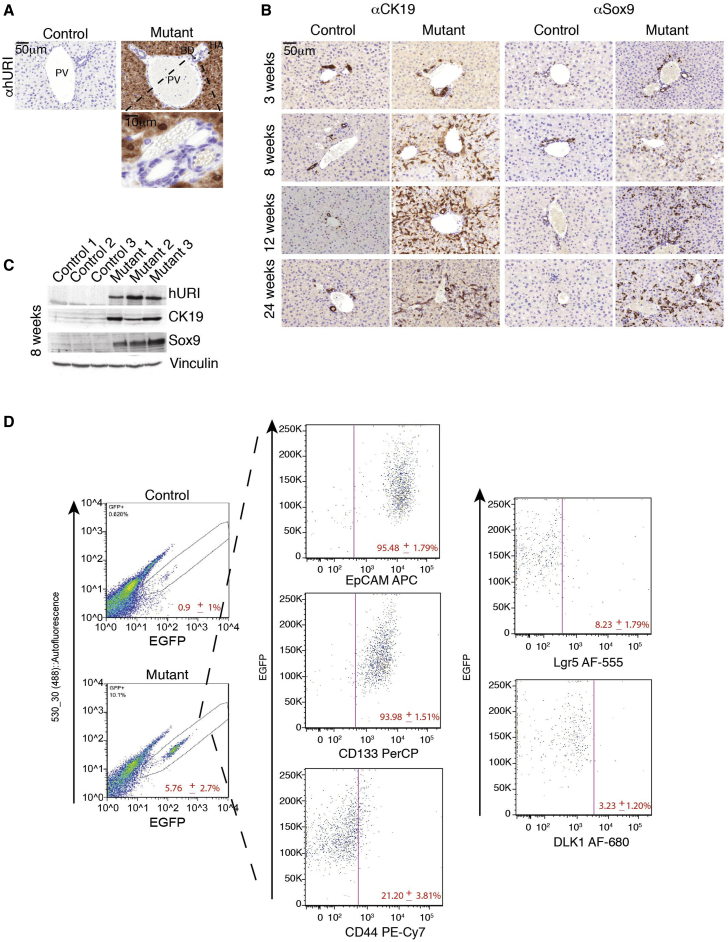
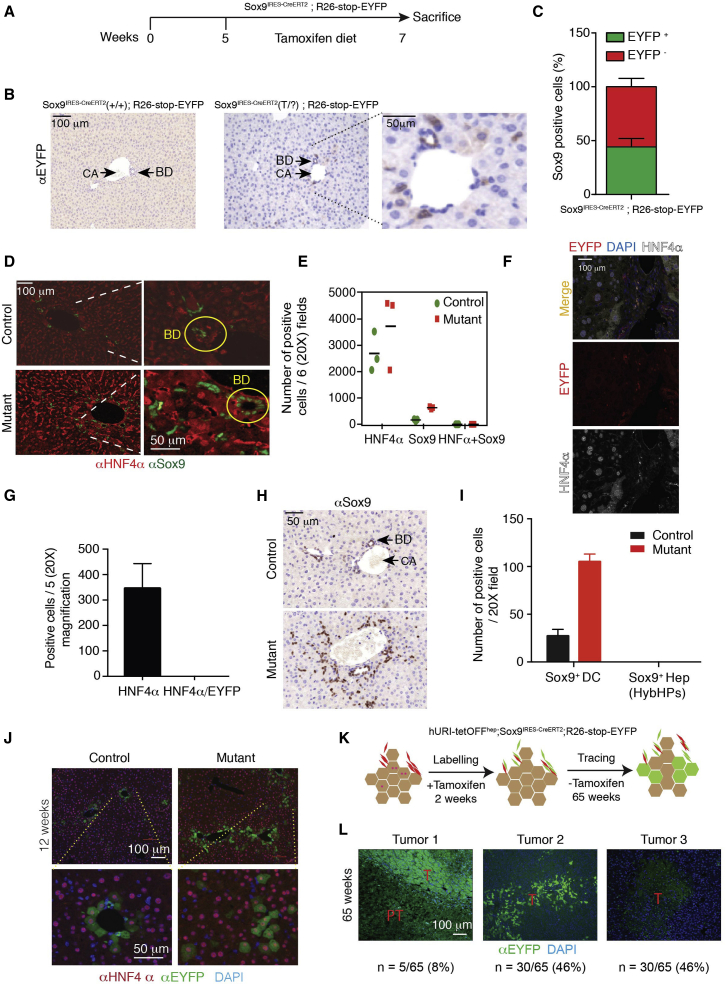
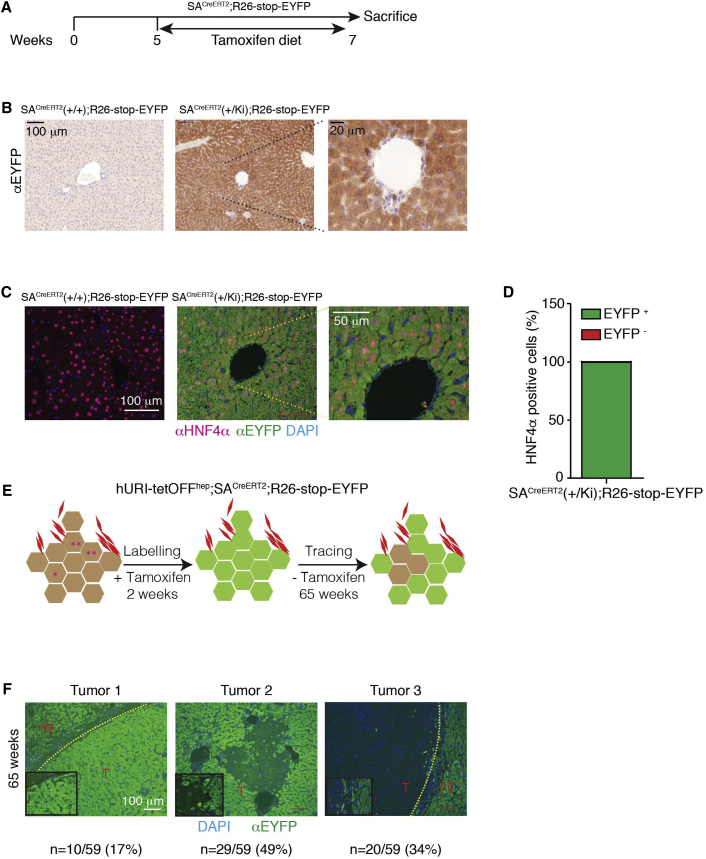
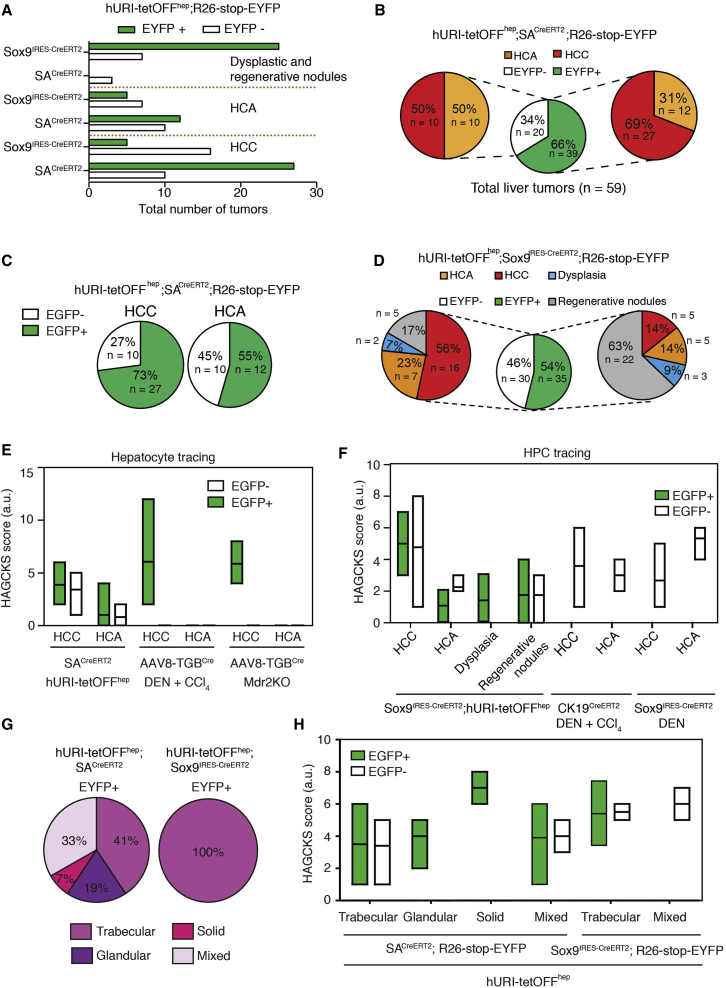
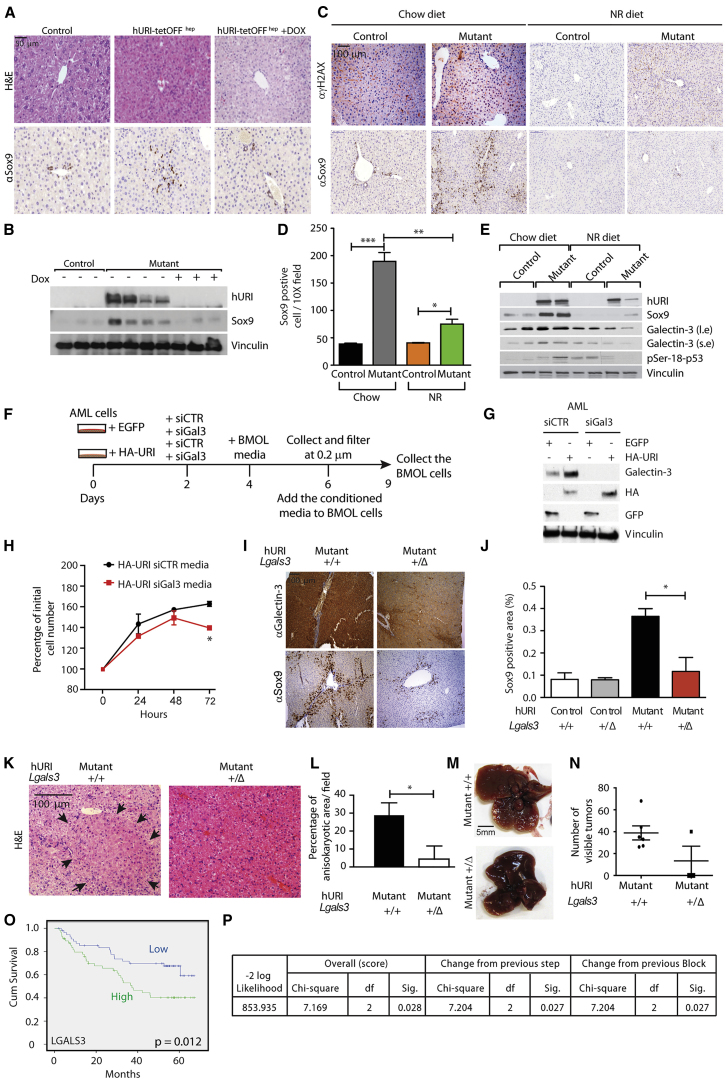
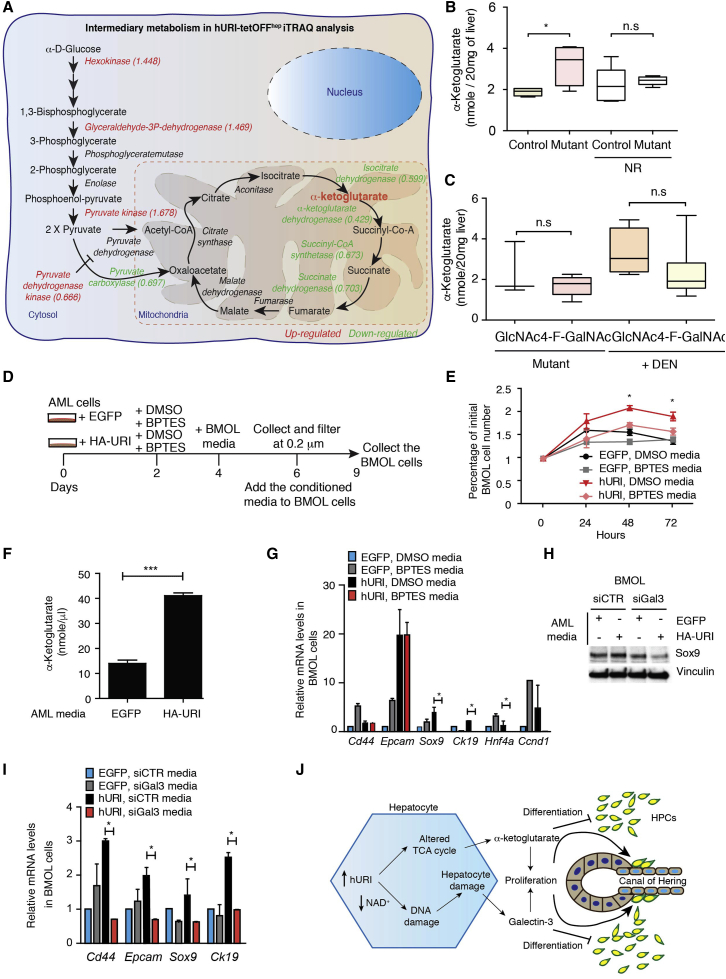
Hepatocellular carcinoma (HCC) is an aggressive primary liver cancer. However, its origin remains a debated question. Using human data and various hepatocarcinogenesis mouse models, we show that, in early stages, transformed hepatocytes, independent of their proliferation status, activate hepatic progenitor cell (HPC) expansion. Genetic lineage tracing of HPCs and hepatocytes reveals that, in all models, HCC originates from hepatocytes. However, whereas in various models tumors do not emanate from HPCs, tracking of progenitors in a model mimicking human hepatocarcinogenesis indicates that HPCs can generate benign lesions (regenerative nodules and adenomas) and aggressive HCCs. Mechanistically, galectin-3 and α-ketoglutarate paracrine signals emanating from oncogene-expressing hepatocytes instruct HPCs toward HCCs. α-Ketoglutarate preserves an HPC undifferentiated state, and galectin-3 maintains HPC stemness, expansion, and aggressiveness. Pharmacological or genetic blockage of galectin-3 reduces HCC, and its expression in human HCC correlates with poor survival. Our findings may have clinical implications for liver regeneration and HCC therapy.

Keywords: DNA damage; HCC; NAD(+); adenomas; galectin-3; hepatic progenitor cells; hepatocytes; lineage tracking; regenerative nodules; α-ketoglutarate.


Figures

None
Graphical abstract
Figure 1
Figure 1
hURI-tetOFFhep Mice Display HPC Signatures in Early Hepatocarcinogenesis Stages Correlating with Aggressive Human HCC (A) Representative images of Sox9 immunohistochemistry (IHC) in human hepatitis samples. Sox9 expression was evaluated in the liver progenitor cells (LPCs) and hepatocytes (n = 15). (B) Graph representing the correlation between fibrosis grade and Sox9 expression in human hepatitis samples (n = 15). (C) Table summarizing the most significantly enriched human HCC gene sets in 1- or 8-week-old hURI-tetOFFhep mice. (D) GSEA of human HCC WNT pathway and 1-week-old hURI-tetOFFhep mice protein signature. (E) GSEA of human HCC stem cell properties and 1-week-old hURI-tetOFFhep mice protein signature. (F) GSEA of human HCC poor patient survival and 8-week-old hURI-tetOFFhep mice protein signature. (G) GSEA of human HCC recurrence and 8-week-old hURI-tetOFFhep mice protein signature. All protein signature datasets obtained for hURI-tetOFFhep mice were previously described and achieved by iTRAQ (Tummala et al., 2014). Normalized enrichment score (NES) and false discovery rate (FDR) q-values are indicated in each graph. Scale bar represents 100 μm.
Figure 2
Figure 2
HPCs Expand in the Early Stages of Hepatocarcinogenesis (A) IHC of 1-week-old hURI-tetOFFhep mouse livers using an antibody recognizing specifically hURI. HA, hepatic artery; BD, bile duct; PV, portal vein. (B) Sox9 and CK19 IHC in liver sections derived from 3-, 8-, 12-, and 24-week-old hURI-tetOFFhep mice. (C) Western blot (WB) of liver lysates from 8-week-old hURI-tetOFFhep mice. Membranes were blotted with the indicated antibodies. (D) FACS of EGFP-positive cells isolated from hURI-tetOFFhep mouse crossed with Sox9IRES-EGFP line. SPCs (EGFP positive) were then analyzed for expression of the indicated markers (EpCAM, CD133, CD44, Lgr5, and DLK1) (n = 6). Scale bars represent 50 μm and 10 μm.
Figure 3
Figure 3
HPCs Contribute to Liver Tumorigenesis (A) Schematic representation of tamoxifen-treated Sox9IRES-creERT2; R26-stop-EYFP. 5-week-old mice were fed with tamoxifen diet for 2 weeks and then sacrificed at 7 weeks of age. (B) EYFP IHC in liver sections derived from 7-week-old Sox9IRES-creERT2; R26-stop-EYFP mice treated as described in (A) (n = 3). (C) Quantification of co-IF of Sox9 and EYFP in mice treated as described in (A) (n = 3). (D) Co-IF of Sox9 and HNF4α in Sox9IRES-creERT2; R26-stop-EYFP mice. n = 3. BD, bile duct. (E) Quantification of (D) (n = 3). (F) Representative images of confocal microscopy of EYFP and HNF4α co-IF in 4-week old Sox9IRES-creERT2; R26-stop-EYFP mice. (G) Quantification of (F) (n = 5 mice). (H) Sox9 IHC in liver sections derived from 12-week-old hURI-tetOFFhep mice (n = 5). (I) Quantification of (G) (n = 5). (J) Co-IF of HNF4α and EYFP in liver sections derived from 12-week-old hURI-tetOFFhep; Sox9IRES-creERT2; R26-stop-EYFP mice (n = 5). (K) Schematic representation of tamoxifen-treated hURI-tetOFFhep; Sox9IRES-creERT2; R26-stop-EYFP mice. 5-week-old mice were fed with tamoxifen diet for 2 weeks and sacrificed at 65 weeks of age. (L) Representative immunofluorescence images of three different EYFP staining patterns observed in tumors from hURI-tetOFFhep; Sox9IRES-creERT2; R26-stop-EYFP mice treated as described in (K). T, tumor; PT, peritumor; n = 65 tumors. Data are presented as mean ± SEM. Scale bars represent 100 μm and 50 μm.
Figure 4
Figure 4
Hepatocytes Contribute to Liver Tumorigenesis (A) Schematic representation of tamoxifen-treated SAcreERT2; R26-stop-EYFP mice. 5-week-old mice were fed with tamoxifen diet for 2 weeks and sacrificed at 7 weeks of age. (B) Representative images of EYFP IHC performed in liver sections derived from SAcreERT2; R26-stop-EYFP mice treated as described in (A) (n = 3). (C) Co-IF images of HNF4α and EYFP in liver sections derived from mice treated as described in (A) (n = 3). (D) Quantification of percentage of hepatocytes positive for both HNF4α and EYFP, as described in (C) (n = 3). (E) Schematic representation of tamoxifen-treated hURI-tetOFFhep; SAcreERT2; R26-stop-EYFP mice. 5-week-old mice were treated for 2 weeks with tamoxifen and sacrificed at 65 weeks of age. (F) Representative IF images of three different EYFP staining pattern observed in tumors from hURI-tetOFFhep; SAcreERT2; R26-stop-EYFP mice treated as described in (E); n = 16 mice and 59 tumors. Scale bars represent 100 μm, 50 μm, and 20 μm.
Figure 5
Figure 5
HCC Predominantly Originates from Hepatocytes, and HPCs Contribute to Liver Tumor Heterogeneity (A) Graph representing normalized number of EGFP-positive and EGFP-negative dysplastic and RNs, HCAs, and HCCs derived from hURI-tetOFFhep crossed with SACreERT2; R26-stop-EYFP and hURI-tetOFFhep crossed with Sox9CreERT2; R26-stop-EYFP. (B) Central pie chart representing total liver tumors derived from hURI-tetOFFhep crossed with SACreERT2; R26-stop-EYFP. Right pie chart represents the percentage of HCCs and HCAs derived from hepatocytes. Left pie chart represents the percentage of HCCs and HCAs derived from the non-hepatocytic population. (C) Left pie chart represents the total number of HCCs positive or negative for EYFP and derived from hURI-tetOFFhep crossed with SACreERT2; R26-stop-EYFP mice. Right pie chart represents the total number of liver HCAs positive or negative for EYFP and derived from hURI-tetOFFhep crossed with SACreERT2; R26-stop-EYFP mice. (D) Central pie chart representing normalized number of liver tumors derived from hURI-tetOFFhep crossed with Sox9IRES-CreERT2; R26-stop-EYFP mice. Right pie chart represents the normalized percentage of liver lesions derived from HPCs. Left pie chart represents the percentage of liver lesions derived from a distinct population than HPCs. (E) HAGCKS score for EGFP-positive and EGFP-negative HCCs or HCAs obtained after hepatocyte tracing in hURI-tetOFFhep crossed with SACreERT2; R26-stop-EYFP mice (n = 59), R26-mTOM-stop-mGFP mice infected with AAV8-TgbCre and treated with DEN and CCl4 (n = 42), and Mdr2KO mice crossed with R26-stop-ZsGreen mice and infected with AAV8-TgbCre (n = 7). (F) HAGCKS score for EGFP-positive and EGFP-negative HCC, HCA, dysplasia or RNs obtained after HPC tracing in hURI-tetOFFhep crossed with Sox9CreERT2; R26-stop-EYFP mice (n = 65), CK19CreERT2; R26-mTOM-stop-mGFP mice treated with DEN and CCl4 (n = 8), and Sox9CreERT2; R26-stop-EYFP mice treated with DEN (n = 6). (G) Pie charts representing type of HCC derived from hepatocytes in SACreERT2; R26-stop-EYFP mice (left chart), or HPCs in Sox9IRES-CreERT2; R26-stop-EYFP mice (right chart). (H) HAGCKS score for EGFP-positive and EGFP-negative HCCs derived from hURI-tetOFFhep crossed with SACreERT2; R26-stop-EYFP mice (n = 59), and hURI-tetOFFhep crossed with Sox9CreERT2; R26-stop-EYFP mice (n = 65) and plotted according to tumor type. Data are presented as mean ± SEM.
Figure 6
Figure 6
Hepatocytes Expressing Oncogenic URI Produce Galectin-3 to Instruct and Activate HPCs (A) Representative images of H&E and Sox9 staining in liver sections derived from 8-week-old hURI-tetOFFhep mice fed with either chow or doxycycline (Dox) diet as previously described (Tummala et al., 2014). (B) WB of liver extracts from 8-week-old hURI-tetOFFhep mice fed with either a chow or Dox diet as previously described (Tummala et al., 2014). Membranes were blotted with the indicated antibodies. (C) Representative images of γH2AX and Sox9 IHC in liver sections derived from 8-week-old hURI-tetOFFhep mice fed with either chow or nicotinamide riboside (NR) diet (Tummala et al., 2014). (D) Quantification of Sox9 staining from (C) (n = 4). (E) WB of liver extracts from 8-week-old hURI-tetOFFhep mice fed with either chow or NR diet. Membranes were blotted with the indicated antibodies. l.e., long exposure; s.e., short exposure. (F) Schematic representation of AML-12 and BMOL cell treatment. Media from EGFP- or HA-URI-overexpressing AML-12 cells transfected either with siCTR or siGal3 was used to culture BMOL cells for 3 days. (G) WB of AML-12 cells from (F). Membranes were blotted with the indicated antibodies. (H) Number of BMOL cells after 0, 24, 48, and 72 hr of incubation with media from AML-12 cells from (F). (I) Representative images of Sox9 and galectin-3 IHC in liver sections derived from 8-week-old mutant; Lgals3+/+ and mutant; Lgals3+/Δ mice. (J) Quantification of Sox9 IHC from (I). n = 4 for control; Lgals3+/+ and mutant; Lgals3+/+ and n = 3 for control; Lgals3+/Δ and for control; Lgals3+/Δ. (K) Representative images of H&E in liver sections derived from 10-week-old mutant(KI/KI); Lgals3+/+ and mutant(KI/KI); Lgals3+/Δ mice. Black arrows denote anisokaryotic area. (L) Quantification of anisokaryotic area from (K) (n = 3). (M) Representative images of livers derived from 10-week-old mutant(KI/KI); Lgals3+/+ and mutant(KI/KI); Lgals3+/Δ mice. (N) Quantification of number of visible tumors in livers from (M). n = 6 for mutant(KI/KI); Lgals3+/+ and n = 3 for mutant(KI/KI); Lgals3+/Δ. (O) Kaplan-Meier curve of human HCC patient cumulative survival based on the expression of LGALS3. Degrees of freedom = 1; chi-square = 6.243; p = 0.012. (P) Multivariate Cox regression survival for LGALS3 and URI1 in 221 patient human HCC gene expression analyses. (p = 0.027). “df” and “Sig.” represents degrees of freedom and significance, respectively. Data are presented as mean ± SEM. p ≤ 0.05; ∗∗p ≤ 0.01; ∗∗∗p ≤ 0.001. Scale bars represent 5 mm, 100 μm, and 50 μm.
Figure 7
Figure 7
Hepatocytes Expressing Oncogenic URI Produce α-Ketoglutarate and Galectin-3 to Preserve an HPC Undifferentiated State (A) Schematic representation of intermediary metabolism induced in hURI-tetOFFhep mice. Data were obtained and analyzed from previous iTRAQ data obtained from livers from 1- or 8-week-old hURI-tetOFFhep mice (Tummala et al., 2014). Fold changes are represented within the brackets. Upregulated enzymes are represented in red, and downregulated enzymes are represented in green. (B) Histogram representing α-ketoglutarate levels from livers from either NR-treated or untreated 12-week-old hURI-tetOFFhep mice as indicated. n = 6 for controls and mutants; n = 5 for controls and mutants treated with NR. (C) Histogram representing α-ketoglutarate levels from livers from 4-week-old hURI-tetOFFhep mice (mutant) and DEN-treated C57BL/6 mice. Mice were treated with either GlcNAc or 4-F-GalNAc for 3 weeks. n = 3 for mutants treated with GlcNAc. (D) Schematic representation of AML-12 and BMOL cell treatment. Media from HA-URI-overexpressing AML-12 cells treated either with DMSO or BPTES (10 μM) was used to culture BMOL cells for 3 days. (E) Cell number of BMOL cells after 0, 24, 48, and 72 hr of incubation with media from AML-12 cells from (D). (F) Histogram representing α-ketoglutarate levels in media from AML-12 cells stably overexpressing EGFP or HA-URI. (G) qRT-PCR of BMOL cells cultured with media from AML-12 cells as described in (D). (H) WB of BMOL cells after 72 hr incubation with media from AML-12 cells stably overexpressing EGFP or HA-URI and transfected with either siCTR or siGal3. Membrane was blotted with the indicated antibodies. (I) qRT-PCR of BMOL cells cultured with media from AML-12 cells as described in (H). (J) Scheme representing hepatocytes expressing oncogenic URI-secreted galectin-3 to induce HPC proliferation, whereas α-ketoglutarate preserves an HPC undifferentiated state during expansion. Data are presented as mean ± SEM. ns, non significant; p ≤ 0.05; ∗∗∗p ≤ 0.001.

References

    1. Boyault S., Rickman D.S., de Reyniès A., Balabaud C., Rebouissou S., Jeannot E., Hérault A., Saric J., Belghiti J., Franco D. Transcriptome classification of HCC is related to gene alterations and to new therapeutic targets. Hepatology. 2007;45:42–52. - PubMed
    1. Burén S., Gomes A.L., Teijeiro A., Fawal M.A., Yilmaz M., Tummala K.S., Perez M., Rodriguez-Justo M., Campos-Olivas R., Megías D., Djouder N. Regulation of OGT by URI in Response to Glucose Confers c-MYC-Dependent Survival Mechanisms. Cancer Cell. 2016;30:290–307. - PubMed
    1. Carey B.W., Finley L.W., Cross J.R., Allis C.D., Thompson C.B. Intracellular α-ketoglutarate maintains the pluripotency of embryonic stem cells. Nature. 2015;518:413–416. - PMC - PubMed
    1. Carpentier R., Suner R.E., van Hul N., Kopp J.L., Beaudry J.B., Cordi S., Antoniou A., Raynaud P., Lepreux S., Jacquemin P. Embryonic ductal plate cells give rise to cholangiocytes, periportal hepatocytes, and adult liver progenitor cells. Gastroenterology. 2011;141:1432–1438. - PMC - PubMed
    1. Coulouarn C., Factor V.M., Thorgeirsson S.S. Transforming growth factor-beta gene expression signature in mouse hepatocytes predicts clinical outcome in human cancer. Hepatology. 2008;47:2059–2067. - PMC - PubMed

LinkOut - more resources