. 2017 Apr 18;19(3):601-616.
doi: 10.1016/j.celrep.2017.03.064.

Intratumoral Cancer Cell Intravasation Can Occur Independent of Invasion into the Adjacent Stroma

Affiliations

Intratumoral Cancer Cell Intravasation Can Occur Independent of Invasion into the Adjacent Stroma

Elena I Deryugina et al. Cell Rep. .

Abstract

Intravasation, active entry of cancer cells into the circulation, is often considered to be a relatively late event in tumor development occurring after stromal invasion. Here, we provide evidence that intravasation can be initiated early during tumor development and proceed in parallel to or independent of tumor invasion into surrounding stroma. By applying direct and unbiased intravasation-scoring methods to two histologically distinct human cancer types in live-animal models, we demonstrate that intravasation takes place almost exclusively within the tumor core, involves intratumoral vasculature, and does not involve vasculotropic cancer cells invading tumor-adjacent stroma and migrating along tumor-converging blood vessels. Highlighting an additional role for EGFR in cancer, we find that EGFR is required for the development of an intravasation-sustaining intratumoral vasculature. Intratumoral localization of intravasation supports the notion that overt metastases in cancer patients could be initiated much earlier during cancer progression than appreciated within conventional clinical tumor staging systems.

Keywords: EGFR; animal models of cancer; cancer metastasis; cell intravasation; chorioallantoic membrane model; mouse ear tumor model; stromal invasion; tumor angiogenesis; tumor cell migration; tumor invasion.


Figures

Figure 1
Figure 1. Cancer Cell Intravasation in the Mouse Ear Model System
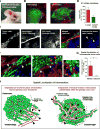
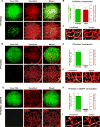
(A) Highly vascularized HT-hi/diss primary tumor developing in the ear of NOD-SCID mice. (B and C) HT-lo/diss and HT-hi/diss primary tumors examined by immunofluorescent microscopy: green, GFP-tagged tumor cells; red, vasculature highlighted with i.v.-inoculated TRITC-dextran. Bar, 250 µm. (D) HT-hi/diss metastasis in the lungs (n=4) and lymph nodes (n=8) quantified by human Alu-qPCR. (E) HT-hi/diss primary tumor examined by scanning laser confocal microscopy: GFP-tagged tumor cells (i), dextran-highlighted vasculature (ii), and cell nuclei highlighted by NucBlue (iii); the merged-channel image (iv) depicts tumor cells in green, vasculature in red and cell nuclei in blue. IMARIS software was employed to identify intravascular-located tumor cells (v, yellow signal and arrowheads). Bar, 25 µm. (F) High-resolution analysis of tumor cells located intravascular (i, yellow arrowheads), abluminal along vessel surface (ii, blue arrowheads), or appearing as entering into the vessel (iii, pink arrowheads). Bar, 25 µm. (G) Automated quantification of intravascular tumor cells localized either to the inner portion of primary tumors (interior) or to stroma-invading outgrowths (exterior). A total of 540 cells were identified as intravascular cells, among which 532 cells (98.5%) were localized to the center of primary tumors (n=4). *, P<0.05. (H) Schematic models depicting spatial localization of intravasation process. Left, According to a conventional model, intravasation occurs beyond original tumor boundaries, and therefore, intravasation events (yellow) would mainly be localized at the invasive front within tumor-converging blood vessels, co-opted or newly-formed. Right, According to an alternative model, supported by the findings of this study, the intravasation process occurs almost exclusively within the core of the primary tumor and therefore, intravasation events (yellow) are localized to the intratumoral angiogenic vasculature.
Figure 2
Figure 2. Quantitative Analysis of Cancer Cell Intravasation in Avian Model Systems
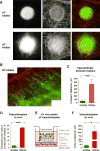
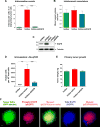
(A) Representative images of HT-lo/diss (top) and HT-hi/diss (bottom) primary tumors depicted in the green channel to delineate GFP-tagged tumor cells (left), red channel to visualize LCA-labeled vasculature (middle), and merged channels (right) to appreciate the entire primary tumor (green) against CAM vasculature (red). Bars, 100 µm. (B) Vasculotropic behavior of HT-hi/diss cells. The GFP-tagged tumor cells, escaping from the primary tumor (green), appear to migrate along tumor-converging blood vessels (red). Bar, 50 µm. (C) Quantification of vasculotropic stromal invasion from HT-lo/diss and HT-hi/diss primary tumors. n≥11 for each group. ***, P<0.001. (D) Quantification of vasculotropic fibrosarcoma cells associated with tumor-converging blood vessels in HT-lo/diss and HT-hi/diss tumors (3 independent experiments). A total of 519 cells were analyzed in the highly invasive HT-hi/diss tumors (n=12), whereas only 65 cells were available for analysis of largely non-invasive HT-lo/diss tumors (n=9). ***, P<0.001. (E) Ex vivo Transwell model for measuring vasculotropic behavior of tumor cells. GFP-tagged tumor cells are placed into inserts containing porous membrane occluded with native collagen. The inserts are placed into wells containing collagen-embedded blood vessels at the bottom. The cells are allowed to migrate towards chemoattractants emanated into serum-free-medium from the vessels. Transmigrated GFP cells are collected and quantified. (F) Quantification of tumor cell vasculotropism ex vivo. GFP-tagged HT-lo/diss and HT-hi/diss tumor cells that transmigrated across the collagen layer towards blood vessels were collected and quantified using immunofluorescent microscope. n≥11 for each group. *, P<0.05.
Figure 3
Figure 3. Discrimination between Intraluminal and Abluminal Position of Cancer Cells within the Primary Tumor
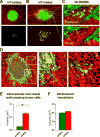
(A and B) Tumors were initiated from GFP-labeled HT-lo/diss cells (A) and HT-hi/diss cells (B). The vasculature was contrasted in vivo with Rhodamine-LCA (top). Bars, 200 µm. Z-stacks were acquired with a confocal microscope and rendered 3D in IMARIS (bottom), allowing with a conservative threshold, to delineate a real colocalization signal (yellow), associated with intravascular tumor cells and tumor cells crossing vessel walls. (C) 3D IMARIS images from the area boxed in (B), depicting HT-hi/diss cells (green) and blood vessel (red) in translucent (top) or opaque (bottom) modes allowing for discrimination between intravascular-localized tumor cells (yellow arrowheads) and tumor cells located on the abluminal surface of the vessel (open arrowheads). (D) High resolution slice of a whole HT-hi/diss tumor imaged at 63×. Enlarged boxed areas (i and ii) on the right depict GFP-tagged tumor cells (green) appearing as entering blood vessels (blue arrowheads) or located at the abluminal surface of the vessels (open arrowheads). Bar, 5 µm. (E and F) Total volume of tumor cells identified as intravascular or crossing vessel walls (E) and the volume of intratumoral vasculature (F) were quantified in HT-lo/diss and HT-hi/diss primary tumors (n=4 for each tumor type). *, P< 0.05.
Figure 4
Figure 4. Spatial Localization and Quantification of Intravasation Events across the Entire Primary Tumor
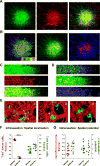
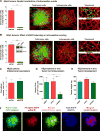
(A) HT-hi/diss tumors were initiated from GFP-tagged cells (left). The vasculature was highlighted in live embryos with Rhodamine-LCA (m iddle). Merged signals are depicted on the right. Original magnification, 20×. Bar, 200 µm. (B) The images in (A) were rendered 3D in IMARIS and processed further to assign each and all tumor cells a distinct color depending on their distance from the center of the nearest blood vessel. Left, According to the “in-out” scale on the bottom, the tumor cells localized within 2–5 µm from the lumen center fell into the yellow-red-orange (“hot”) category, whereas the farther-distanced tumor cells were designated as dark blue-violet. Middle, Segregated “orange-red” cells were overlaid over the green signal representing all tumor cells (note that orange-red signals become yellow when merged with green signal). Right, Segregated “hot” tumor cells were overlaid in magenta color over the signal representing total vasculature that was rendered cyan blue for clarity. Note the inner tumor core position of almost all “hot” cells. (C and D) A portion of the tumor (boxed area in A) was imaged at 40× magnification, and processed as described in (A) and (B), respectively. Bar, 50 µm. (E) High resolution (63×) 3D-IMARIS-processed images were rendered translucent to visualize tumor cells localized intravascular (yellow arrowheads in i and ii) or appearing as entering blood vessels (white arrowheads in mutually rotated images ii and iii). Bars, 10 µm. (F)Hot” tumor cells (scattergrams on the left) and total tumor cells (scattergrams on the right) were quantified in different portions of primary tumors, namely in the inner core (interior) and invasive outgrowths along blood vessels (exterior). Data points are fractions of intraluminal “hot” or total tumor cells in the interior or exterior of individual tumors (n=15). (G) Intravasation potential of tumor cells localized to the interior or exterior of primary tumors. Volumes of vasculature associated with the indicated tumor portion are presented as a fraction of total signal associated with the solidified vasculature (scattergrams on the left). Intravasation potential was quantified as the ratio between the volume of the vasculature and the number of tumor cells in the indicated area of the primary tumor and is expressed in arbitrary units (scattergrams on the right). Data points represent individual tumors (n=10). ***, P<0.001.
Figure 5
Figure 5. Intravasation Efficiency Correlates with the Metastatic Potential of Tumor Variants and Depends on EGFR Expression
Tumors were initiated from GFP-tagged HT-hi/diss cells (A–C; n=10), HT-lo/diss cells (D–F; n=5), and HT-hi/diss cells treated with siEGFR (G–I; n=10). (A, D, and G) The original signals for tumor cells (green) and the vasculature (red) and merged channels are presented on the top. The signals for segregated intravascular-localized tumor cells, the 3D-rendered vasculature and their colocalization are presented at the bottom. Bars, 100 µm. (B, E, and H) Intravasation potentials of tumor cell variants (green bars on the left) were quantified as the ratios between the volume of intratumoral vasculature and the total number of primary tumor cells. Intravasation indices (red bars on the right) were calculated for individual tumors as the ratios of segregated intravascular-positioned tumor cell numbers to the volume of intratumoral vasculature. Both parameters are expressed in arbitrary units. (C, F, and I) The translucent and opaque modes of high-resolution images verify the intravascular localization of segregated tumor cells. Bars, 25 µm.
Figure 6
Figure 6. Comparative Analysis of Intravasation Capabilities of Tumor Variants Relative to Expression of EGFR Protein
(A–B) Tumors, initiated from GFP-tagged HT-lo/diss cells (n=7) and HT-hi/diss cells, untreated (n=14) and treated with siEGFR (n=11), were analyzed as entire units for the number of intravascular tumor cells (A) and the volume of intratumoral vasculature (B). ***, P<0.001. (C) Analysis of EGFR protein expression in HT-lo/diss, HT-hi/diss cells 4 days after treatment with control (siCtrl) and EGFR-specific (siEGFR) siRNA. Below, α-tubulin is shown as protein-loading control. Position of molecular weight markers is indicated on the left. (D–E) Primary tumors were initiated in ovo from GFP-tagged HT-lo/diss cells (n=11) and HT-hi/diss cells, treated with control siRNA (siCtrl; n=47) or siEGFR (n=29). Embryos were analyzed by human Alu-qPCR for the number of intravasated tumor cells trapped in the CAM vasculature (C) and tumor growth (D) **, P<0.01; ***, P<0.001. (F) Intramesodermal primary tumors, initiated from GFP-labeled HT-hi/diss tumor cells, were stained on day 5 for phospho EGFR (pEGFR) and total EGFR. Signals for green (GFP), red (pEGFR) and far red (total EGFR, depicted here in blue) fluorescence were acquired monochromatically and then “colored” and merged using Adobe Photoshop software. Bars, 200 µm.
Figure 7
Figure 7. Intratumoral and EGFR-Dependent Intravasation of Human Carcinoma Cells
(A) Tumors were initiated from GFP-tagged HEp3 cells (n=4) and analyzed as entire units. Bar graph, Intravascular tumor cells localized either within the core of primary tumors (interior) or outside of tumor borders (exterior) were quantified as a percentage of total tumor cells. **, P<0.01. Representative image on the left depicts a HEp3 tumor against LCA-highlighted CAM vasculature (merged signals). The middle image depicts segregated tumor cells localized within the tumor vasculature. Bars, 100 µm. Images on the right depict intratumoral blood vessels harboring fully intravasated tumor cells, which are visible in translucent mode and become invisible when vessel surface is made opaque. Bar, 25 µm. (B) Tumors were initiated from GFP-tagged HEp3 cells treated with control siRNA (siCtrl; n=4) or siEGFR (n=11). Bar graph, Intravascular tumor cells were quantified as a percentage of total tumor cells. ***, P<0.001. Inset, Expression of EGFR protein (~180 kDa) was analyzed by western blotting 5 days after siRNA cell transfections. Below, α-tubulin (~50 kDa) is shown as protein-loading control. Image on the left depicts a siEGFR-HEp3 tumor against LCA-highlighted CAM vasculature (merged signals). The middle image depicts segregated tumor cells localized within the tumor vasculature. Bars, 100 µm. Images on the right depict intratumoral blood vessels in translucent or opaque modes. Bar, 25 µm. (C) Volumes of intratumoral vasculature within siCtrl and siEGFR HEp3 tumors were quantified after solidifying 3D-IMARIS reconstructions. (D and E) Primary tumors were initiated in ovo from the GFP-tagged HEp3 cells treated with either of 2 different control siRNA constructs, siGFP (n=9) or siCtrl (n=8), or siEGFR (n=10). Embryos were analyzed by human Alu-qPCR for the number of intravasated tumor cells localized in the CAM vasculature (D) and tumor growth (E) *, P<0.05; **, P<0.01. (F) Intramesodermal primary tumors, initiated from GFP-labeled HEp3 tumor cells, were stained on day 7 for phospho EGFR (pEGFR) and total EGFR. Signals for green (GFP), red (pEGFR) and far red (total EGFR, depicted here in blue) fluorescence were acquired monochromatically and then “colored” and merged using Adobe Photoshop software. Bars, 200 µm.

Similar articles

Cited by

References

    1. Arteaga CL, Engelman JA. ERBB receptors: from oncogene discovery to basic science to mechanism-based cancer therapeutics. Cancer Cell. 2014;25:282–303. - PMC - PubMed
    1. Blouw B, Patel M, Iizuka S, Abdullah C, You WK, Huang X, Li JL, Diaz B, Stallcup WB, Courtneidge SA. The invadopodia scaffold protein Tks5 is required for the growth of human breast cancer cells in vitro and in vivo. PLoS One. 2015;10:e0121003. - PMC - PubMed
    1. Bobek V, Kolostova K, Pinterova D, Kacprzak G, Adamiak J, Kolodziej J, Boubelik M, Kubecova M, Hoffman RM. A clinically relevant, syngeneic model of spontaneous, highly metastatic B16 mouse melanoma. Anticancer Res. 2010;30:4799–4803. - PubMed
    1. Chiang SP, Cabrera RM, Segall JE. Tumor cell intravasation. Am J Physiol Cell Physiol. 2016;311:C1–C14. - PMC - PubMed
    1. Cochet A, Dygai-Cochet I, Riedinger JM, Humbert O, Berriolo-Riedinger A, Toubeau M, Guiu S, Coutant C, Coudert B, Fumoleau P, et al. (1)(8)F-FDG PET/CT provides powerful prognostic stratification in the primary staging of large breast cancer when compared with conventional explorations. Eur J Nucl Med Mol Imaging. 2014;41:428–437. - PubMed