. 2017 Apr 18;19(3):617-629.
doi: 10.1016/j.celrep.2017.03.070.

Liberated PKA Catalytic Subunits Associate with the Membrane via Myristoylation to Preferentially Phosphorylate Membrane Substrates

Affiliations

Liberated PKA Catalytic Subunits Associate with the Membrane via Myristoylation to Preferentially Phosphorylate Membrane Substrates

Shane E Tillo et al. Cell Rep. .

Abstract

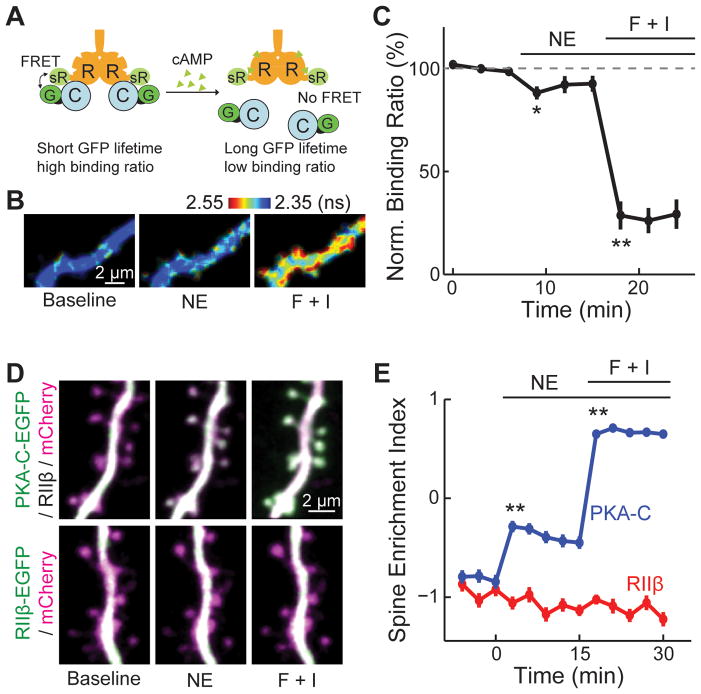
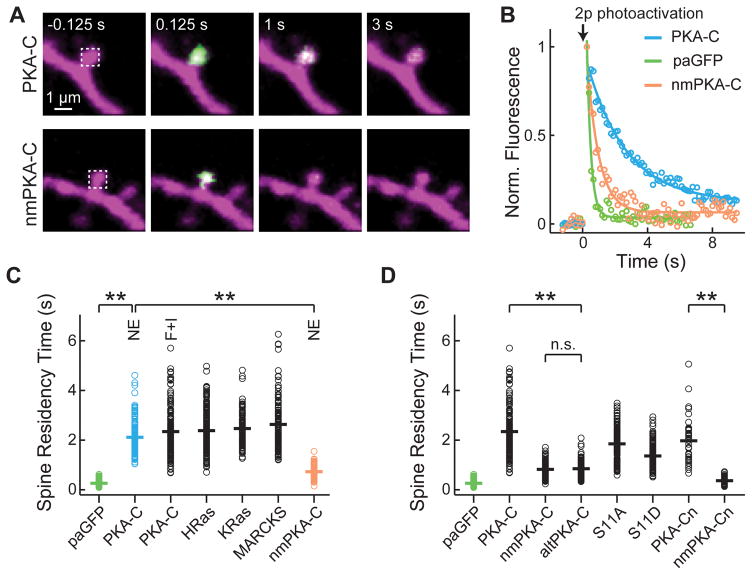
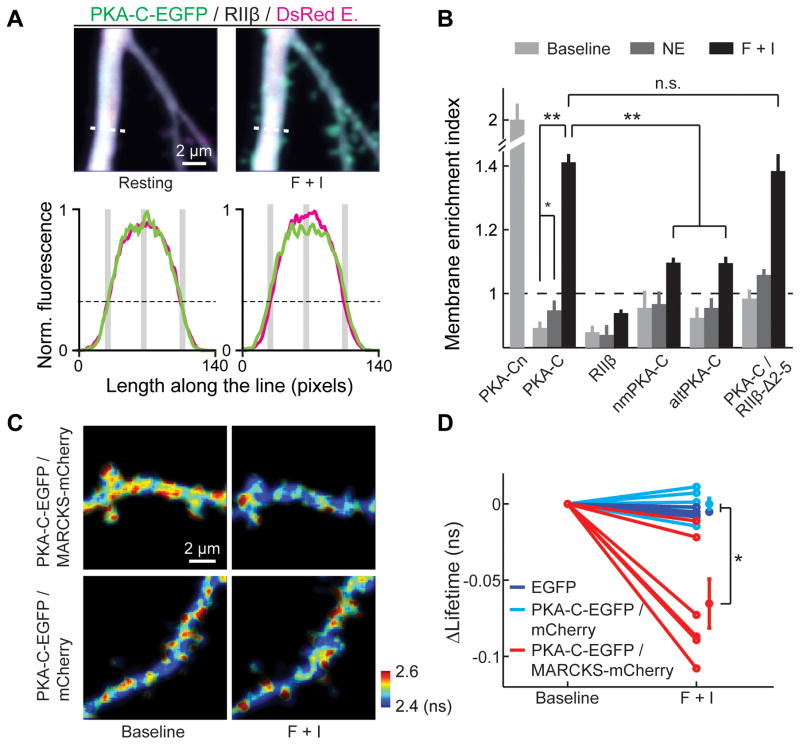
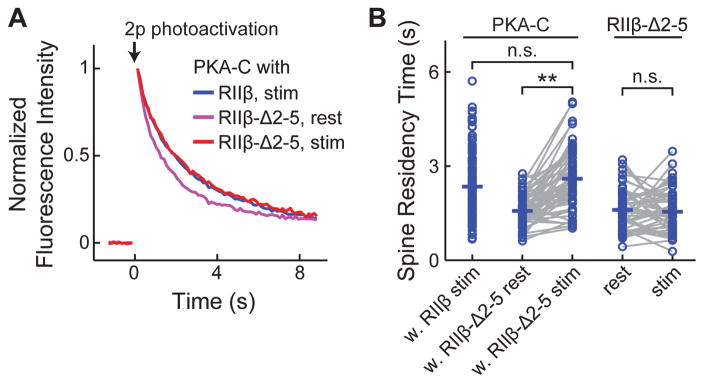
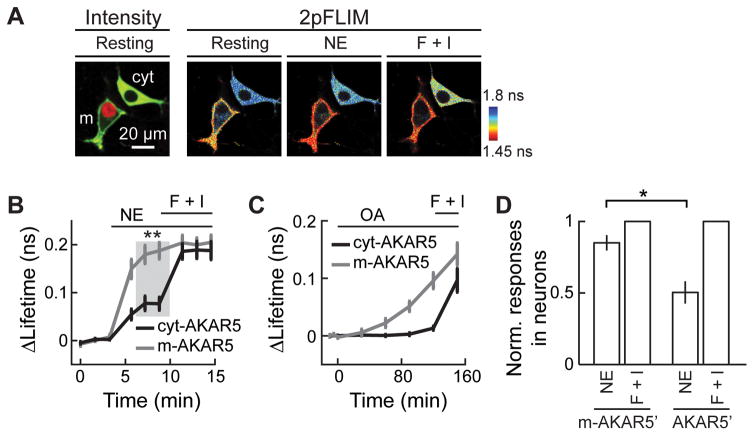
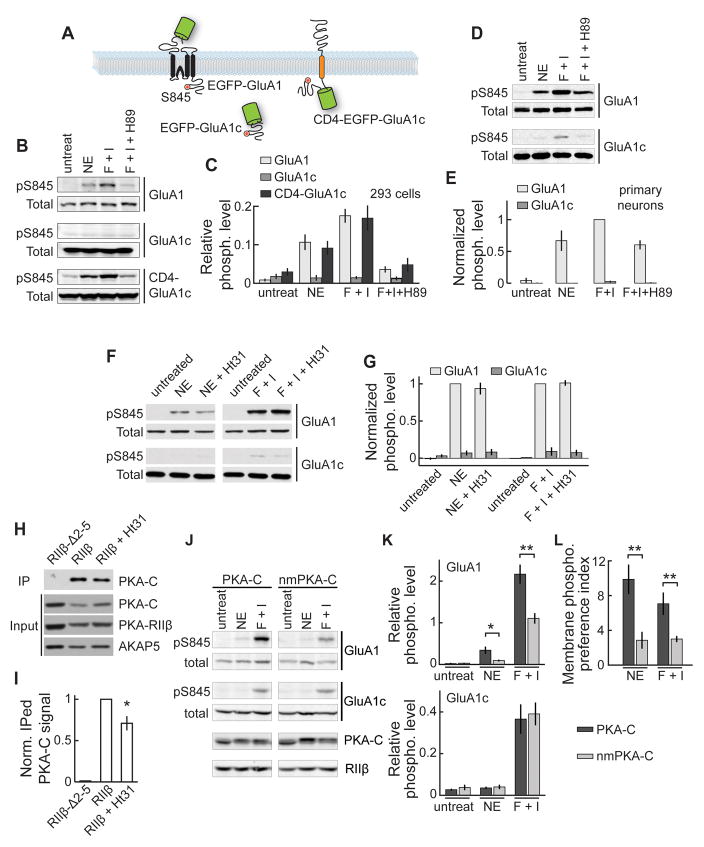
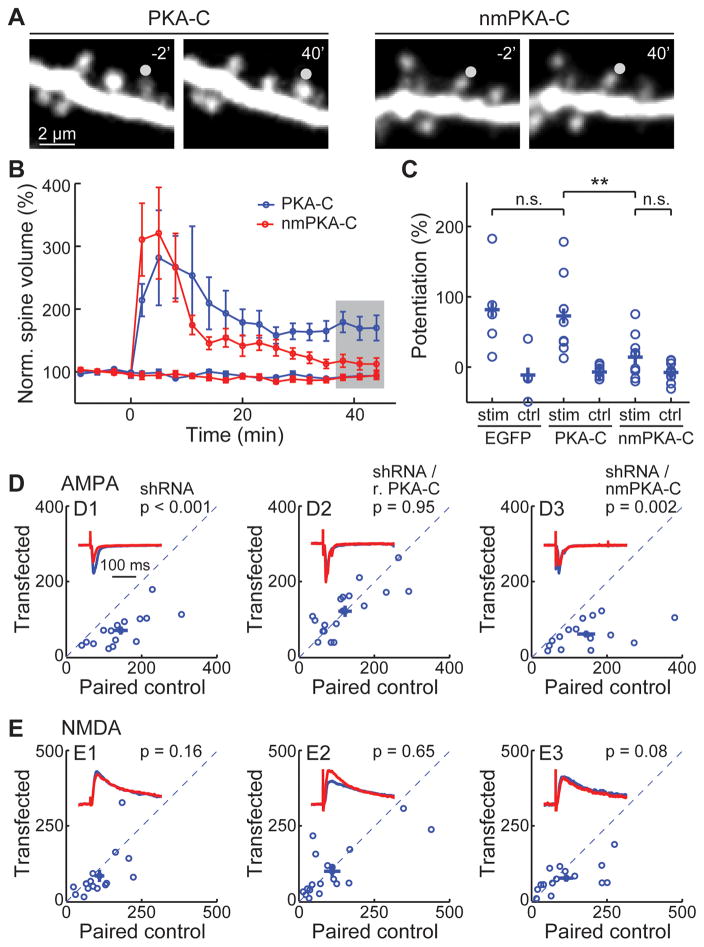
Protein kinase A (PKA) has diverse functions in neurons. At rest, the subcellular localization of PKA is controlled by A-kinase anchoring proteins (AKAPs). However, the dynamics of PKA upon activation remain poorly understood. Here, we report that elevation of cyclic AMP (cAMP) in neuronal dendrites causes a significant percentage of the PKA catalytic subunit (PKA-C) molecules to be released from the regulatory subunit (PKA-R). Liberated PKA-C becomes associated with the membrane via N-terminal myristoylation. This membrane association does not require the interaction between PKA-R and AKAPs. It slows the mobility of PKA-C and enriches kinase activity on the membrane. Membrane-residing PKA substrates are preferentially phosphorylated compared to cytosolic substrates. Finally, the myristoylation of PKA-C is critical for normal synaptic function and plasticity. We propose that activation-dependent association of PKA-C renders the membrane a unique PKA-signaling compartment. Constrained mobility of PKA-C may synergize with AKAP anchoring to determine specific PKA function in neurons.

Keywords: AMPA/NMDA current radio; PKA; activation-dependent membrane association; cAMP-dependent kinase; diffusion; mEPSC; mobility; myristoylation; synaptic plasticity.


Conflict of interest statement

The authors declare that there is no conflict of interest.

Figures

Figure 1
Figure 1. A fraction of PKA-C dissociated from PKA-R upon activation
(A) Schematic of the FRET/FLIM based measurement of PKA dissociation. R: PKA-RIIβ, C: PKA-C, G: GFP and sR: sREACh. (B, C) Representative 2pFLIM images and quantification of PKA dissociation in the presence of norepinephrine (NE) or forskolin and IBMX (F + I). n = 8 cells. (D, E) Representative images and quantifications of PKA-C-EGFP and PKA-RIIβ-EGFP localizations in the dendrites of CA1 neurons in cultured hippocampal slices. The red cytosolic marker mCherry was co-expressed to reveal the neuronal morphology. n = 69/11 (spines/cells) for PKA-C, and 25/6 for PKA-RIIβ. See also Figure S1 and S2.
Figure 2
Figure 2. Activated PKA-C moved more slowly than a cytosolic protein via its N-terminal myristoylation
(A) Representative image series of two-photon mediated photoactivation experiments of wildtype and non-myristoylated (nm) PKA-C fused to paGFP, as shown in green, in dendritic spines of CA1 neurons. Untagged PKA-RIIβ and mCherry were co-expressed. 20 μM norepinephrine was bath applied to activate PKA. paGFP was photoactivated at time zero nearly instantaneously at the spine head (white dash box). (B) Representative fluorescence decay curves for spines expressing the indicated constructs in the presence of norepinephrine. (C) Collective data of the spine residence times for the indicated constructs. Where indicated, norepinephrine or forskolin and IBMX was added. The colors correspond to those in panel B. n = 193/10 (spines/cells) for paGFP; 148/9 for PKA-C with norepinephrine; 157/8 for PKA-C with forskolin and IBMX; 208/11 for HRas; 99/5 for KRas; 126/7 for MARCKS; 96/11 for nmPKA-C with norepinephrine. (D) Analysis of determinants of PKA-C diffusion. Forskolin and IBMX were added where stimulation of PKA is needed. n = 111/5 (spines/cells) for nmPKA-C; 100/7 for altPKA-C; 161/8 for PKA-C-S11A (S11A); 136/7 for PKA-C-S11D (S11D); 40/4 for PKA-Cn; and 50/5 for nmPKA-Cn. See also Figure S3.
Figure 3
Figure 3. N-terminal myristoylation targeted PKA-C to the plasma membrane in neurons
(A) Top, representative single z-plane images of wildtype PKA-C distributions at rest and after stimulation by forskolin and IBMX in the primary apical dendrite of a CA1 neuron. Bottom, fluorescence line profiles along the white dashed lines in the top images for PKA-C (green) and the cytosol marker (red). The black dashed lines mark 30% of the maximum red fluorescence. The gray bars indicate the positions of measurements. (B) Averaged MEIs for the indicated constructs before and after stimulation. n = 8 cells for PKA-Cn, 11 for PKA-C, 6 for PKA-RIIβ, 6 for nmPKA-C, 6 for altPKA-C, 5 for PKA-C co-expressed with PKA-RIIβ-Δ2–5. Statistical significance was tested using the Wilcoxon signed rank test as the data were linked within each group. (C, D) Representative 2pFLIM images (C) and baseline-subtracted EGFP lifetimes (D) of hippocampal pyramidal neurons expressing the indicated FRET donor-acceptor combination at the baseline and stimulated conditions. See also Figure S4, S5 and S6.
Figure 4
Figure 4. The low mobility of PKA-C did not require AKAP binding
(A, B) Averaged fluorescence decay curves (A) and spine-residence times (B) for the indicated construct combinations before and after forskolin/IBMX stimulation. The data for PKA-C-paGFP/RIIβ after stimulation is same as that in Figure 1. n = (spines/cells) 57/8 for PKA-C-paGFP/RIIβ-Δ2–5; and 51/9 for RIIβ-Δ2–5-paGFP.
Figure 5
Figure 5. Membrane associated AKAR5 exhibited higher sensitivity than cytosol AKAR5 to stimulations of endogenous PKA activity
(A) Representative two-photon fluorescence intensity image (left) and 2pFLIM image series (right) of HEK 293 cells expressing either cyt-AKAR5 alone or co-expressing mAKAR5 with mCherry-histone2b. (B) Collective lifetime changes of m-AKAR5 and cyt-AKAR5 in response to 0.1 μM norepinephrine followed by forskolin and IBMX. n = 13 for m-AKAR5 and 9 for cyt-AKAR5. (C) Lifetime responses of cyt-AKAR5 and m-AKAR5 to treatment with 100 nM okadaic acid (OA) followed by forskolin and IBMX. n = 20 each. (D) Lifetime changes of AKAR5′ and m-AKAR5′ in neurons in response to 0.3 μM norepinephrine normalized to maximal responses induced by forskolin and IBMX. n = 5 for both constructs.
Figure 6
Figure 6. PKA preferentially phosphorylated a membrane bound substrate in an AKAP-independent and myristoylation-dependent manner
(A) Schematic illustrations of the substrate constructs. (B, C) Representative western blots (B) and quantifications (C) of S845 phosphorylation of the indicated constructs in HEK cells, which underwent the indicated stimulations. n = 5 independent experiments for EGFP-GluA1, 4 for EGFP-GluA1c, and 5 for CD4-EGFP-GluA1c. (D, E) Representative western blots and collective results for S845 phosphorylation of GluA1 and GluA1c carried out in primary rat cortical neuronal cultures. (F, G) Representative western blots and collective results of S845 phosphorylation of the indicated constructs in HEK cells, which underwent the indicated stimulations, with or without pre-incubation with St-Ht31. n = 5 for norepinephrine, and 4 for F + I. (H, I) Representative western blots and collective results of co-IP experiments with or without St-Ht31 treatment. PKA-C and AKAP5 were co-expressed with wildtype or mutant PKA-RIIβ as indicated. n = 4. (J) Representative western blots from HEK293 cells expressing PKA-RIIβ, EGFP-GluA1 and EGFP-GluA1c together with wildtype PKA-C or nmPKA-C treated with 1 μM NE or forskolin/IBMX as indicated. (K) Collective results of the relative phosphorylation levels for GluA1 (top) and GluA1c (bottom). n = 6. (L) MPPIs for wildtype PKA-C and nmPKA-C across different treatment conditions.
Figure 7
Figure 7. The N-terminal myristoylation of PKA-C is required for supporting normal synaptic plasticity
(A) Representative images, (B) collective time courses, and (C) the degree of lasting potentiation, as measured at the shaded time points in panel B. The gray circles in panel A indicates the uncaging position. Neurons were transfected with EGFP, PKA-C-EGFP/RIIβ/mCherry or nmPKA-C-EGFP/RIIβ/mCherry as indicated. (D, E) Representative traces (red) normalized to the control (blue) and scatter plots of paired AMPA (D) and NMDA (E) currents from neighboring untransfected CA1 neurons paired with those transfected with sh-PKA-C (labeled as shRNA) and the indicated shRNA-resistant rescuing constructs. Statistical significance was tested using a paired t-test. See also Figure S7.

Similar articles

Cited by

References

    1. Bastidas AC, Pierce LC, Walker RC, Johnson DA, Taylor SS. Influence of N-myristylation and ligand binding on the flexibility of the catalytic subunit of protein kinase A. Biochemistry. 2013;52:6368–6379. - PMC - PubMed
    1. Beavo JA, Bechtel PJ, Krebs EG. Activation of protein kinase by physiological concentrations of cyclic AMP. Proc Natl Acad Sci U S A. 1974a;71:3580–3583. - PMC - PubMed
    1. Beavo JA, Bechtel PJ, Krebs EG. Preparation of homogeneous cyclic AMP-dependent protein kinase(s) and its subunits from rabbit skeletal muscle. Methods Enzymol. 1974b;38:299–308. - PubMed
    1. Bialojan C, Takai A. Inhibitory effect of a marine-sponge toxin, okadaic acid, on protein phosphatases. Specificity and kinetics. Biochem J. 1988;256:283–290. - PMC - PubMed
    1. Bloodgood BL, Sabatini BL. Neuronal activity regulates diffusion across the neck of dendritic spines. Science. 2005;310:866–869. - PubMed

Publication types

Substances

LinkOut - more resources