. 2017 Mar 28;8(13):20988-21000.
doi: 10.18632/oncotarget.15470.

Drp1-dependent mitophagy protects against cisplatin-induced apoptosis of renal tubular epithelial cells by improving mitochondrial function

Affiliations

Drp1-dependent mitophagy protects against cisplatin-induced apoptosis of renal tubular epithelial cells by improving mitochondrial function

Chuanyan Zhao et al. Oncotarget. .

Abstract

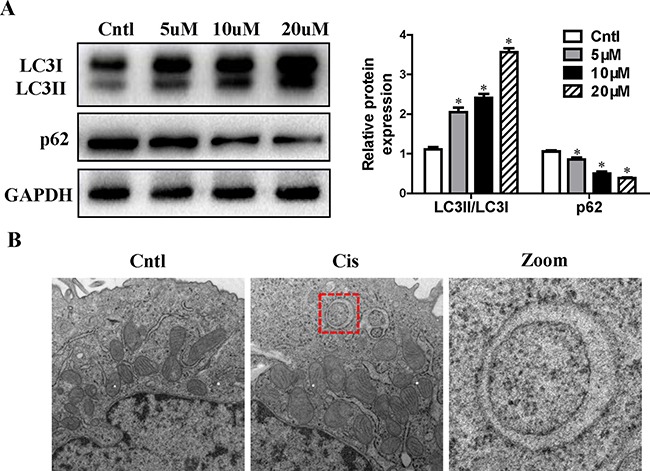
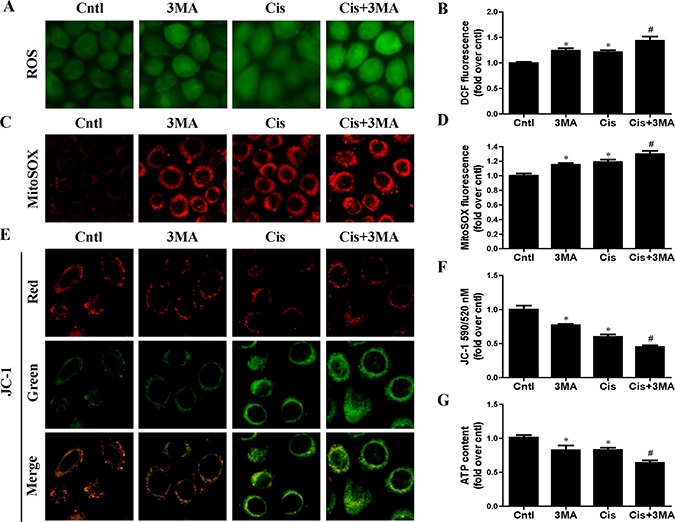
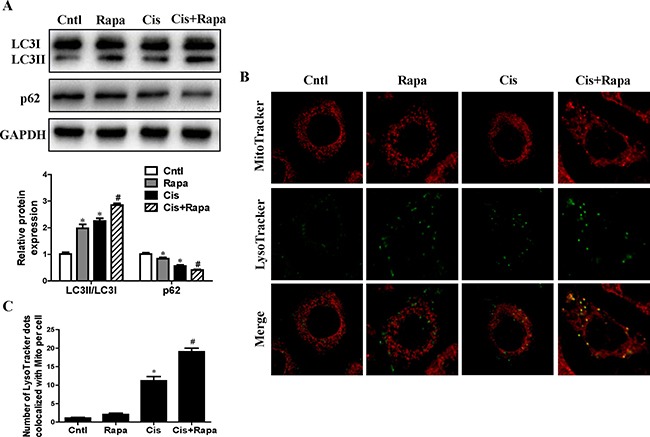
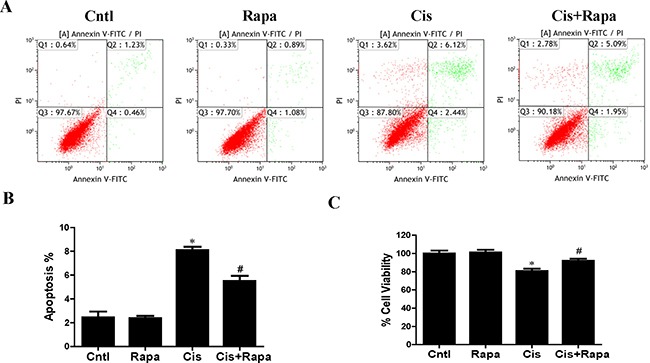
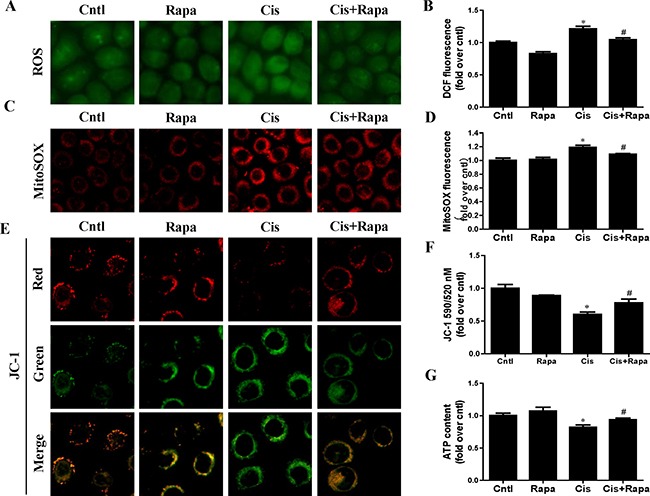
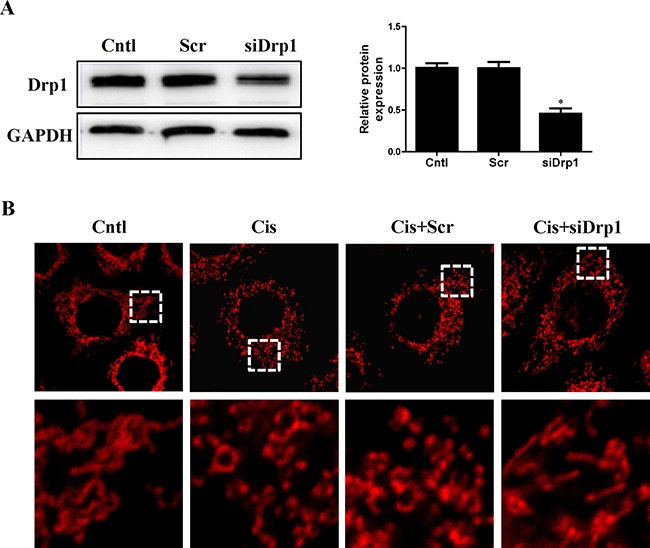
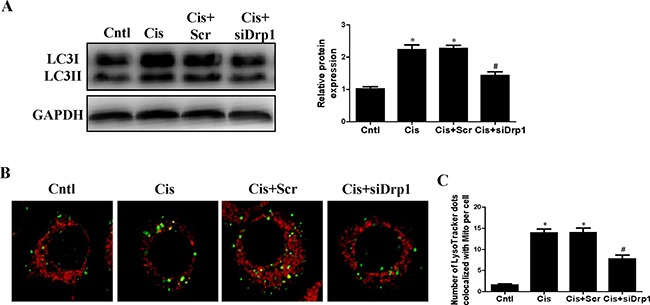
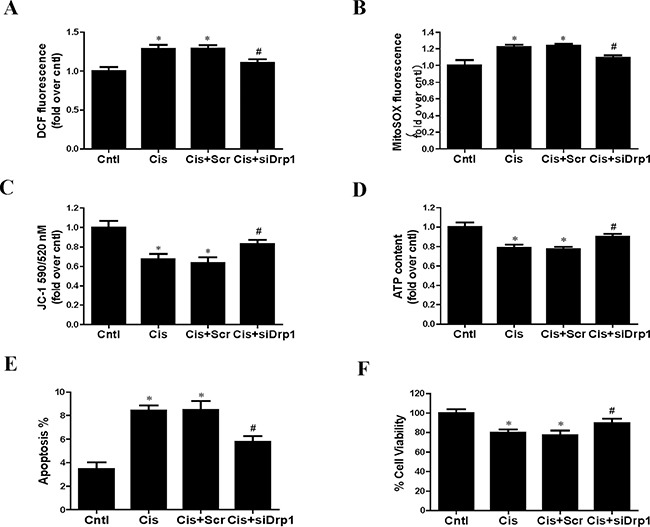
Cisplatin chemotherapy often causes acute kidney injury (AKI) in cancer patients. There is increasing evidence that mitochondrial dysfunction plays an important role in cisplatin-induced nephrotoxicity. Degradation of damaged mitochondria is carried out by mitophagy. Although mitophagy is considered of particular importance in protecting against AKI, little is known of the precise role of mitophagy and its molecular mechanisms during cisplatin-induced nephrotoxicity. Also, evidence that activation of mitophagy improved mitochondrial function is lacking. Furthermore, several evidences have shown that mitochondrial fission coordinates with mitophagy. The aim of this study was to investigate whether activation of mitophagy protects against mitochondrial dysfunction and renal proximal tubular cells injury during cisplatin treatment. The effect of mitochondrial fission on mitophagy was also investigated. In cultured human renal proximal tubular cells, we observed that 3-methyladenine, a pharmacological inhibitor of autophagy, blocked mitophagy and exacerbated cisplatin-induced mitochondrial dysfunction and cells injury. In contrast, autophagy activator rapamycin enhanced mitophagy and protected against the harmful effects of cisplatin on mitochondrial function and cells viability. Suppression of mitochondrial fission by knockdown of its main regulator dynamin-related protein-1 (Drp1) decreased cisplatin-induced mitophagy. Meanwhile, Drp1 suppression protected against cisplatin-induced cells injury by inhibiting mitochondrial dysfunction. Our results provide evidence that Drp1-depedent mitophagy has potential as renoprotective targets for the treatment of cisplatin-induced AKI.

Keywords: AKI; Drp1; cisplatin; mitochondrial dysfunction; mitochondrial fission; mitophagy.


Conflict of interest statement

CONFLICTS OF INTEREST

None.

Figures

Figure 1
Figure 1. Effect of cisplatin on autophagy in HK2 cells
(A) HK2 cells were treated with cisplatin at indicated doses for 12 h. LC3 conversion and p62 were detected by immunoblotting. Left: representative immunoblots. Right: densitometric analysis. (B) Confluent HK2 cells were incubated with 10 uM cisplatin for 12 h. Representative electron micrographs of autophagosomes engulfing mitochondria in HK2 cells were shown (×20,000). Images at higher magnification are shown in the right panels. Values are means ± SEM from three independent experiments. *P < 0.01 versus control group. Cntl, control group; Cis, cisplatin group.
Figure 2
Figure 2. Effect of autophagy inhibitor on cisplatin-induced mitophagy
HK2 cells were pre-treated with 3MA (5 mM) for 1 h, then incubated with cisplatin (10 uM) for further 12 h. (A) Western blotting analysis for LC3 conversion and p62. Upper: representative immunoblots. Lower: densitometric analysis. (B) Representative images of colocalization of lysosomes and mitochondria in HK2 cells. Mitophagy were detected by using MitoTracker Red and LysoTracker green staining. (C) Quantification of the number of LysoTracker-positive dots colocalized with MitoTracker in cells. More than 60 cells were counted for each group (n = 3). Data are expressed as the means ± SEM (n = 6). *P < 0.01 versus control. #P < 0.01 versus cisplatin treatment group. Cntl, control group, Cis, cisplatin group, Cis+3MA, cisplatin+3MA group.
Figure 3
Figure 3. Effect of autophagy inhibitor on cisplatin-induced HK2 cells injury
HK2 cells were pre-treated with 3MA (5 mM) for 1 h, then incubated with cisplatin (10 uM) for further 12 h. (A) The effects of 3MA on cisplatin-induced apoptosis were determined by flow cytometry. (B) Quantitation analysis of Annexin V+PI- and Annexin V+PI+ HK2 cells by flow cytometry. (C) Cell viability was determined by CCK-8 assay. Cell viability was expressed as percentage of controls. Data are expressed as the means ± SEM (n = 6). *P < 0.01 versus control. #P < 0.01 versus cisplatin treatment group. Cntl, control group, Cis, cisplatin group, Cis+3MA, cisplatin+3MA group.
Figure 4
Figure 4. Effect of autophagy inhibitor on cisplatin-induced mitochondrial dysfunction
HK2 cells were pre-treated with 3MA (5 mM) for 1 h, then incubated with cisplatin (10 uM) for further 12 h. (A) Representative images of HK2 cells stained with DCFDA (×200). (B) The DCF fluorescence intensities were analyzed by fluorescence microplate reader. (C) Representative images of HK2 cells stained with MitoSOX (×200). (D) Quantitation of MitoSOX by flow cytometry. (E) Representative images of HK2 cells stained with JC-1 (×200). (F) Mitochondrial membrane potential was detected by fluorescence microplate reader. (G) ATP contents were detected as described in Materials and Methods. Data are expressed as the means ± SEM (n = 6). *P < 0.01 versus control. #P < 0.01 versus cisplatin treatment group. Cntl, control group, Cis, cisplatin group, Cis+3MA, cisplatin+3MA group.
Figure 5
Figure 5. Effect of autophagy inducer on cisplatin-induced mitophagy
HK2 cells were pre-treated with rapamycin (100 nM) for 1 h, and then incubated with cisplatin (10 uM) for further 12 h. (A) Western blotting analysis for LC3 conversion and p62. Upper: representative immunoblots. Lower: densitometric analysis. (B) Representative images of mitophagy detected by using MitoTracker Red and LysoTracker green staining. (C) Quantification of the number of LysoTracker-positive dots colocalized with MitoTracker in cells. More than 60 cells were counted for each group (n = 3). Data are expressed as the means ± SEM (n = 6). *P < 0.01 versus control. #P < 0.01 versus cisplatin treatment group. Cntl, control group, Rapa, rapamycin group. Cis, cisplatin group, Cis+ Rapa, cisplatin+rapamycin group.
Figure 6
Figure 6. Effect of autophagy inducer on cisplatin-induced HK2 cells injury
HK2 cells were pre-treated with rapamycin (100 nM) for 1 h, and then incubated with cisplatin (10 uM) for further 12 h. (A) The effects of rapamycin on cisplatin-induced apoptosis were determined by flow cytometry. (B) Quantitation analysis of apoptosis. (C) Cell viability was determined by CCK-8 assay. Data are expressed as the means ± SEM (n = 6). *P < 0.01 versus control. #P < 0.01 versus cisplatin treatment group. Cntl, control group, Rapa, rapamycin group. Cis, cisplatin group, Cis+ Rapa, cisplatin+rapamycin group.
Figure 7
Figure 7. Effect of autophagy inducer on cisplatin-induced mitochondrial dysfunction
HK2 cells were pre-treated with rapamycin (100 nM) for 1 h, and then incubated with cisplatin (10 uM) for further 12 h. (A) Representative images of HK2 cells stained with DCFDA (×200). (B) The DCF fluorescence intensities were analyzed by fluorescence microplate reader. (C) Representative images of HK2 cells stained with MitoSOX (×200). (D) Quantitation of MitoSOX by flow cytometry. (E) Representative images of HK2 cells stained with JC-1 (×200). (F) Mitochondrial membrane potential was detected by fluorescence microplate reader. (G) ATP contents. Data are expressed as the means ± SEM (n = 6). *P < 0.01 versus control. #P < 0.01 versus cisplatin treatment group, Cntl, control group, Rapa, rapamycin group, Cis, cisplatin group, Cis+ Rapa, cisplatin+rapamycin group.
Figure 8
Figure 8. Effect of Drp1 silencing on cisplatin-induced mitochondrial fission
HK2 cells were transfected with Drp1 siRNA or scrambled siRNA, with untreated cells used as the control (Cntl). (A) Drp1 protein expression was analyzed by western blotting. Right: representative immunoblots. Left: densitometric analysis. (B) Representative confocal images of mitochondrial morphologies in HK2 cells. HK2 cells were transfected with Drp1 siRNA or scrambled siRNA siRNA, then treated with cisplatin for 12 h. Mitochondria was stained by MitoTracker Red. Images in the box at higher magnification are shown in the below panels. Data are expressed as the means ± SEM (n = 6). *P < 0.01 versus control or scrambled siRNA group, Cntl, control group, Scr, scrambled siRNA group, siDrp1, Drp1 siRNA group, Cis, cisplatin group.
Figure 9
Figure 9. Effect of Drp1 siRNA on cisplatin-induced mitophagy
HK2 cells were transfected with Drp1 siRNA for 24 h, then incubated with cisplatin (10 uM) for further 12 h. (A) Western blotting analysis for LC3 conversion. Right: representative immunoblots. Left: densitometric analysis. (B) Mitophagy were detected by using MitoTracker Red and LysoTracker green staining. (C) Quantification of the number of mitophagy. Data are expressed as the means ± SEM. *P < 0.01 versus control. #P < 0.01 versus cisplatin treatment group, Cntl, control group, Cis, cisplatin group, Scr, scrambled siRNA group, siDrp1, Drp1 siRNA group.
Figure 10
Figure 10. Effect of Drp1 siRNA on cisplatin-induced mitochondrial dysfunction and cell injury
HK2 cells were transfected with Drp1 siRNA for 24 h, then incubated with cisplatin (10 uM) for further 12 h. (A) The DCF fluorescence intensities were analyzed by fluorescence microplate reader. (B) Quantitation of MitoSOX by flow cytometry. (C) Mitochondrial membrane potential was detected by fluorescence microplate reader. (D) ATP contents. (E) Quantitation analysis of apoptosis by flow cytometry. (F) Cell viability was determined by CCK-8 assay. Data are expressed as the means ± SEM (n = 6). *P < 0.01 versus control. #P < 0.01 versus cisplatin treatment group. Cntl, control group, Cis, cisplatin group, Scr, scrambled siRNA group, siDrp1, Drp1 siRNA group.

Similar articles

Cited by

References

    1. Morigi M, Perico L, Rota C, Longaretti L, Conti S, Rottoli D, Novelli R, Remuzzi G, Benigni A. Sirtuin 3-dependent mitochondrial dynamic improvements protect against acute kidney injury. J Clin Invest. 2015;125:715–726. - PMC - PubMed
    1. Marullo R, Werner E, Degtyareva N, Moore B, Altavilla G, Ramalingam SS, Doetsch PW. Cisplatin induces a mitochondrial-ROS response that contributes to cytotoxicity depending on mitochondrial redox status and bioenergetic functions. PloS one. 2013;8:e81162. - PMC - PubMed
    1. Choi YM, Kim HK, Shim W, Anwar MA, Kwon JW, Kwon HK, Kim HJ, Jeong H, Kim HM, Hwang D, Kim HS, Choi S. Mechanism of Cisplatin-Induced Cytotoxicity Is Correlated to Impaired Metabolism Due to Mitochondrial ROS Generation. PloS one. 2015;10:e0135083. - PMC - PubMed
    1. He C, Klionsky DJ. Regulation mechanisms and signaling pathways of autophagy. Annu Rev Genet. 2009;43:67–93. - PMC - PubMed
    1. Mizushima N, Yamamoto A, Matsui M, Yoshimori T, In Ohsumi Y. vivo analysis of autophagy in response to nutrient starvation using transgenic mice expressing a fluorescent autophagosome marker. Mol Biol Cell. 2004;15:1101–1111. - PMC - PubMed

MeSH terms