TGF-β-independent CTGF induction regulates cell adhesion mediated drug resistance by increasing collagen I in HCC
- PMID: 28423507
- PMCID: PMC5400613
- DOI: 10.18632/oncotarget.15521
TGF-β-independent CTGF induction regulates cell adhesion mediated drug resistance by increasing collagen I in HCC
Abstract
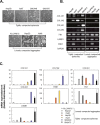
Hepatocellular carcinoma (HCC) is resistant to conventional chemotherapeutic agents and remains an unmet medical need. Here, we demonstrate a mechanism of cell adhesion-mediated drug resistance using a variety of HCC spheroid models to overcome environment-mediated drug resistance in HCC. We classified spheroids into two groups, tightly compacted and loosely compacted aggregates, based on investigation of dynamics of spheroid formation. Our results show that compactness of HCC spheroids correlated with fibroblast-like characteristics, collagen 1A1 (COL1A1) content, and capacity for chemoresistance. We also showed that ablation of COL1A1 attenuated not only the capacity for compact-spheroid formation, but also chemoresistance. Generally, connective tissue growth factor (CTGF) acts downstream of transforming growth factor (TGF)-β and promotes collagen I fiber deposition in the tumor microenvironment. Importantly, we found that TGF-β-independent CTGF is upregulated and regulates cell adhesion-mediated drug resistance by inducing COL1A1 in tightly compacted HCC spheroids. Furthermore, losartan, which inhibits collagen I synthesis, impaired the compactness of spheroids via disruption of cell-cell contacts and increased the efficacy of anticancer therapeutics in HCC cell line- and HCC patient-derived tumor spheroids. These results strongly suggest functional roles for CTGF-induced collagen I expression in formation of compact spheroids and in evading anticancer therapies in HCC, and suggest that losartan, administered in combination with conventional chemotherapy, might be an effective treatment for liver cancer.
Keywords: cell adhesion-mediated drug resistance (CAM-DR); collagen 1A1; connective tissue growth factor (CTGF); hepatocellular carcinoma; tumor spheroids.
Conflict of interest statement
These authors declare no conflicts of interests.
Figures


Similar articles
-
Three Dimensional Mixed-Cell Spheroids Mimic Stroma-Mediated Chemoresistance and Invasive Migration in hepatocellular carcinoma.Neoplasia. 2018 Aug;20(8):800-812. doi: 10.1016/j.neo.2018.05.008. Epub 2018 Jul 4. Neoplasia. 2018. PMID: 29981501 Free PMC article.
-
Activated hepatic stellate cells play pivotal roles in hepatocellular carcinoma cell chemoresistance and migration in multicellular tumor spheroids.Sci Rep. 2016 Nov 17;6:36750. doi: 10.1038/srep36750. Sci Rep. 2016. PMID: 27853186 Free PMC article.
-
Transforming Growth Factor β1 Promotes Migration and Invasion of Human Hepatocellular Carcinoma Cells Via Up-Regulation of Connective Tissue Growth Factor.Cell Biochem Biophys. 2015 Dec;73(3):775-81. doi: 10.1007/s12013-015-0693-6. Cell Biochem Biophys. 2015. PMID: 27259324
-
The role of extracellular vesicles in mediating progression, metastasis and potential treatment of hepatocellular carcinoma.Oncotarget. 2017 Jan 10;8(2):3683-3695. doi: 10.18632/oncotarget.12465. Oncotarget. 2017. PMID: 27713136 Free PMC article. Review.
-
Three-Dimensional Cell Culture Models of Hepatocellular Carcinoma - a Review.J Gastrointest Cancer. 2021 Dec;52(4):1294-1308. doi: 10.1007/s12029-021-00772-1. Epub 2021 Dec 20. J Gastrointest Cancer. 2021. PMID: 34927218 Review.
Cited by
-
Extracellular matrix collagen I promotes the tumor progression of residual hepatocellular carcinoma after heat treatment.BMC Cancer. 2018 Sep 18;18(1):901. doi: 10.1186/s12885-018-4820-9. BMC Cancer. 2018. PMID: 30227844 Free PMC article.
-
Inhibitors of Na+/K+ ATPase exhibit antitumor effects on multicellular tumor spheroids of hepatocellular carcinoma.Sci Rep. 2020 Mar 24;10(1):5318. doi: 10.1038/s41598-020-62134-4. Sci Rep. 2020. PMID: 32210281 Free PMC article.
-
Hyaluronidase: structure, mechanism of action, diseases and therapeutic targets.Mol Biomed. 2025 Jul 12;6(1):50. doi: 10.1186/s43556-025-00299-y. Mol Biomed. 2025. PMID: 40646377 Free PMC article. Review.
-
The Spatial Extracellular Proteomic Tumor Microenvironment Distinguishes Molecular Subtypes of Hepatocellular Carcinoma.J Proteome Res. 2024 Sep 6;23(9):3791-3805. doi: 10.1021/acs.jproteome.4c00099. Epub 2024 Jul 9. J Proteome Res. 2024. PMID: 38980715 Free PMC article.
-
Identification of hepatic fibrosis inhibitors through morphometry analysis of a hepatic multicellular spheroids model.Sci Rep. 2021 May 25;11(1):10931. doi: 10.1038/s41598-021-90263-x. Sci Rep. 2021. PMID: 34035369 Free PMC article.
References
-
- Ferlay J, Soerjomataram I, Dikshit R, Eser S, Mathers C, Rebelo M, Parkin DM, Forman D, Bray F. Cancer incidence and mortality worldwide: sources, methods and major patterns in GLOBOCAN 2012. International journal of cancer. 2015;136:E359–386. - PubMed
-
- Chiaramonte M, Stroffolini T, Vian A, Stazi MA, Floreani A, Lorenzoni U, Lobello S, Farinati F, Naccarato R. Rate of incidence of hepatocellular carcinoma in patients with compensated viral cirrhosis. Cancer. 1999;85:2132–2137. - PubMed
-
- Junttila MR, de Sauvage FJ. Influence of tumour micro-environment heterogeneity on therapeutic response. Nature. 2013;501:346–354. - PubMed
-
- Wu SD, Ma YS, Fang Y, Liu LL, Fu D, Shen XZ. Role of the microenvironment in hepatocellular carcinoma development and progression. Cancer treatment reviews. 2012;38:218–225. - PubMed
MeSH terms
Substances
LinkOut - more resources
Full Text Sources
Other Literature Sources
Medical
Miscellaneous

