Genistein inhibits the growth and regulates the migration and invasion abilities of melanoma cells via the FAK/paxillin and MAPK pathways
- PMID: 28423510
- PMCID: PMC5400615
- DOI: 10.18632/oncotarget.15535
Genistein inhibits the growth and regulates the migration and invasion abilities of melanoma cells via the FAK/paxillin and MAPK pathways
Abstract
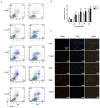
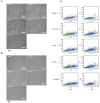
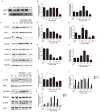
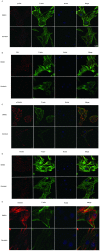
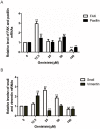
Genistein is one of the main components of soy-based foods, which are widely known for their many benefits, including anti-cancer, anti-inflammatory, and antioxidant effects. In this study, we investigated the anti-metastasis effects of genistein on B16F10 melanoma cells. Our results showed that genistein strongly inhibited B16F10 cell proliferation and induced apoptosis in time- and concentration-dependent manners. Genistein altered the morphology of B16F10 cells to an elongated shape with slim pseudopodia-like protrusions. Moreover, genistein inhibited the invasion and migration abilities of B16F10 cells in a dose-dependent manner. On one hand, a high concentration of genistein (100 μM) significantly inhibited cell adhesion and migration, as shown by wound healing assays and transwell-migration and invasion assays. Furthermore, the expression levels of p-FAK, p-paxillin, tensin-2, vinculin, and α-actinin were decreased by genistein. As a result, genistein is believed to strongly downregulate the migration and invasion abilities of B16F10 cells via the FAK/paxillin pathway. Moreover, p-p38, p-ERK, and p-JNK levels were also dramatically decreased by treatment with genistein. Finally, genistein significantly decreased the gene expression of FAK, paxillin, vimentin, and epithelial-to-mesenchymal transition-related transcription factor Snail, as shown by real-time PCR (qPCR) analysis. On the other hand, a lower concentration of genistein (12.5 μM) significantly promoted both invasion and migration by activating the FAK/paxillin and MAPK signaling cascades. Taken together, this study showed for the first time that genistein exerts dual functional effects on melanoma cells. Our findings suggest that genistein regulates the FAK/paxillin and MAPK signaling pathways in a highly concentration-dependent manner. Patients with melanoma should therefore be cautious of consuming soy-based foods in their diets.
Keywords: FAK/paxillin pathway; MAPK pathway; genistein; invasion and migration; melanoma cells.
Conflict of interest statement
All authors of this paper declare no conflicts of interest.
Figures




Similar articles
-
Genistein inhibits migration and invasion of cervical cancer HeLa cells by regulating FAK-paxillin and MAPK signaling pathways.Taiwan J Obstet Gynecol. 2020 May;59(3):403-408. doi: 10.1016/j.tjog.2020.03.012. Taiwan J Obstet Gynecol. 2020. PMID: 32416888
-
FAK regulates E-cadherin expression via p-SrcY416/p-ERK1/2/p-Stat3Y705 and PPARγ/miR-125b/Stat3 signaling pathway in B16F10 melanoma cells.Oncotarget. 2017 Feb 21;8(8):13898-13908. doi: 10.18632/oncotarget.14687. Oncotarget. 2017. PMID: 28108732 Free PMC article.
-
ADT-OH inhibits malignant melanoma metastasis in mice via suppressing CSE/CBS and FAK/Paxillin signaling pathway.Acta Pharmacol Sin. 2022 Jul;43(7):1829-1842. doi: 10.1038/s41401-021-00799-x. Epub 2021 Nov 18. Acta Pharmacol Sin. 2022. PMID: 34795411 Free PMC article.
-
Effects of the natural isoflavonoid genistein on growth, signaling pathways and gene expression of matrix macromolecules by breast cancer cells.Mini Rev Med Chem. 2006 Mar;6(3):331-7. doi: 10.2174/138955706776073420. Mini Rev Med Chem. 2006. PMID: 16515472 Review.
-
Cellular and Molecular Mechanisms Modulated by Genistein in Cancer.Int J Mol Sci. 2025 Jan 27;26(3):1114. doi: 10.3390/ijms26031114. Int J Mol Sci. 2025. PMID: 39940882 Free PMC article. Review.
Cited by
-
Phytochemical Constituents and Derivatives of Cannabis sativa; Bridging the Gap in Melanoma Treatment.Int J Mol Sci. 2023 Jan 3;24(1):859. doi: 10.3390/ijms24010859. Int J Mol Sci. 2023. PMID: 36614303 Free PMC article. Review.
-
Natural Products for Cancer Therapy: A Review of Their Mechanism of Actions and Toxicity in the Past Decade.J Trop Med. 2022 Mar 11;2022:5794350. doi: 10.1155/2022/5794350. eCollection 2022. J Trop Med. 2022. PMID: 35309872 Free PMC article. Review.
-
Quercetin inhibits LPS-induced macrophage migration by suppressing the iNOS/FAK/paxillin pathway and modulating the cytoskeleton.Cell Adh Migr. 2019 Dec;13(1):1-12. doi: 10.1080/19336918.2018.1486142. Epub 2018 Aug 1. Cell Adh Migr. 2019. PMID: 29945484 Free PMC article.
-
In Vivo and Clinical Studies of Natural Products Targeting the Hallmarks of Cancer.Handb Exp Pharmacol. 2025;287:95-121. doi: 10.1007/164_2024_716. Handb Exp Pharmacol. 2025. PMID: 38797749 Review.
-
The Effects of Iridin and Irigenin on Cancer: Comparison with Well-Known Isoflavones in Breast, Prostate, and Gastric Cancers.Int J Mol Sci. 2025 Mar 7;26(6):2390. doi: 10.3390/ijms26062390. Int J Mol Sci. 2025. PMID: 40141034 Free PMC article. Review.
References
-
- Ascierto PA, Bastholt L, Hersey P, Cinat G, Eggermont AM, Hauschild A, Espinosa E, Robert C. Side effects and toxicities of targeted therapies in stage IV melanoma. American journal of therapeutics. 2015;22:44–53. - PubMed
-
- Chiu KY, Wu CC, Chia CH, Hsu SL, Tzeng YM. Inhibition of growth, migration and invasion of human bladder cancer cells by antrocin, a sesquiterpene lactone isolated from Antrodia cinnamomea, and its molecular mechanisms. Cancer letters. 2016;373:174–184. - PubMed
-
- Hood JD, Cheresh DA. Role of integrins in cell invasion and migration. Nature reviews Cancer. 2002;2:91–100. - PubMed
MeSH terms
Substances
LinkOut - more resources
Full Text Sources
Other Literature Sources
Research Materials
Miscellaneous

