

Procollagen-lysine 2-oxoglutarate 5-dioxygenase 2 promotes hypoxia-induced glioma migration and invasion
- PMID: 28423580
- PMCID: PMC5410313
- DOI: 10.18632/oncotarget.15581
Procollagen-lysine 2-oxoglutarate 5-dioxygenase 2 promotes hypoxia-induced glioma migration and invasion
Erratum in
-
Correction: Procollagen-lysine 2-oxoglutarate 5-dioxygenase 2 promotes hypoxia-induced glioma migration and invasion.Oncotarget. 2021 Jul 6;12(14):1442-1443. doi: 10.18632/oncotarget.28003. eCollection 2021 Jul 6. Oncotarget. 2021. PMID: 34262654 Free PMC article.
Abstract
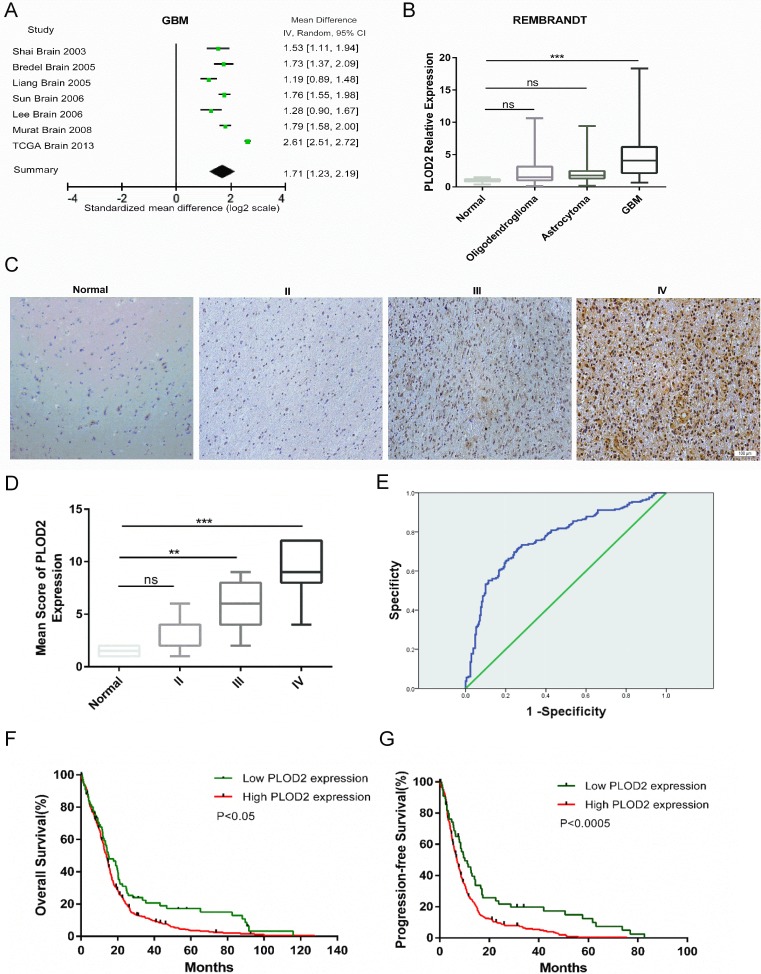
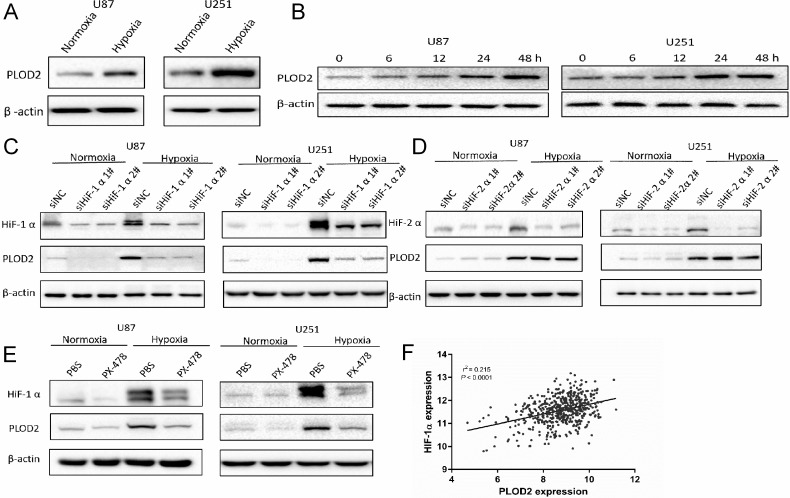
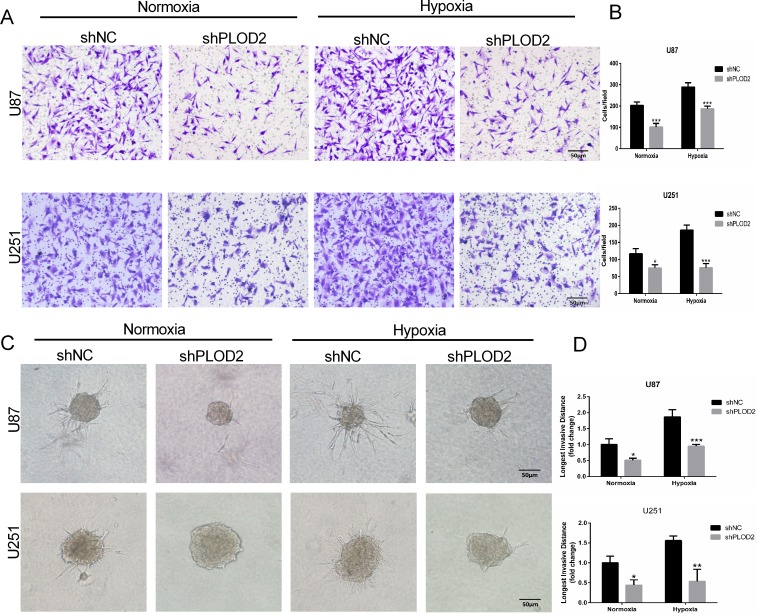
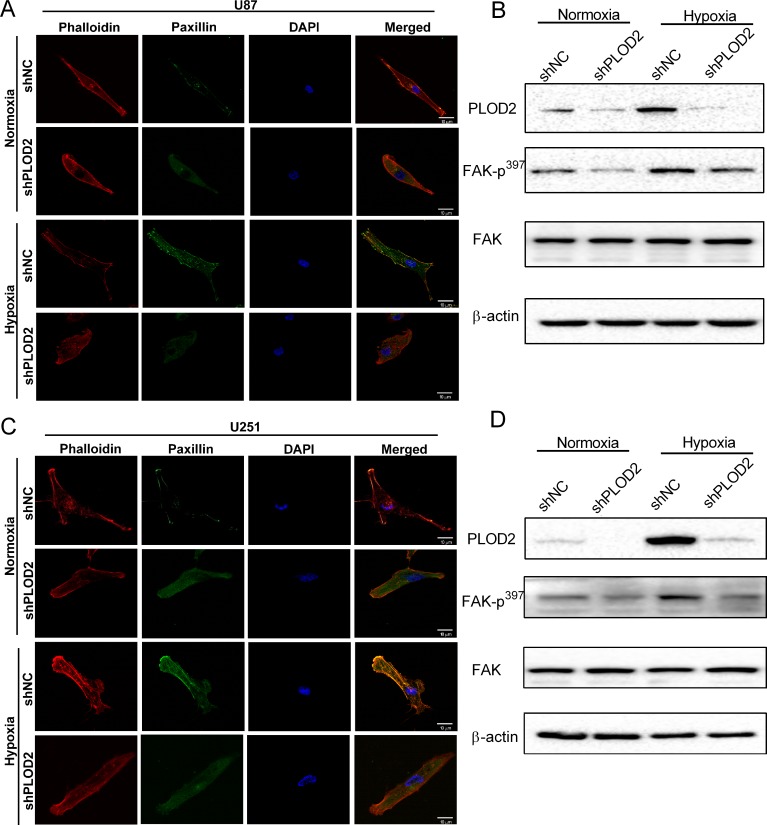
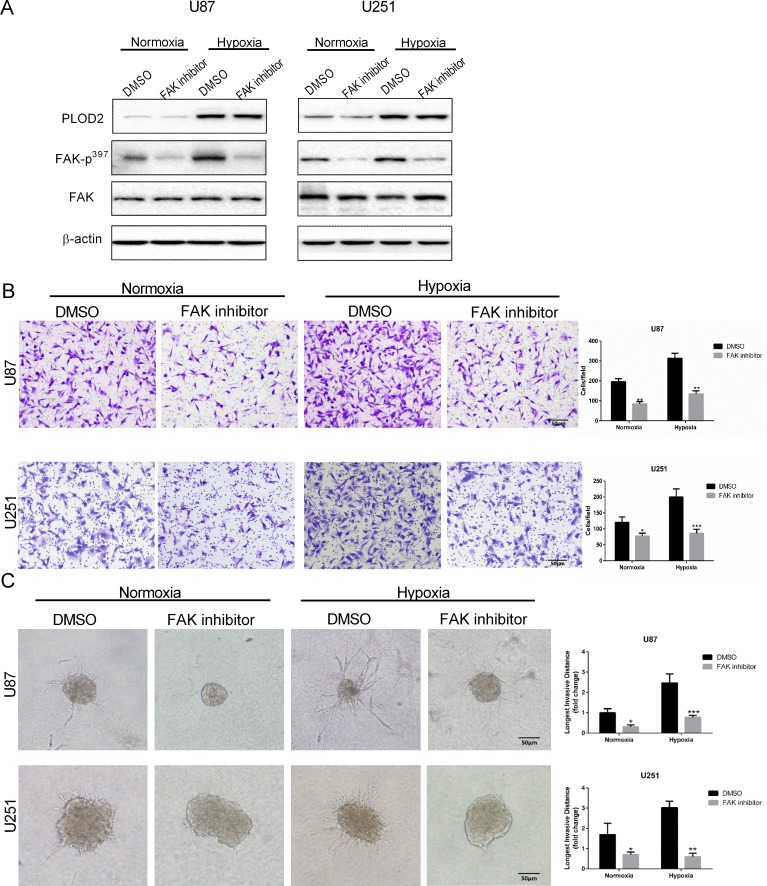
Poor prognosis of glioblastoma multiforme is strongly associated with the ability of tumor cells to invade the brain parenchyma, which is believed to be the major factor responsible for glioblastoma recurrence. Therefore, identifying the molecular mechanisms driving invasion may lead to the development of improved therapies for glioblastoma patients. Here, we investigated the role of procollagen-lysine 2-oxoglutarate 5-dioxygenase 2 (PLOD2), an enzyme catalyzing collagen cross-linking, in the biology of glioblastoma invasion. PLOD2 mRNA was significantly overexpressed in glioblastoma compared to low-grade tumors based on the Oncomine datasets and REMBRANDT database for human gliomas. Kaplan-Meier estimates based on the TCGA dataset demonstrated that high PLOD2 expression was associated with poor prognosis. In vitro, hypoxia upregulated PLOD2 protein in U87 and U251 human glioma cell lines. siRNA knockdown of endogenous HIF-1α or treatment of cells with the HIF-1α inhibitor PX-478 largely abolished the hypoxia-mediated PLOD2 upregulation. Knockdown of PLOD2 in glioma cell lines led to decreases in migration and invasion under normoxia and hypoxia. In addition, levels of phosphorylated FAK (Tyr 397), an important kinase mediating cell adhesion, were reduced in U87-shPLOD2 and U251-shPLOD2 cells, particularly under hypoxic conditions. Finally, orthotopic U251-shPLOD2 xenografts were circumscribed rather than locally invasive. In conclusion, the results indicated that PLOD2 was a gene of clinical relevance with implications in glioblastoma invasion and treatment strategies.
Keywords: FAK; glioma; hypoxia; invasion; procollagen-lysine 2-oxoglutarate 5-dioxygenase 2.
Conflict of interest statement
The authors declare no potential conflicts of interest.
Figures

Similar articles
-
Hypoxia-induced PLOD2 promotes proliferation, migration and invasion via PI3K/Akt signaling in glioma.Oncotarget. 2017 Jun 27;8(26):41947-41962. doi: 10.18632/oncotarget.16710. Oncotarget. 2017. PMID: 28410212 Free PMC article.
-
Hypoxia-induced PLOD2 regulates invasion and epithelial-mesenchymal transition in endometrial carcinoma cells.Genes Genomics. 2020 Mar;42(3):317-324. doi: 10.1007/s13258-019-00901-y. Epub 2019 Dec 23. Genes Genomics. 2020. PMID: 31872384
-
PLOD2 as a potential regulator of peritoneal dissemination in gastric cancer.Int J Cancer. 2018 Sep 1;143(5):1202-1211. doi: 10.1002/ijc.31410. Epub 2018 Apr 20. Int J Cancer. 2018. PMID: 29603227
-
PLOD2 in cancer research.Biomed Pharmacother. 2017 Jun;90:670-676. doi: 10.1016/j.biopha.2017.04.023. Epub 2017 Apr 14. Biomed Pharmacother. 2017. PMID: 28415047 Review.
-
Intrinsic and Microenvironmental Drivers of Glioblastoma Invasion.Int J Mol Sci. 2024 Feb 22;25(5):2563. doi: 10.3390/ijms25052563. Int J Mol Sci. 2024. PMID: 38473812 Free PMC article. Review.
Cited by
-
PLOD2 contributes to drug resistance in laryngeal cancer by promoting cancer stem cell-like characteristics.BMC Cancer. 2019 Aug 27;19(1):840. doi: 10.1186/s12885-019-6029-y. BMC Cancer. 2019. PMID: 31455288 Free PMC article.
-
Targeting PLOD2 suppresses invasion and metastatic potential in radiorecurrent prostate cancer.BJC Rep. 2024;2(1):60. doi: 10.1038/s44276-024-00085-3. Epub 2024 Aug 21. BJC Rep. 2024. PMID: 39184453 Free PMC article.
-
Differential response of luminal and basal breast cancer cells to acute and chronic hypoxia.Breast Cancer Res Treat. 2023 Apr;198(3):583-596. doi: 10.1007/s10549-023-06863-w. Epub 2023 Feb 24. Breast Cancer Res Treat. 2023. PMID: 36826702 Free PMC article.
-
Correlation between procollagen-lysine, 2-oxoglutarate 5-dioxygenase 2 and breast cancer.Int J Clin Exp Pathol. 2019 Mar 1;12(3):1015-1021. eCollection 2019. Int J Clin Exp Pathol. 2019. PMID: 31933913 Free PMC article.
-
PLOD2 Is Essential to Functional Activation of Integrin β1 for Invasion/Metastasis in Head and Neck Squamous Cell Carcinomas.iScience. 2020 Feb 21;23(2):100850. doi: 10.1016/j.isci.2020.100850. Epub 2020 Jan 18. iScience. 2020. PMID: 32058962 Free PMC article.
References
-
- Wen PY, Kesari S. Malignant gliomas in adults. N Engl J Med. 2008;359:492–507. - PubMed
-
- Kaelin WG, Jr, Ratcliffe PJ. Oxygen sensing by metazoans: the central role of the HIF hydroxylase pathway. Mol Cell. 2008;30:393–402. - PubMed
-
- Paulus W, Roggendorf W, Schuppan D. Immunohistochemical investigation of collagen subtypes in human glioblastomas. Virchows Arch A Pathol Anat Histopathol. 1988;413:325–332. - PubMed
MeSH terms
Substances
LinkOut - more resources
Full Text Sources
Other Literature Sources
Medical
Molecular Biology Databases
Miscellaneous
