. 2017 Apr 4;8(14):22325-22343.
doi: 10.18632/oncotarget.16479.

The stem cell/cancer stem cell marker ALDH1A3 regulates the expression of the survival factor tissue transglutaminase, in mesenchymal glioma stem cells

Affiliations

The stem cell/cancer stem cell marker ALDH1A3 regulates the expression of the survival factor tissue transglutaminase, in mesenchymal glioma stem cells

Kelly E Sullivan et al. Oncotarget. .

Abstract

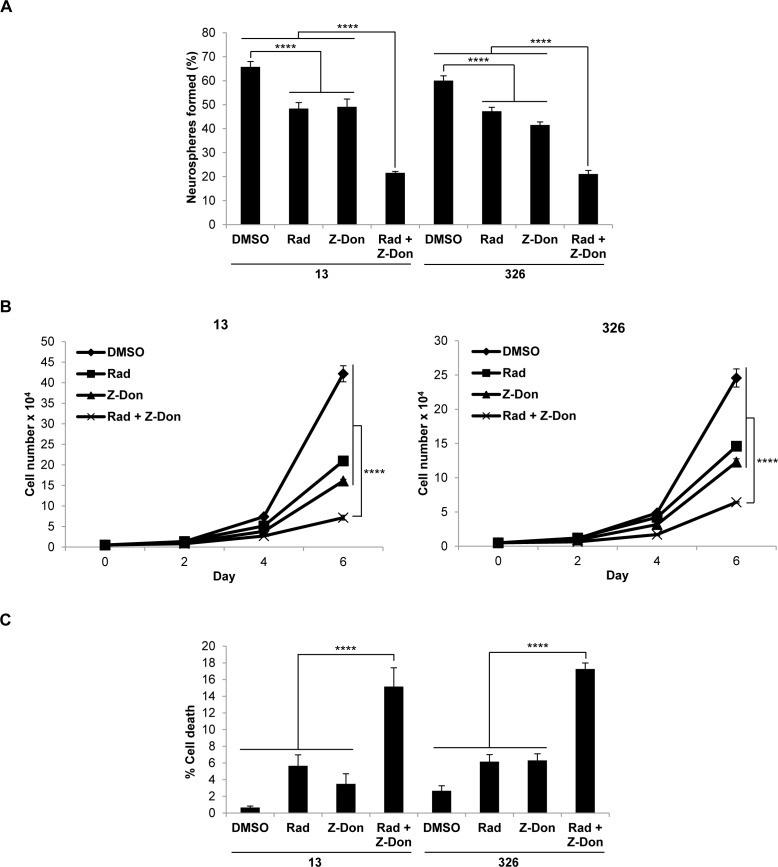
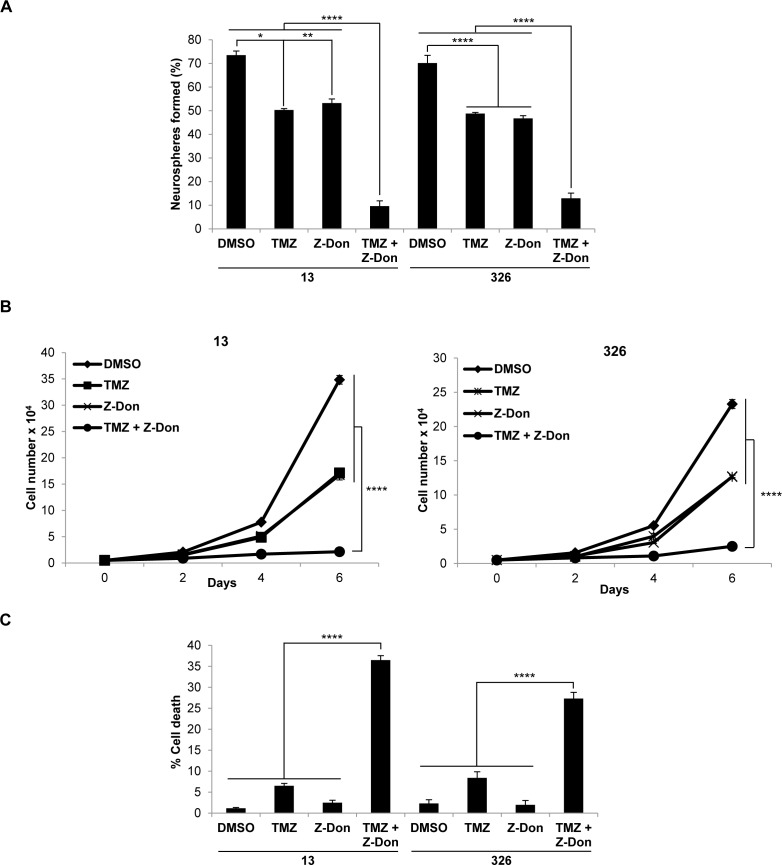
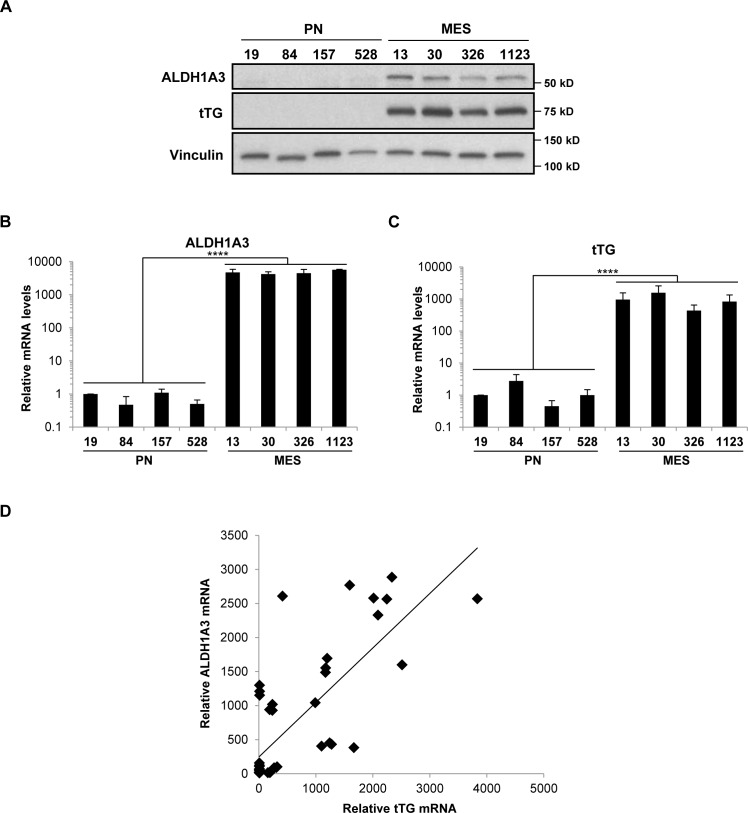
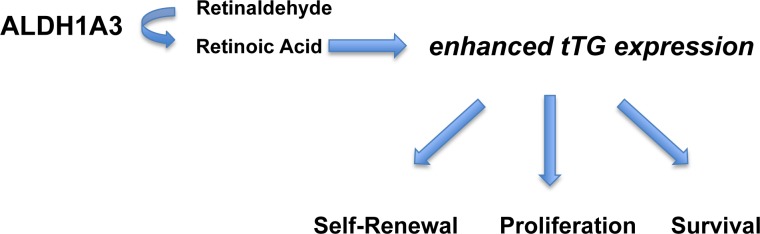
Tissue transglutaminase (tTG), a dual-function enzyme with GTP-binding and acyltransferase activities, has been implicated in the survival and chemotherapy resistance of aggressive cancer cells and cancer stem cells, including glioma stem cells (GSCs). Using a model system comprising two distinct subtypes of GSCs referred to as proneural (PN) and mesenchymal (MES), we find that the phenotypically aggressive and radiation therapy-resistant MES GSCs exclusively express tTG relative to PN GSCs. As such, the self-renewal, proliferation, and survival of these cells was sensitive to treatment with tTG inhibitors, with a benefit being observed when combined with the standard of care for high grade gliomas (i.e. radiation or temozolomide). Efforts to understand the molecular drivers of tTG expression in MES GSCs revealed an unexpected link between tTG and a common marker for stem cells and cancer stem cells, Aldehyde dehydrogenase 1A3 (ALDH1A3). ALDH1A3, as well as other members of the ALDH1 subfamily, can function in cells as a retinaldehyde dehydrogenase to generate retinoic acid (RA) from retinal. We show that the enzymatic activity of ALDH1A3 and its product, RA, are necessary for the observed expression of tTG in MES GSCs. Additionally, the ectopic expression of ALDH1A3 in PN GSCs is sufficient to induce the expression of tTG in these cells, further demonstrating a causal link between ALDH1A3 and tTG. Together, these findings ascribe a novel function for ALDH1A3 in an aggressive GSC phenotype via the up-regulation of tTG, and suggest the potential for a similar role by ALDH1 family members across cancer types.

Keywords: aldehyde dehydrogenase; cancer stem cells; glioblastoma; retinoic acid; tissue transglutaminase.


Conflict of interest statement

CONFLICTS OF INTEREST

The authors declare that they have no conflicts of interest with the contents of this article.

Figures

Figure 1
Figure 1. MES GSCs exclusively express tTG relative to PN GSCs and are sensitive to the effects of tTG inhibitors
A. Whole cell lysates from PN and MES GSCs were immunoblotted with tTG, and Vinculin antibodies. B. Whole cell lysates collected from MES GSC cell lines 13 and 326 were immunoblotted with tTG and Vinculin antibodies (left panel), or incubated with or without MDC (middle panel) and Z-Don (right panel). tTG transamidation activity was read-out by the incorporation of a biotinylated-pentylamine onto cell lysates, and detected with a Streptavidin antibody.
Figure 2
Figure 2. Pharmaceutical inhibitors of tTG impact the self-renewal, proliferation and survival of MES GSC
A., B. MES GSC cell lines 13 and 326 were dissociated into single cells and seeded at 5 × 10³ cells/well in 12-well plates. A. Neurospheres were counted after 72 hours. Each experiment was performed in triplicate, and the results were averaged and graphed. p values are represented as follows: ****, p < 0.0001. B. The cells were counted at the indicated time points to determine cell proliferation. Each experiment was performed in triplicate, and the results were averaged and graphed. p values are represented as follows: ****, p< 0.0001. C., tTG inhibitors induce cell death following nutrient deprivation. MES GSC cell lines 13 and 326 were dissociated into single cells, and seeded at 2 × 10⁴ cells/well in 12-well plates in either GSC medium or DMEM/F12 with the indicated compounds. The cells were collected after 48 hours, stained with Trypan Blue Solution, and the viable and dead cells were counted. Each experiment was performed in triplicate, and the results were averaged and graphed. p values are represented as follows: **, p < 0.01; ***, p < 0.001; ****, p < 0.0001.
Figure 3
Figure 3. Combination therapy including the tTG inhibitor Z-Don and radiation inhibits MES GSC self-renewal and proliferation, and induces cell death
A-C. MES GSC cell lines 13 and 326 were dissociated into single cells, seeded at 5 × 10³ cells/well in 12-well plates with or without Z-Don, and radiated after 2-4 hours. A. Neurosphere formation was counted after 72 hours. Each experiment was performed in triplicate, and the results were averaged and graphed. p values are represented as follows: ****, p < 0.0001. B. The cells were counted at the indicated time points to determine cell proliferation. Each experiment was performed in triplicate, and the results were averaged and graphed. p values are represented as follows: ****, p < 0.0001. C. The cells were collected after six days and stained with Trypan Blue Solution, and the viable and dead cells were counted. Each experiment was performed in triplicate, and the results were averaged and graphed. p values are represented as follows: ****, p < 0.0001.
Figure 4
Figure 4. Combination therapy including the tTG inhibitor Z-Don and temozolomide inhibits MES GSC self-renewal and proliferation, and induces cell death
A.-C. MES GSC cell lines 13 and 326 were dissociated into single cells, and seeded at 5 × 10³ cells/well in 12-well plates with or without the indicated compounds. A. Neurosphere formation was counted after 72 hours. Each experiment was performed in triplicate, and the results were averaged and graphed. p values are represented as follows: *, p < 0.05; **, p < 0.01; ****, p < 0.0001. B. The cells were counted at the indicated time points to determine cell proliferation. Each experiment was performed in triplicate, and the results were averaged and graphed. p values are represented as follows: ****, p < 0.0001. C. The cells were collected after six days and stained with Trypan Blue Solution, and the viable and dead cells were counted. Each experiment was performed in triplicate, and the results were averaged and graphed. p values are represented as follows: ****, p < 0.0001.
Figure 5
Figure 5. Determining potential upstream regulators of tTG expression in MES GSCs
A. A lower molecular weight form of EGFR is expressed exclusively in MES GSCs. Whole cell lysates from PN and MES GSCs were immunoblotted with EGFR, tTG, and Actin antibodies. B. EGFR inhibition has no effect on tTG expression. MES 13 and 326 cells were treated with 5 μM Gefitinib for either 3 or 6 days, and the effects on tTG expression were determined by Western blotting using antibodies against tTG, phospho-EGFR and actin.
Figure 6
Figure 6. ALDH1A3 and tTG are expressed exclusively in MES GSCs
A. Whole cell lysates from PN and MES GSCs were immunoblotted with ALDH1A3, tTG, and Vinculin antibodies. B., C. RNA was isolated from PN and MES GSCs, and cDNA was generated as described in “Materials and Methods.” qPCR was then performed with primer sets that amplify ALDH1A3 and tTG transcripts, and the results of three independent experiments were averaged and plotted with the PN GSC 19 cell line normalized to one. p values are represented as follows: ****, p < 0.0001. D. ALDH1A3 and tTG mRNA levels are correlated in GSC, GBM, and astrocyte cell lines.
Figure 7
Figure 7. ALDH1A3 is necessary for tTG expression in MES GSCs
A. MES GSC cell line 326 was treated with the indicated compounds for seven days, followed by RNA isolation and qRT-PCR analysis of tTG transcript levels. The results of independent experiments (n ≥ 3) were averaged and plotted. p values are represented as follows: *, p < 0.05; ***, p < 0.001. B., C. MES GSC cell lines 13 and 326 were infected with a control lentivirus or lentiviruses containing two distinct ALDH1A3 shRNAs. The cells were split after 24 hours, and treated with either DMSO or RA and selected with puromycin for six days. The cells were then collected for RNA isolation and qRT-PCR analysis of tTG (B) and ALDH1A3 (C) expression. The results of three independent experiments were averaged and plotted. p values are represented as follows: *, p < 0.05; **, p < 0.01; ***, p < 0.001. D. A population of the MES GSC 13 and 326 cells collected in B and C above were used to make whole cell lysates, which were immunoblotted with ALDH1A3 and Vinculin antibodies.
Figure 8
Figure 8. Retinoic acid and ALDH1A3 are sufficient to induce the expression of tTG in PN GSCs
A. PN GSC cell lines 19 and 84 were treated with 0.5 μM RA for 72 hours, then collected for RNA isolation and qRT-PCR analysis of tTG expression (left panel). The results of three independent experiments were averaged and plotted. p values are represented as follows: **, p < 0.01; ****, p < 0.0001. Whole cell lysates were collected in parallel, and immunoblotted with tTG and Vinculin antibodies (right panel). B. PN GSC 19 cells were treated for 3 days with 0.5 μM RA, 10 μM bexarotene, 1 μM AGN193109, 2 μM HX531, or the indicated combinations of these reagents. Whole cell lysates were collected in parallel, and immunoblotted with tTG and Vinculin antibodies. C., D. PN GSC cell lines 19 (C) and 84 (D) were infected with a control lentivirus or lentiviruses containing either a wild-type or catalytically-inactive form of ALDH1A3. The cells were split 24 hours later and selected with puromycin for six days, followed by RNA isolation and qRT-PCR analysis of ALDH1A3 and tTG expression (left and middle panels). The results of independent experiments (n ≥ 3) were averaged and graphed. p values are represented as follows: *, p < 0.05; **, p < 0.01; ***, p < 0.001, ****, p < 0.0001. Whole cell lysates were collected in parallel, and immunoblotted with V5, tTG, and Vinculin antibodies (right panels).
Figure 9
Figure 9. tTG expression is correlated with ALDH1 activity
A. 5 different cancer cell lines were collected and stained using the ALDEFLUOR kit as described in “Materials and Methods.” The untreated cells (“- DEAB”) with the top 15% and bottom 15% ALDH1 activity (shown in gray) were gated as indicated and collected. B. RNA was isolated from the cells collected in A for qRT-PCR analysis of tTG expression. The results of independent experiments (n ≥ 3) were averaged and graphed. p values are represented as follows: *, p < 0.05; **, p < 0.01; ***, p < 0.001.
Figure 10
Figure 10. ALDH1A3 promotes stem cell-like properties by enhancing the expression of tTG
ALDH1A3 converts retinaldehyde to retinoic acid, which induces the expression of tTG. tTG contributes to the aggressive phenotype of MES GSCs by promoting their self-renewal, proliferation, and survival.

Similar articles

Cited by

References

    1. Antonyak MA, Singh US, Lee DA, Boehm JE, Combs C, Zgola MM, Page RL, Cerione RA. Effects of tissue transglutaminase on retinoic acid-induced cellular differentiation and protection against ap optosis. The Journal of Biological Chemistry. 2001;276:33582–33587. - PubMed
    1. Antonyak MA, Miller AM, Jansen JM, Boehm JE, Balkman CE, Wakshlag JJ, Page RL, Cerione RA. Augmentation of tissue transglutaminase expression and activation by epidermal growth factor inhibit doxorubicin-induced apoptosis in human breast cancer cells. The Journal of Biological Chemistry. 2004;279:41461–41467. - PubMed
    1. Antonyak MA, Li B, Regan AD, Feng Q, Dusaban SS, Cerione RA. Tissue transglutaminase is an essential participant in the epidermal growth factor-stimulated signaling pathway leading to cancer cell migration and invasion. The Journal of Biological Chemistry. 2009;284:17914–17925. - PMC - PubMed
    1. Li B, Antonyak MA, Druso JE, Cheng L, Nikitin AY, Cerione RA. EGF potentiated oncogenesis requires a tissue transglutaminase-dependent signaling pathway leading to src activation. Proceedings of the National Academy of Sciences of the United States of America. 2010;107:1408–1413. - PMC - PubMed
    1. Boroughs LK, Antonyak MA, Johnson JL, Cerione RA. A unique role for heat shock protein 70 and its binding partner tissue transglutaminase in cancer cell migration. The Journal of Biological Chemistry. 2011;286:37094–37107. - PMC - PubMed

MeSH terms