

CDCA2 promotes lung adenocarcinoma cell proliferation and predicts poor survival in lung adenocarcinoma patients
- PMID: 28423619
- PMCID: PMC5386720
- DOI: 10.18632/oncotarget.15519
CDCA2 promotes lung adenocarcinoma cell proliferation and predicts poor survival in lung adenocarcinoma patients
Abstract
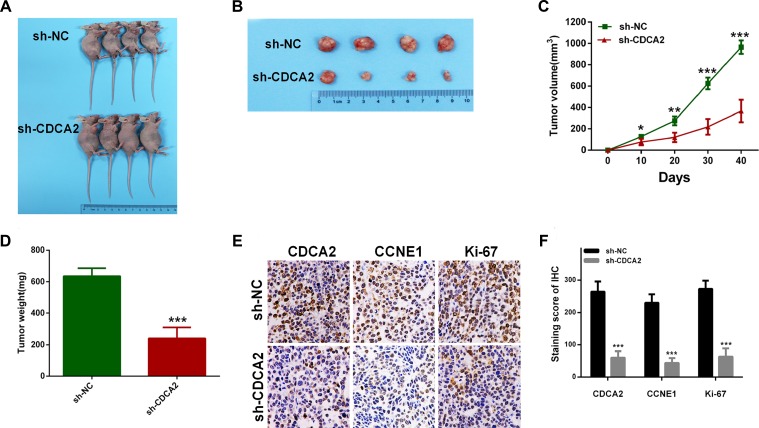
Cell division cycle associated 2(CDCA2) is overexpressed in neuroblastoma and oral squamous cell carcinoma, and its overexpression positively correlates to tumor progression. However, the biological and clinical significance of CDCA2 in lung adenocarcinoma(LAC) has never been investigated. We determined the expression profile and clinical significance of CDCA2 using The Cancer Genome Atlas(TCGA) and tissue microarray(TMA). Furthermore, we explored the biological function of CDCA2 both in vitro and in vivo. A great upregulation of CDCA2 was observed in LAC tissues compared with adjacent normal tissues. Importantly, Cox regression analysis indicated that high level of CDCA2 was an independent risk factor for overall survival(OS) in LAC patients (TCGA: HR = 1.720, p = 0.004; TMA: HR = 1.971, p = 0.023). Inhibition of CDCA2 suppressed the proliferation of LAC cells via G1 phase arrest by downregulating cyclin E1(CCNE1), while overexpression of CDCA2 promoted LAC cells proliferation by upregulating CCNE1. Moreover, the oncogenic activity of CDCA2 was also confirmed in vivo. In conclusion, CDCA2 promotes proliferation of LAC cells and predicts poor prognosis in LAC patients. CDCA2 might play a significant role in LAC progression.
Keywords: CDCA2; TCGA; lung adenocarcinoma; prognosis; proliferation.
Conflict of interest statement
All authors declare that they have no competing interests.
Figures


Similar articles
-
Upregulation of CDCA5 promotes gastric cancer malignant progression via influencing cyclin E1.Biochem Biophys Res Commun. 2018 Feb 5;496(2):482-489. doi: 10.1016/j.bbrc.2018.01.046. Epub 2018 Jan 8. Biochem Biophys Res Commun. 2018. PMID: 29326043
-
ZYG11A serves as an oncogene in non-small cell lung cancer and influences CCNE1 expression.Oncotarget. 2016 Feb 16;7(7):8029-42. doi: 10.18632/oncotarget.6904. Oncotarget. 2016. PMID: 26771237 Free PMC article.
-
Overexpression of CDCA2 in human squamous cell carcinoma: correlation with prevention of G1 phase arrest and apoptosis.PLoS One. 2013;8(2):e56381. doi: 10.1371/journal.pone.0056381. Epub 2013 Feb 13. PLoS One. 2013. PMID: 23418564 Free PMC article.
-
The Role of CDCA2 in tumor genesis, prognosis and future treatments.Eur J Cancer. 2024 Nov;211:114308. doi: 10.1016/j.ejca.2024.114308. Epub 2024 Sep 6. Eur J Cancer. 2024. PMID: 39288736 Review.
-
[Omics technologies in diagnostics of lung adenocarcinoma].Biomed Khim. 2017 May;63(3):181-210. doi: 10.18097/PBMC20176303181. Biomed Khim. 2017. PMID: 28781253 Review. Russian.
Cited by
-
Integrated analysis reveals key genes with prognostic value in lung adenocarcinoma.Cancer Manag Res. 2018 Nov 21;10:6097-6108. doi: 10.2147/CMAR.S168636. eCollection 2018. Cancer Manag Res. 2018. PMID: 30538558 Free PMC article.
-
The roles of the cell division cycle-associated gene family in hepatocellular carcinoma.J Gastrointest Oncol. 2021 Apr;12(2):781-794. doi: 10.21037/jgo-21-110. J Gastrointest Oncol. 2021. PMID: 34012666 Free PMC article.
-
Identification of a 5-Nutrient Stress-Sensitive Gene Signature to Predict Survival for Colorectal Cancer.Biomed Res Int. 2022 Apr 18;2022:2587120. doi: 10.1155/2022/2587120. eCollection 2022. Biomed Res Int. 2022. Retraction in: Biomed Res Int. 2024 Mar 20;2024:9823079. doi: 10.1155/2024/9823079. PMID: 35496037 Free PMC article. Retracted.
-
A Nuclear Stress Pathway that Parallels Cytoplasmic Stress Granule Formation.iScience. 2020 Oct 13;23(11):101664. doi: 10.1016/j.isci.2020.101664. eCollection 2020 Nov 20. iScience. 2020. PMID: 33134894 Free PMC article.
-
Construction and Analysis of Survival-Associated Competing Endogenous RNA Network in Lung Adenocarcinoma.Biomed Res Int. 2021 Feb 11;2021:4093426. doi: 10.1155/2021/4093426. eCollection 2021. Biomed Res Int. 2021. PMID: 33628780 Free PMC article.
References
-
- Chen W, Zheng R, Baade PD, Zhang S, Zeng H, Bray F, Jemal A, Yu XQ, He J. Cancer statistics in China, 2015. CA Cancer J Clin. 2016;66:115–132. - PubMed
-
- Kamangar F, Dores GM, Anderson WF. Patterns of cancer incidence, mortality, and prevalence across five continents: defining priorities to reduce cancer disparities in different geographic regions of the world. J Clin Oncol. 2006;24:2137–2150. - PubMed
-
- Youlden DR, Cramb SM, Baade PD. The International Epidemiology of Lung Cancer: geographical distribution and secular trends. J Thorac Oncol. 2008;3:819–831. - PubMed
-
- Vagnarelli P. Repo-man at the intersection of chromatin remodelling, DNA repair, nuclear envelope organization, and cancer progression. Adv Exp Med Biol. 2014;773:401–414. - PubMed
MeSH terms
Substances
LinkOut - more resources
Full Text Sources
Other Literature Sources
Medical
