. 2017 Mar 21;8(12):19902-19913.
doi: 10.18632/oncotarget.15720.

Early assessment of tumor response to photodynamic therapy using combined diffuse optical and diffuse correlation spectroscopy to predict treatment outcome

Affiliations

Early assessment of tumor response to photodynamic therapy using combined diffuse optical and diffuse correlation spectroscopy to predict treatment outcome

Patricia S P Thong et al. Oncotarget. .

Erratum in

Abstract

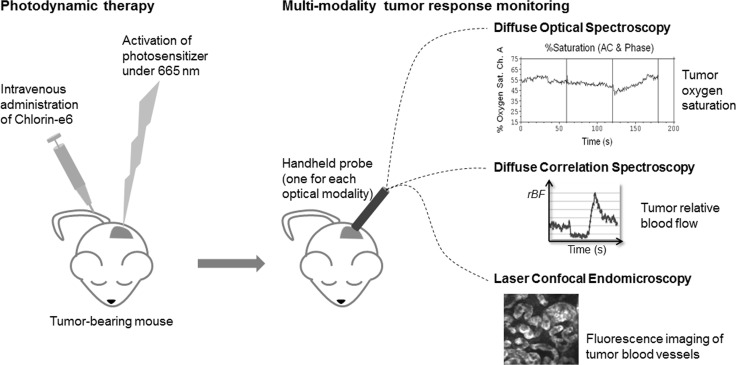
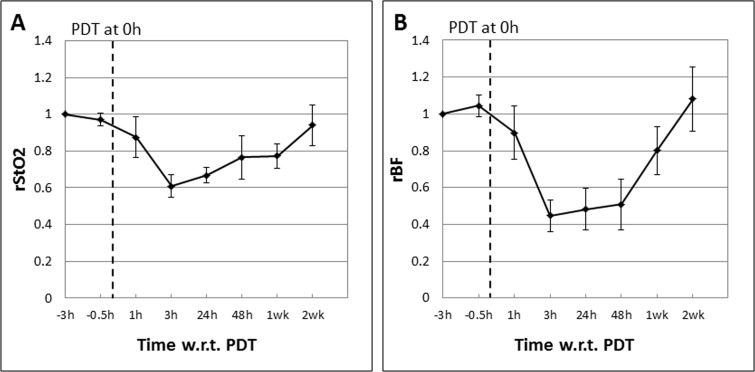
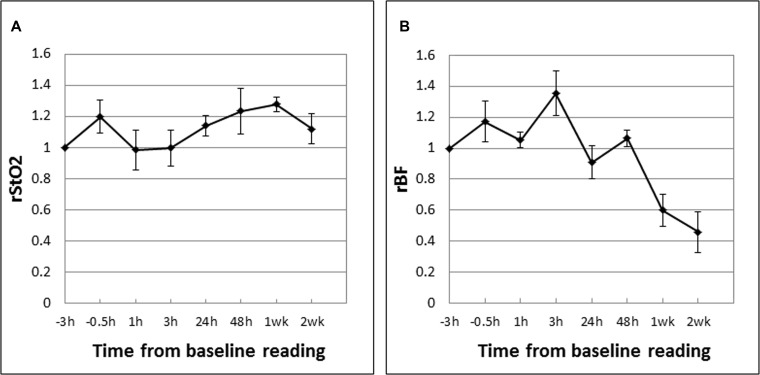
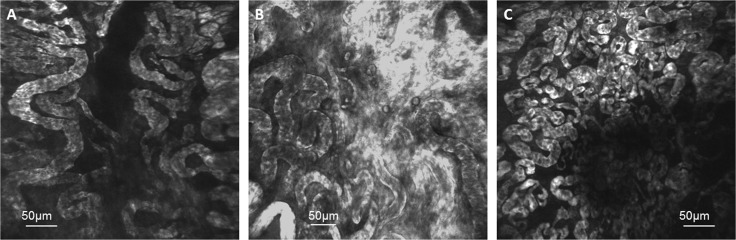
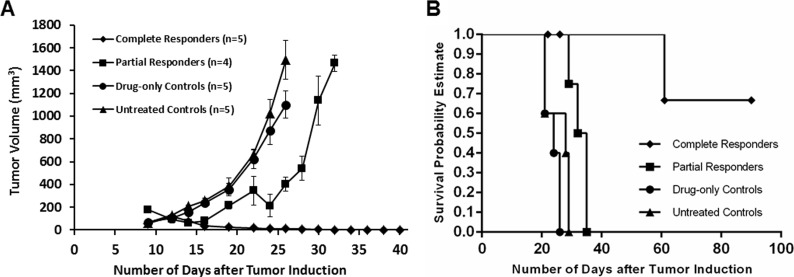
Photodynamic therapy (PDT) of cancer involves the use of a photosensitizer that can be light-activated to eradicate tumors via direct cytotoxicity, damage to tumor vasculature and stimulating the body's immune system. Treatment outcome may vary between individuals even under the same regime; therefore a non-invasive tumor response monitoring system will be useful for personalization of the treatment protocol. We present the combined use of diffuse optical spectroscopy (DOS) and diffuse correlation spectroscopy (DCS) to provide early assessment of tumor response. The relative tissue oxygen saturation (rStO2) and relative blood flow (rBF) in tumors were measured using DOS and DCS respectively before and after PDT with reference to baseline values in a mouse model. In complete responders, PDT-induced decreases in both rStO2 and rBF levels were observed at 3 h post-PDT and the rBF remained low until 48 h post-PDT. Recovery of these parameters to baseline values was observed around 2 weeks after PDT. In partial responders, the rStO2 and rBF levels also decreased at 3 h post PDT, however the rBF values returned toward baseline values earlier at 24 h post-PDT. In contrast, the rStO2 and rBF readings in control tumors showed fluctuations above the baseline values within the first 48 h. Therefore tumor response can be predicted at 3 to 48 h post-PDT. Recovery or sustained decreases in the rBF at 48 h post-PDT corresponded to long-term tumor control. Diffuse optical measurements can thus facilitate early assessment of tumor response. This approach can enable physicians to personalize PDT treatment regimens for best outcomes.

Keywords: optical spectroscopy; photodynamic therapy; relative blood flow; tissue oxygenation; treatment response monitoring.


Conflict of interest statement

CONFLICTS OF INTEREST

The authors have no conflicts of interest to declare in relation to this article.

Figures

Figure 1
Figure 1. Schematic summary of the multi-modality approach used to monitor tumor response following Ce6-mediated PDT
Figure 2
Figure 2
Mean tumor rStO2 (A) and rBF (B) values in complete responders (CRs; n = 5) expressed as ratios of the baseline readings measured before Ce6 administration at “−3 h”, 3 h prior to PDT at “0 h”. The standard errors of the mean are presented as error bars. PDT-induced decreases in both the mean rStO2 (−40%) and rBF levels (−60%) were observed at 3 h post-PDT. The mean rBF readings in these mice remained low up till 48 h post PDT. Recovery of both parameters to baseline values was observed 2 weeks after PDT.
Figure 3
Figure 3
Mean tumor rStO2 and rBF values in partial responders (PRs; n = 4) expressed as ratios of the baseline readings measured before Ce6 administration at “−3 h”, 3 h prior to the first PDT (A and C) and second PDT (B and D) respectively. The standard errors of the mean are presented as error bars. The trends observed after the first and second PDT were different. The rStO2 values decreased by only about 15% compared to 40% following the first PDT. Although the rBF levels decreased by about 50%, these values made a quick recovery to almost 80% of baseline values within 48 h.
Figure 4
Figure 4
Mean tumor rStO2 (A) and rBF (B) values in drug-only control tumors (DC; n = 5) expressed as ratios of the baseline readings measured before Ce6 administration at “−3 h”. The standard errors of the mean are presented as error bars. The rStO2 and rBF values fluctuated above the baseline value (up to +35%) during the first 48 hours. The large decrease in rBF at 1 week (−40%) and 2 weeks (−55%) may be due to more “tortuous” tumor vasculature that restricted blood flow as the tumors grew larger (see Figure 6).
Figure 5
Figure 5
Mean tumor rStO2 (A) and rBF (B) values in untreated control tumors (UC; n = 5) expressed as ratios of the first baseline readings taken when the tumors reached the experiment size of 8 mm. The standard errors of the mean are presented as error bars. The rStO2 and rBF values in UCs fluctuated above the baseline value (up to +40%) during the first 48 h.
Figure 6
Figure 6
Fluorescence endomicroscopy images of tumor blood vessels from (A) a partial responder during a time of tumor regrowth at 3.5 weeks after reaching the experiment size of 8 mm, (B) a drug-only control at 2 weeks after reaching 8 mm and (C) an untreated control mouse at 1.5 weeks after reaching 8 mm. The “tortuous” blood vessel architecture seen in these images may explain the decrease in rBF in drug-only and untreated control tumors observed at 1 and 2 weeks when the tumors grew larger (Figures 4 and 5).
Figure 7
Figure 7
Mean tumor volume chart (A) and survival curve (B) plotted as a function of days after tumor induction show that complete responders remained tumor free for the duration of the study (up till 9 months post-PDT, data plotted till 40 days), while partial responders (mice which received repeat PDT) had a slight delay (about one week) in tumor growth progression compared to drug-only and untreated controls.
Figure 8
Figure 8
Images of a mouse from the complete responder group showing the tumor (A) before PDT, and at (B) 48 hours, (C) 2 weeks, (D) 1 month and (E) 6 months post-PDT. The tumor was eradicated and healing of the treatment area is seen by one month post-PDT. Long-term follow up subsequently showed no relapse of the tumor up to 9 months post-PDT.
Figure 9
Figure 9. Mean tumor rBF values in muscle tissue of control mice (n = 4) expressed as ratios of the first baseline readings measured using a probe with a source-detector (sd) distance of 8 mm compared to one with 3 mm are shown
The standard errors of the mean are presented as error bars. The measurements over a 2 day period showed that the blood flow readings are similar within a 5 mm difference in the sd distance.
Figure 10
Figure 10. Fluorescence intensities measured in vivo in tumors using a spectrometer at 1 h, 3 h and 4 h after intravenous administration of Ce6

References

    1. Andersson-Engels S, Klinteberg C, Svanberg K, Svanberg S. In vivo fluorescence imaging for tissue diagnostics. Phys Med Biol. 1997;42:815–24. - PubMed
    1. Berg K, Selbo PK, Weyergang A, Dietze A, Prasmickaite L, Bonsted A, Engesaeter BØ, Angell-Petersen E, Warloe T, Frandsen N, Høgset A. Porphyrin-related photosensitizers for cancer imaging and therapeutic applications. J Microsc. 2005;218:133–47. - PubMed
    1. Ethirajan M, Chen Y, Joshi P, Pandey RK. The role of porphyrin chemistry in tumor imaging and photodynamic therapy. Chem Soc Rev. 2011;40:340–62. doi: 10.1039/b915149b. - DOI - PubMed
    1. Josefsen LB, Boyle RW. Unique Diagnostic and Therapeutic Roles of Porphyrins and Phthalocyanines in Photodynamic Therapy, Imaging and Theranostics. Theranostics. 2012;2:916–66. doi: 10.7150/thno.4571. - DOI - PMC - PubMed
    1. Mallidi S, Spring BQ, Chang S, Vakoc B, Hasan T. Optical Imaging, Photodynamic Therapy and Optically Triggered Combination Treatments. Cancer J. 2015;21:194–205. doi: 10.1097/PPO.0000000000000117. - DOI - PMC - PubMed

MeSH terms

LinkOut - more resources