. 2017 Apr 25;8(17):28328-28341.
doi: 10.18632/oncotarget.16053.

Identification of protein clusters predictive of tumor response in rectal cancer patients receiving neoadjuvant chemo-radiotherapy

Affiliations

Identification of protein clusters predictive of tumor response in rectal cancer patients receiving neoadjuvant chemo-radiotherapy

Ombretta Repetto et al. Oncotarget. .

Abstract

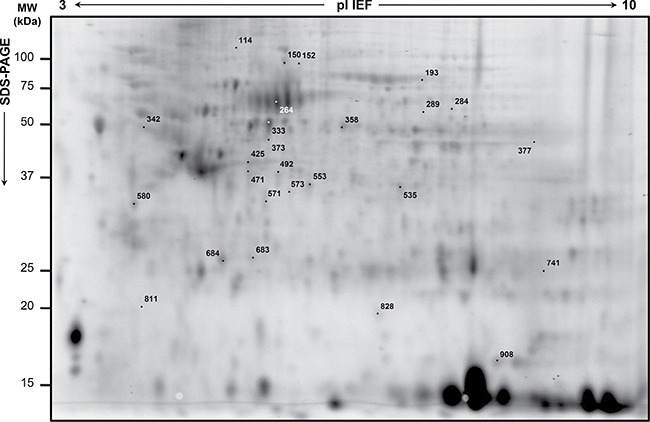
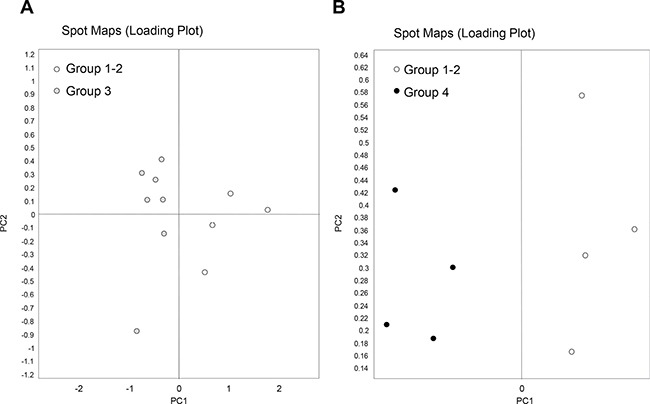
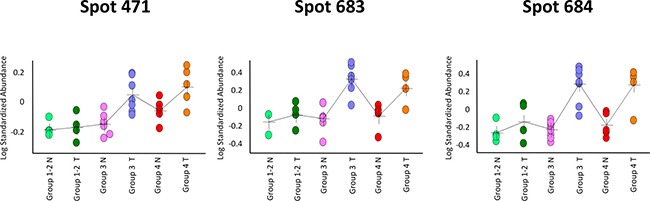
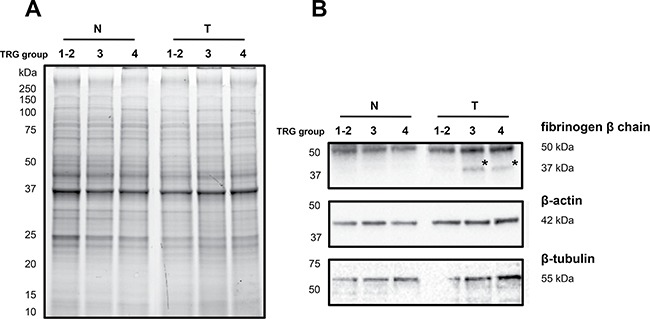
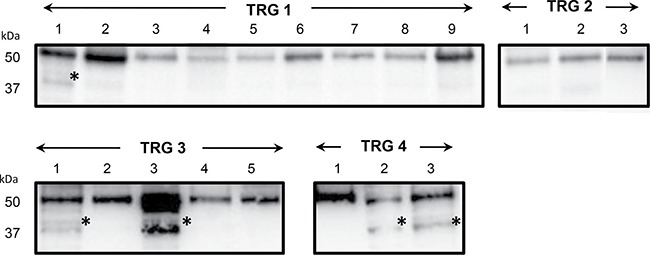
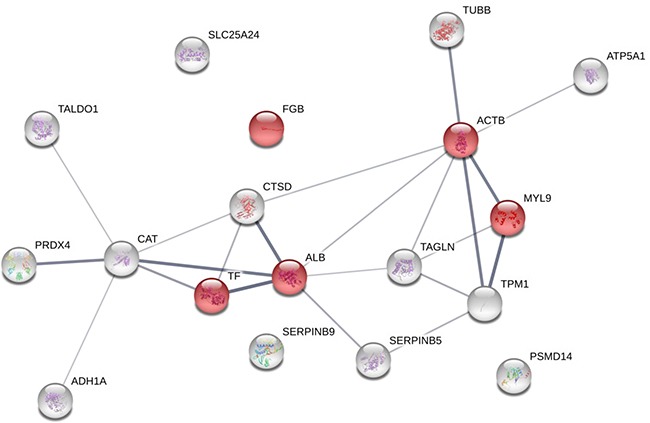
Preoperative neoadjuvant chemoradiotherapy (nCRT) is the gold standard in locally advanced rectal cancer, only 10-30% of patients achieving benefits. Currently, there is a need of a reliable selection of markers for the identification of poor or non-responders prior to therapy. In this work, we compared protein profiles before therapy of patients differing in their responses to nCRT to find novel predictive markers of response to therapy. Patients were grouped into 3 groups according to their tumor regression grading (TRG) after surgery: 'TRG 1-2', good responders, 'TRG 3' and 'TRG 4', poor responders. Paired surgical specimens of rectal cancer and healthy (histologically confirmed) rectal tissues from 15 patients were analysed before nCRT by two dimensional difference in gel electrophoresis followed by mass spectrometry. Thirty spots were found as differentially expressed (p < 0.05). Among them, 3 spots (spots 471, 683 and 684) showed an increased amount of protein in poor responders compared with good responders, and they were more tumor associated compared with healthy tissues. Proteins of these spots were identified as fibrinogen ß chain fragment D, actin isoforms, B9 and B5 serpins, cathepsin D isoforms and peroxiredoxin-4. In an independent validation set of 20 rectal carcinomas we validated the increased fibrinogen ß chain abundance before nCRT in poor responders by immunoblotting. In conclusion, we propose a risk-stratification tool in predicting the response to nCRT treatment in rectal cancer based on the quantity of these proteins.

Keywords: DIGE; gastric diseases; rectal cancer; rectal proteomics; tumor regression grade.


Conflict of interest statement

CONFLICTS OF INTEREST

The authors declare that they have no competing interests as defined by Oncotarget or other interests that might be perceived to influence the results and discussion reported in this paper.

Figures

Figure 1
Figure 1. Representative analytical proteome map of rectal cancer (RC)
Proteins were resolved by isoelectrofocusing over the pI 3-10, followed by 8–16% gradient second dimension. Numbered spots indicate the differentially expressed spots in RC biopsies of ‘TRG 1-2′ versus either ‘TRG 3′ or ‘TRG 4′. Identified proteins are listed in Table 2.
Figure 2
Figure 2. Principal component analysis of rectal cancer (RC) biopsies belonging to good responders (TRG 1-2) and poor responders (TRG3 and TRG4)
Loading plots show an overview of the all spot maps from all groups. Proteome maps of ‘TRG 1–2′ have been compared with those of either ‘TRG 3′ (A) or ‘TRG 4′ (B). Each circle represents a spot map of a surgical specimen collected from one patient.
Figure 3
Figure 3. Graphical visualization abundance distribution of spots 471, 683 and 684 in rectal tumor (T) and healthy normal tissue (N) tissues
The three differential spots increased in content in poor responders (‘TRG 3′ and ‘TRG 4′) versus good responders (‘TRG 1-2′), and had a higher content in cancer tissues than the healthy normal ones. In each graph, a single circle represents the Log standardized abundance of the spot calculated for one gel/patient.
Figure 4
Figure 4. Immunoblotting analyses of three differentially expressed proteins in healthy normal (N) versus rectal tumor (T) tissues belonging to good responders (TRG 1-2) and poor responders (TRG3 and TRG4)
(A) Image of the 1DE gel acquired with Chemidoc before its transfer to nitrocellulose membrane. (B) Signals of proteins cross-reacting with antibodies directed against fibrinogen β-chain, β-actin and β-tubulin. Asterisk indicates the signal of a cross-reacting band at around 37 kDa.
Figure 5
Figure 5. Immunoblotting validation of fibrinogen β chain expression in individual rectal cancer tissues of patients with good (TRG 1-2) or poor response (TRG 3 and TRG4) to neoadiuvant chemoradiotherapy
Asterisk indicates the signal of a cross-reacting band at around 37 kDa.
Figure 6
Figure 6. Protein-protein interaction maps of the overexpressed protein spots in rectal cancers of poor responders (TRG3 and TRG4) before therapy
The interaction map of all the identified proteins increasing in content in poor responders is illustrated as confidence view, where the thickness of the connecting lines indicates the level of confidence. Stronger associations are represented by thicker lines. Each circle represents a protein. The proteins involved in ‘platelet activation’ and ‘blood coagulation’ are visualized in red. The STRING tool (http://string-db.org) was used to make the networks and analyse the biological processes.

References

    1. Fazeli MS, Keramati MR. Rectal cancer: a review. Med J Islam Repub Iran. 2015;29:171. - PMC - PubMed
    1. Maas M, Nelemans PJ, Valentini V, Das P, Rödel C, Kuo LJ, Calvo FA, García-Aguilar J, Glynne-Jones R, Haustermans K, Mohiuddin M, Pucciarelli S, Small W, Jr, et al. Long-term outcome in patients with a pathological complete response after chemoradiation for rectal cancer: a pooled analysis of individual patient data. Lancet Oncol. 2010;11:835–844. - PubMed
    1. Hardiman KM, Ulintz PJ, Kuick RD, Hovelson DH, Gates CM, Bhasi A, Rodrigues Grant A, Liu J, Cani AK, Greenson JK, Tomlins SA, Fearon ER. Intra-tumor genetic heterogeneity in rectal cancer. Lab Invest. 2016;96:4–15. - PMC - PubMed
    1. Kim SH, Chang HJ, Kim DY, Park JW, Baek JY, Kim SY, Park SC, Oh JH, Yu A, Nam BH. What is the ideal tumor regression grading system in rectal cancer patients after preoperative chemoradiotherapy? Cancer Res Treat. 2016;48:998–1009. - PMC - PubMed
    1. Peng YF, Yu WD, Pan HD, Wang L, Li M, Yao YF, Zhao J, Gu J. Tumor regression grades: potential outcome predictor of locally advanced rectal adenocarcinoma after preoperative radiotherapy. World J Gastroenterol. 2015;21:1851–1856. - PMC - PubMed