

Non-homologous end joining induced alterations in DNA methylation: A source of permanent epigenetic change
- PMID: 28423717
- PMCID: PMC5522286
- DOI: 10.18632/oncotarget.16122
Non-homologous end joining induced alterations in DNA methylation: A source of permanent epigenetic change
Abstract
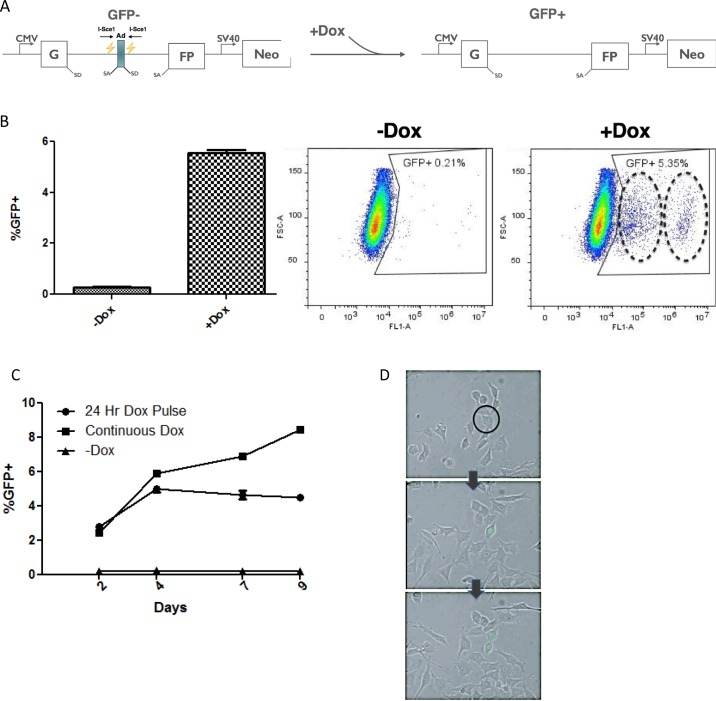
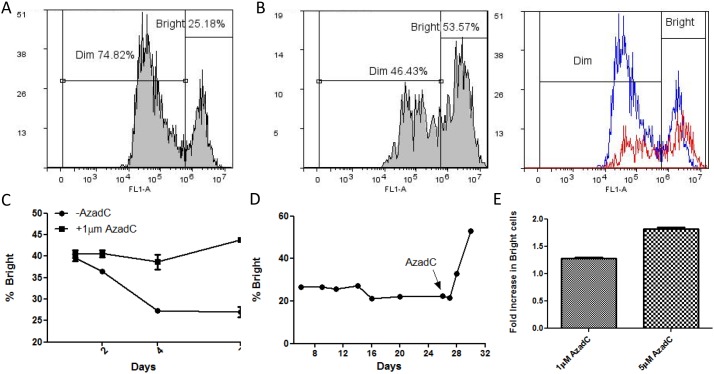
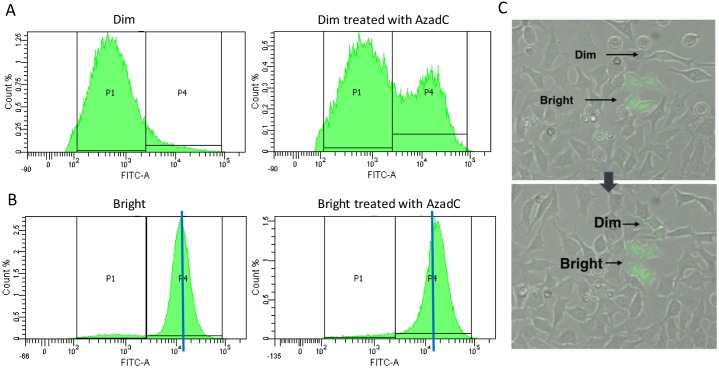
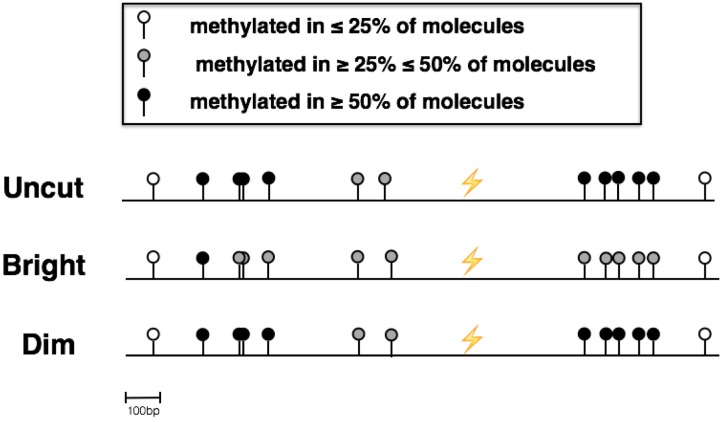
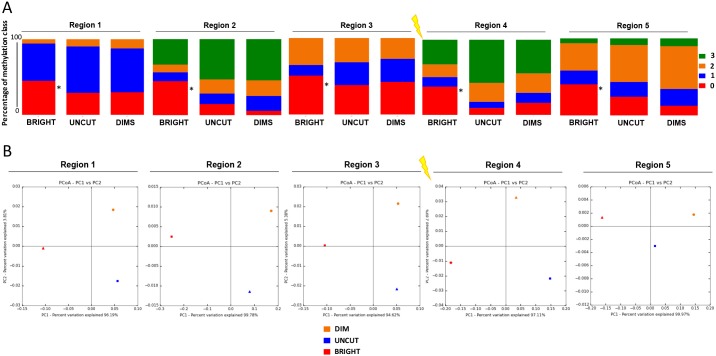
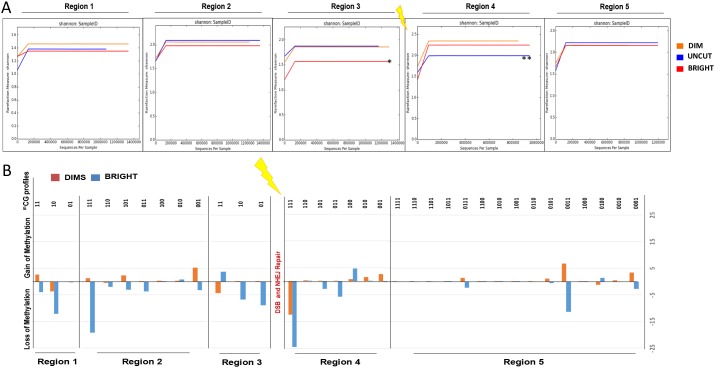
In addition to genetic mutations, epigenetic revision plays a major role in the development and progression of cancer; specifically, inappropriate DNA methylation or demethylation of CpG residues may alter the expression of genes that promote tumorigenesis. We hypothesize that DNA repair, specifically the repair of DNA double strand breaks (DSB) by Non-Homologous End Joining (NHEJ) may play a role in this process. Using a GFP reporter system inserted into the genome of HeLa cells, we are able to induce targeted DNA damage that enables the cells, after successfully undergoing NHEJ repair, to express WT GFP. These GFP+ cells were segregated into two expression classes, one with robust expression (Bright) and the other with reduced expression (Dim). Using a DNA hypomethylating drug (AzadC) we demonstrated that the different GFP expression levels was due to differential methylation statuses of CpGs in regions on either side of the break site. Deep sequencing analysis of this area in sorted Bright and Dim populations revealed a collection of different epi-alleles that display patterns of DNA methylation following repair by NHEJ. These patterns differ between Bright and Dim cells which are hypo- and hypermethylated, respectively, and between the post-repair populations and the original, uncut cells. These data suggest that NHEJ repair facilitates a rewrite of the methylation landscape in repaired genes, elucidating a potential source for the altered methylation patterns seen in cancer cells, and understanding the mechanism by which this occurs could provide new therapeutic targets for preventing this process from contributing to tumorigenesis.
Keywords: DNA damage; DNA methylation; DNA repair; NHEJ repair.
Conflict of interest statement
The authors declare no conflicts of interest.
Figures
Similar articles
-
DNA damage, homology-directed repair, and DNA methylation.PLoS Genet. 2007 Jul;3(7):e110. doi: 10.1371/journal.pgen.0030110. PLoS Genet. 2007. PMID: 17616978 Free PMC article.
-
Effects of chromatin decondensation on alternative NHEJ.DNA Repair (Amst). 2013 Nov;12(11):972-81. doi: 10.1016/j.dnarep.2013.08.004. Epub 2013 Sep 17. DNA Repair (Amst). 2013. PMID: 24051048
-
Impairment of the non-homologous end joining and homologous recombination pathways of DNA double strand break repair: Impact on spontaneous and radiation-induced mammary and intestinal tumour risk in Apc min/+ mice.DNA Repair (Amst). 2015 Nov;35:19-26. doi: 10.1016/j.dnarep.2015.08.002. Epub 2015 Sep 6. DNA Repair (Amst). 2015. PMID: 26435054
-
The clinical value of aberrant epigenetic changes of DNA damage repair genes in human cancer.Oncotarget. 2016 Jun 14;7(24):37331-37346. doi: 10.18632/oncotarget.7949. Oncotarget. 2016. PMID: 26967246 Free PMC article. Review.
-
Epigenetic regulation of DNA repair genes and implications for tumor therapy.Mutat Res Rev Mutat Res. 2019 Apr-Jun;780:15-28. doi: 10.1016/j.mrrev.2017.10.001. Epub 2017 Oct 7. Mutat Res Rev Mutat Res. 2019. PMID: 31395346 Review.
Cited by
-
Association of glomerular DNA damage and DNA methylation with one-year eGFR decline in IgA nephropathy.Sci Rep. 2020 Jan 14;10(1):237. doi: 10.1038/s41598-019-57140-0. Sci Rep. 2020. PMID: 31937846 Free PMC article.
-
Targeting shared pathways in tauopathies and age-related macular degeneration: implications for novel therapies.Front Aging Neurosci. 2024 Apr 3;16:1371745. doi: 10.3389/fnagi.2024.1371745. eCollection 2024. Front Aging Neurosci. 2024. PMID: 38633983 Free PMC article. Review.
-
Epigenome Chaos: Stochastic and Deterministic DNA Methylation Events Drive Cancer Evolution.Cancers (Basel). 2021 Apr 9;13(8):1800. doi: 10.3390/cancers13081800. Cancers (Basel). 2021. PMID: 33918773 Free PMC article. Review.
-
LncRNA HOTAIRM1 functions in DNA double-strand break repair via its association with DNA repair and mRNA surveillance factors.Nucleic Acids Res. 2023 Apr 24;51(7):3166-3184. doi: 10.1093/nar/gkad143. Nucleic Acids Res. 2023. PMID: 36881772 Free PMC article.
-
Systematic identification of non-coding somatic single nucleotide variants associated with altered transcription and DNA methylation in adult and pediatric cancers.NAR Cancer. 2021 Feb 1;3(1):zcab001. doi: 10.1093/narcan/zcab001. eCollection 2021 Mar. NAR Cancer. 2021. PMID: 33554123 Free PMC article.
References
-
- Morgan HD, Sutherland HGE, Martin DIK, Whitelaw E. Epigenetic inheritance at the agouti locus in the mouse. Nat Genet. 1999;23:314–8. - PubMed
-
- Robertson KD. DNA methylation and human disease. Nat Rev Genet. 2005;6:597–610. http://www.nature.com/nrg/journal/v6/n8/suppinfo/nrg1655_S1.html doi. - PubMed
MeSH terms
Substances
Grants and funding
LinkOut - more resources
Full Text Sources
Other Literature Sources
