. 2017 Jun 20;8(25):40373-40388.
doi: 10.18632/oncotarget.16177.

RMP promotes epithelial-mesenchymal transition through NF-κB/CSN2/Snail pathway in hepatocellular carcinoma

Affiliations

RMP promotes epithelial-mesenchymal transition through NF-κB/CSN2/Snail pathway in hepatocellular carcinoma

Wei Zhou et al. Oncotarget. .

Abstract

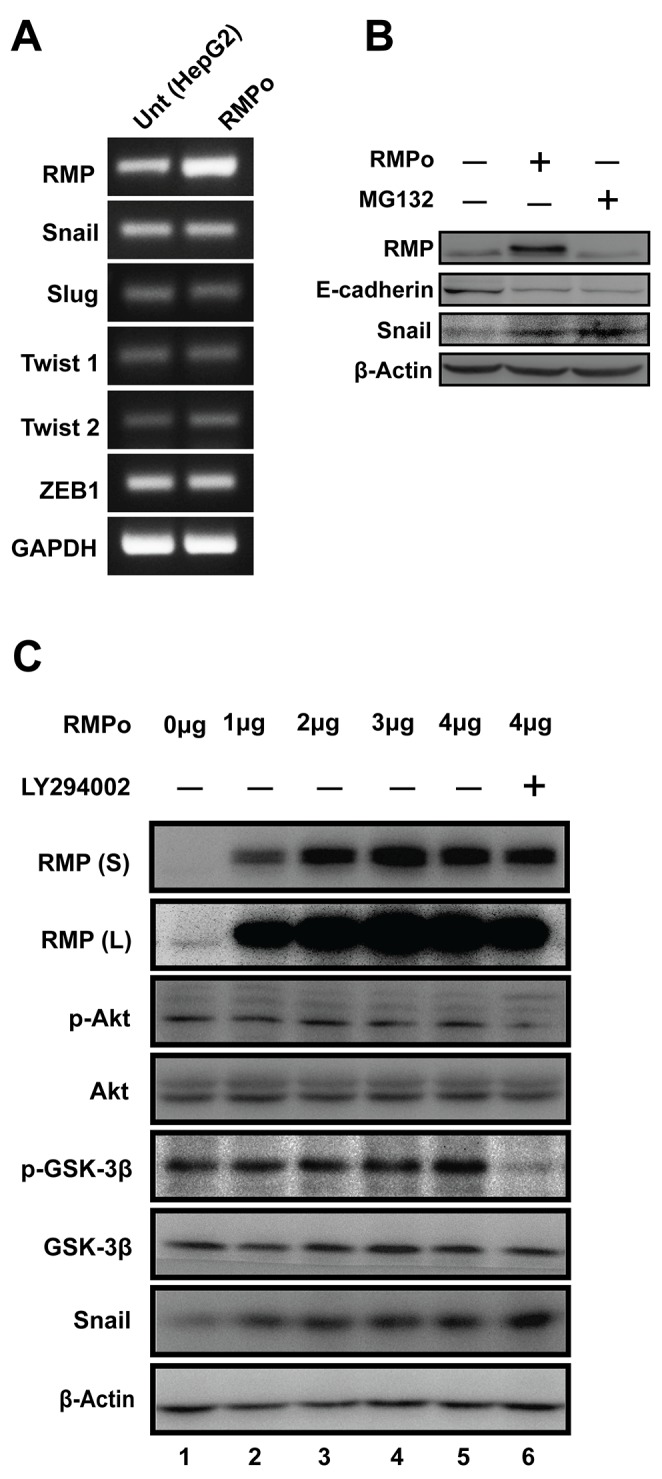
Epithelial-mesenchymal transition (EMT) is a significant risk factor for metastasis in hepatocellular carcinoma (HCC) patients and with poor prognosis. In this study, we demonstrate the key role of RPB5-mediating protein (RMP) in EMT of HCC cells and the mechanism by which RMP promote EMT. RMP increases migration, invasion, and the progress of EMT of HCC cells, which facilitates the accumulation of Snail, a transcriptional repressor involved in EMT initiation. NF-κB is activated by RMP, which directly promotes the expression of COP9 signalosome 2 (CSN2) to repress the degradation of Snail. Pulmonary metastases mouse model demonstrates that RMP induces metastasis in vivo. Immunohistochemical analysis of human HCC tissues confirms the correlation of RMP with the expression of E-cadherin, p65, CSN2 and Snail in vivo. Collectively, these findings indicate that RMP promotes EMT and HCC metastasis through NF-κB/CSN2/Snail pathway. These results suggest that RMP and p65 may serve as potential candidates of the targets in the treatment of metastatic HCC.

Keywords: EMT; HCC; NF-κB; RMP; metastasis.


Conflict of interest statement

CONFLICTS OF INTEREST

The authors declare that they have no conflicts of interest with the contents of this article.

Figures

Figure 1
Figure 1. RMP promotes migration and invasion of HCC cells in vitro
HepG2 (left panel) and Huh7 (right panel) cells were transfected with empty vector (Vector), pCDNA3.1-RMP overexpression vector (RMPo), Scramble shRNA sequence (Scr) and pGPU6-RMP shRNA vector (RMPi) respectively. (A) The expression of RMP in transfected HepG2 (right panel) and Huh7 (left panel) cells was examined by western blot, β-Actin was shown as loading control. (B-C) Wound-healing assay was carried out to determine the migration of HepG2 (B) or Huh7 (C) cells transfected with indicated plasmids. The width of the wound was measured in 0, 12 and 24 hrs after wounding. Scale bar, 50 μm. Width of wound was scored and depicted graphically (right panel). (D-E) Migration (without matrigel) and invasion (with matrigel) of HepG2 (D) or Huh7. (E) cells transfected with indicated plasmid were detected by transwell system. Cells were stained with crystal violet after 24 hrs incubation. Scale bar, 5μm. Number of invaded cells were scored and depicted graphically (right panel). (F) HepG2 cells were transfected with 0, 1, 2, 3, 4 μg of pCDNA3.1-RMP overexpression vector (RMPo) as indicated. Migration (without matrigel) and invasion (with matrigel) were detected by transwell system. Scale bar, 5μm. The number of invaded cells was scored and depicted graphically (right panel). (G) HepG2 cells were transfected with increasing amount of pCDNA3.1-RMP overexpression vector (RMPo) as indicated in (F) and were harvested 48 hrs later. Cell lysates were subjected to western blot analysis with antibody against RMP. (H-I) HepG2 (H) or Huh7 (I) cells were transfected with indicated plasmids. Gelatinase activities of cell culture supernatant of each cell were measured by zymographic assay, and the band in 96 kDa and 72 kDa represents the activity of MMP9 and MMP2 respectively. Gelatinase activities were scored and are depicted graphically (right panel). The results are expressed as the mean ±SD of three independent experiments, each measurement was made in triplicates (*, P < 0.05, **, P < 0.01, ***, P < 0.001, ****, P < 0.0001, independent Student t test).
Figure 2
Figure 2. RMP promotes the progression of EMT in vitro
HepG2 cells were transfected with pCDNA3.1-RMP overexpression vector (RMPo) or pGPU6-RMP shRNA vector (RMPi). (A) HepG2 cells transfected with indicated plasmid was followed by cultured for 72 h. Wild type HepG2 cells treated with TGF-β (10 ng/ml) for 72 hrs and applied as a positive control of EMT. The morphology of cells was examined under microscope. Scale bar, outside 20 μm; inside 5 μm. (B) HepG2 cells transfected with indicated plasmid were subjected to sphere forming assay. After culture in suspension for 14 days, sphere number were counted in 3 random fields of microscope and depicted graphically (right panel). Scale bar, left panel 50 μm; right panel 5 μm. (C-D) Cell adhesion to fibronectin was examined in HepG2 (C) and Huh7 (D) cells transfected with empty vector (Vector), pCDNA3.1-RMP overexpression vector (RMPo), scramble shRNA sequence (Scr) and pGPU6-RMP shRNA vector (RMPi) respectively. After 1 to 4 hrs culture, non-adhesion cell were washed by PBS. Adhesion cells were calculated and depicted graphically. (E) The expression of RMP, E-cadherin, N-cadherin, Vimentin and Tubulin were analyzed in HepG2 transfected with indicated plasmid by western blot. β-Actin was shown as loading control. The results are expressed as the mean ±SD of three independent experiments, each measurement was made in triplicates (*, P < 0.05, **, P < 0.01, ***, P < 0.001, independent Student t test).
Figure 3
Figure 3. RMP-mediated EMT is dependent on stabilization of Snail in HCC cells
(A) The mRNA expression of RMP, Snail, Slug, Twist1, Twist2, ZEB1 and GAPDH in HepG2 cells transfected with pCDNA3.1-RMP overexpression vector (RMPo) was measured by RT-PCR. GAPDH was shown as loading control. (B) HepG2 cells were untransfected or transfected with pCDNA3.1-RMP overexpression vector (RMPo) followed by treatment with or without proteasome inhibitor MG132 for 12 hrs. Expression of RMP, E-cadherin, Snail and β-Actin was examined by western blot. β-Actin was shown as loading control. (C) HepG2 cells were transfected with 0, 1, 2, 3, 4 μg pCDNA3.1-RMP overexpression vector (RMPo) followed by treatment with or without 50 μM Akt inhibitor LY294002 for 24 hr. Proteins expression were analyzed by western blot analysis with antibodies as indicated. RMP(S) and RMP (L) represent the blots with short or long time exposure, respectively. β-Actin was shown as a loading control. The results are expressed as the mean ±SD in three independent experiments.
Figure 4
Figure 4. NF-κB, but not Akt is required for RMP-mediated stabilization of Snail
(A) HepG2 cells were transfected with 0, 1, 2, 3, 4 μg of pCDNA3.1-RMP overexpression vector (RMPo). Wild type HepG2 cells with 8 hrs TNF-α treatment were applied as a positive control of NF-κB activation. Then expression of RMP, p-p65, p65 and β-Actin were examined by western blot. β-Actin was shown as a loading control. (B) HepG2 cells were transfected with indicated plasmids and then treated with or without 10 ng/ml TNF-α for 24 hrs. Cell invasion was detected in 4, 12 or 24 hrs respectively. Scale bar, 100μm. (C) HepG2 cells were transfected with various plasmids and then treated with or without 10 ng/ml TNF-α for 20 min or 24 hrs as indicated, respectively. The protein expression was analyzed by western blot with the indicated antibodies. (D) HepG2 cells transfected with pCDNA3.1-RMP overexpression vector (RMPo), followed by treatment with or without 50 μM LY294002 or 8 μM BAY-11-7082 for 24 hrs and protein expression was analyzed by western blot with antibodies indicated, β-Actin was shown as loading control. (E) HepG2 cells transfected with or without pCDNA3.1-RMP overexpression vector (RMPo) were treated with or without 50 μM LY294002 or 8 μM BAY-11-7082, and then subjected to transwell assay. The experiments were performed in three independent experiments.
Figure 5
Figure 5. RMP up-regulated CSN2 expression through nuclear translocation of NF-κB
(A) HepG2 cells transfected with pCDNA3.1-RMP overexpression vector (RMPo) for 24 hrs and followed by culturing with or without 10 ng/ml TNF-α for additional 24 hrs. Then the mRNA expression of RMP, CSN2 and GAPDH were analyzed by RT-PCR. GAPDH was shown as loading control. (B) HepG2 cells transfected with pCDNA3.1-RMP overexpression vector (RMPo) for 48 hrs and cultured with or without 10 ng/ml TNF-α and 8 μM BAY-11-7802 for additional 24 hrs. Protein expression of RMP, CSN2 and β-Actin were analyzed by western blot, and β-Actin was shown as loading control. (C) HepG2 cells were co-transfected with pCDNA3.1-RMP overexpression vector (RMPo), pGL3-CSN2-promoter vector and pGL4.74 vector for 48 hrs, then cultured with or without 10 ng/ml TNF-α and 8 μM BAY-11-7802 for additional 24 hrs. Promoter activity of CSN2 was detected by dual-luciferase assay. (D) Schematic of CSN2 promoter, which contains 3 NF-κB binding sites. CSN2 promoter region 1 (P1) containing p65 binding site 1 and CSN2 promoter region 2 & 3 (P2&3) containing p65 binding site 2 and 3 (upper panel). HepG2 cells were transfected with pCDNA3.1-RMP overexpression vector (RMPo) or pGPU6-RMP shRNA vector (RMPi) for 24 hrs, followed by treatment with or without 10 ng/ml TNF-α for additional 8 hrs. Chromatin immunoprecipitation (ChIP) was carried out with antibodies as indicated. Promoter fragment of CSN2 was immunoprecipitated by p65 antibody. The coding region of CSN2 was used as negative control (bottom). (E-F) HepG2 cells were stably transfected with pCDNA3.1-RMP overexpression vector (RMPo) or pGPU6-RMP shRNA vector (RMPi). Cell lysates were extracted and immunoprecipitation was performed with antibodies against RMP (E) or p65 (F). The immunoprecipitates were fractionated in 10% SDS-PAGE and subjected to western blot analysis with antibodies against RMP and p65 as indicated. Preimmune IgG was applied as control of immunoprecipitation (Control IgG). (G) Cytoplasm and nucleus fractions of HepG2 cells were stably transfected with indicated plasmid or treated with 10 ng/ml TNF-α for 20 min, then subjected to western blot. Lamin B and β-tubulin were used as the endogenous control from nucleus and cytoplasm, respectively. The results are expressed as the mean ±SD in three independent experiments (*, P < 0.05, **, P < 0.01, ***, P < 0.001, ****, P < 0.0001, independent Student t test).
Figure 6
Figure 6. RMP activates the metastasis of HCC cells through TNF-α/NF-κB pathway in vivo
(A) The lung metastasis mouse model in mice was constructed by using HepG2 cells transfected with pCDNA3.1-RMP overexpression vector (RMPo) or pGPU6-RMP shRNA vector (RMPi), n=10 per group. 5 mice in each group were additionally tail vein injected with 10 μg LPS after 14 days tumor formation. Lungs of mice were dissected at 28th day. The metastatic nodules from each group are marked by arrow, Scale bar, 1 cm. (B) lungs of mice were sectioned and subjected into H&E staining. Dashed line marked the metastasis nodule, Scale bar 20 μm. (C) The lung metastases in each slide which shown in (B) was plotted and depicted graphically. Seven slides of each group was taken into account. (D) Tumor tissues of lung metastasis derived from RMPo cells were subjected with immunohistochemistry staining with the antibodies as indicated. Dashed line marked the metastasis nodule in serial sections. Scale bar, 20 μm. The results are expressed as the mean ±SD of three independent experiments (*, P < 0.05, **, P < 0.01, ***, P < 0.001, independent Student t test).
Figure 7
Figure 7. RMP regulates the expression of EMT factors in human HCC tissues
(A) The expression of RMP and E-cadherin in human HCC tissues was determined by immunohistochemistry. Scale bar, 20 μm. (B) Linear regression analysis of the expression of RMP and E-cadherin in 40 human HCC tissues, showing inverse correlation between RMP and E-cadherin, P = 0.0083. (C) The expression of RMP, E-cadherin and Snail in invasive front of human HCC tissue was determined by immunohistochemistry, dashed line indicate the border between tumor (T) and para-tumor (PT). Scale bar, 20 μm. (D) The expression of RMP, p-p65, CSN2 in tumor (T) and para-tumor (PT) tissues of 15 HCC patients was determined by immunohistochemistry. Scale bar, 20 μm. (E) The expression of RMP, p-p65, CSN2 as determined in (D) was measured and calculated. The expression of these factors was classified into high, medium and low. (F) Model proposing a role of RMP and p65 induced stabilization of Snail in EMT.

Similar articles

Cited by

References

    1. Siegel R, Ma J, Zou Z, Jemal A. Cancer statistics, 2014. CA Cancer J Clin. 2014;64:9–29. - PubMed
    1. Budhu A, Forgues M, Ye QH, Jia HL, He P, Zanetti KA, Kammula US, Chen YD, Qin LX, Tang ZY, Wang XW. Prediction of venous metastases, recurrence, and prognosis in hepatocellular carcinoma based on a unique immune response signature of the liver microenvironment. Cancer Cell. 2006;10:99–111. - PubMed
    1. Reichl P, Dengler M, van Zijl F, Huber H, Fuhrlinger G, Reichel C, Sieghart W, Peck-Radosavljevic M, Grubinger M, Mikulits W. Axl activates autocrine transforming growth factor-beta signaling in hepatocellular carcinoma. Hepatology. 2015;61:930–941. - PMC - PubMed
    1. Thiery JP. Epithelial-mesenchymal transitions in tumour progression. Nature reviews Cancer. 2002;2:442–454. - PubMed
    1. Dorjsuren D, Lin Y, Wei WX, Yamashita T, Nomura T, Hayashi N, Murakami S. RMP, a novel RNA polymerase II subunit 5-interacting protein, counteracts transactivation by hepatitis B virus X protein. Molecular and cellular biology. 1998;18:7546–7555. - PMC - PubMed

MeSH terms