. 2017 Apr 19;21(1):97.
doi: 10.1186/s13054-017-1672-7.

Plasma metabolomics for the diagnosis and prognosis of H1N1 influenza pneumonia

Affiliations

Plasma metabolomics for the diagnosis and prognosis of H1N1 influenza pneumonia

Mohammad M Banoei et al. Crit Care. .

Abstract

Background: Metabolomics is a tool that has been used for the diagnosis and prognosis of specific diseases. The purpose of this study was to examine if metabolomics could be used as a potential diagnostic and prognostic tool for H1N1 pneumonia. Our hypothesis was that metabolomics can potentially be used early for the diagnosis and prognosis of H1N1 influenza pneumonia.

Methods: 1H nuclear magnetic resonance spectroscopy and gas chromatography-mass spectrometry were used to profile the metabolome in 42 patients with H1N1 pneumonia, 31 ventilated control subjects in the intensive care unit (ICU), and 30 culture-positive plasma samples from patients with bacterial community-acquired pneumonia drawn within the first 24 h of hospital admission for diagnosis and prognosis of disease.

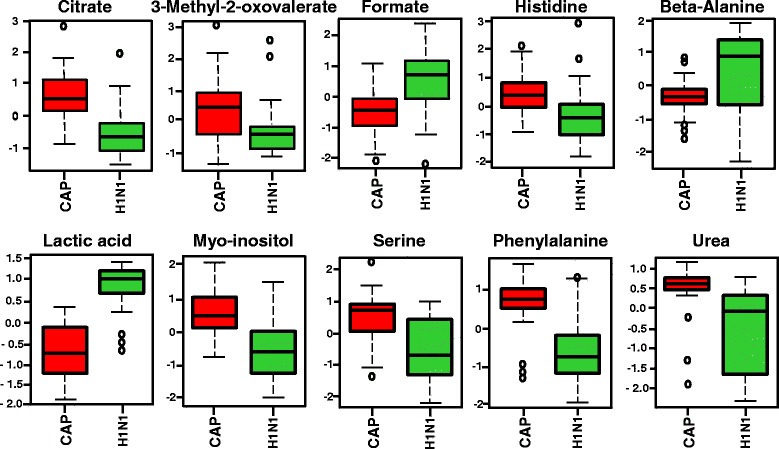
Results: We found that plasma-based metabolomics from samples taken within 24 h of hospital admission can be used to discriminate H1N1 pneumonia from bacterial pneumonia and nonsurvivors from survivors of H1N1 pneumonia. Moreover, metabolomics is a highly sensitive and specific tool for the 90-day prognosis of mortality in H1N1 pneumonia.

Conclusions: This study demonstrates that H1N1 pneumonia can create a quite different plasma metabolic profile from bacterial culture-positive pneumonia and ventilated control subjects in the ICU on the basis of plasma samples taken within 24 h of hospital/ICU admission, early in the course of disease.

Keywords: Biomarkers; GC-MS; H1N1 pneumonia; Metabolomics; NMR.


Figures

Fig. 1
Fig. 1
The orthogonal partial least-squares discriminant analysis (OPLS-DA) of patients with H1N1 vs. patients with CAP with positive bacterial cultures showing the best possible discrimination. a OPLS-DA plot for proton nuclear magnetic resonance data (R 2 = 0.824, Q 2 = 0.657, P < 0.0001). b OPLS-DA plot for gas chromatography-mass spectrometry data (R 2 = 0.937, Q 2 = 0.879, P < 0.0001). The x-axis is the prediction component that shows differences between groups, and the y-axis shows the orthogonal component differences within the group. R 2 represents goodness of fit, Q 2 represents a goodness of prediction, and the P value shows the significance level of the model (x-axis = predictive components, y-axis = orthogonal component)
Fig. 2
Fig. 2
The orthogonal partial least-squares discriminant analysis (OPLS-DA) of patients with H1N1 vs. ventilated ICU control subjects shows the best possible discrimination. a OPLS-DA plot for proton nuclear magnetic resonance data (R 2 = 0.889, Q 2 = 0.789, and P < 0.0001). b OPLS-DA plot for gas chromatography-mass spectrometry data (R 2 = 0.963, Q 2 = 0.946, P < 0.0001). The x-axis represents the prediction component that shows differences between groups, and the y-axis represents the orthogonal component differences within the group. R 2 represents goodness of fit, Q 2 represents goodness of prediction, and P value shows the significance level of the model (x-axis = predictive components, y-axis = orthogonal component)
Fig. 3
Fig. 3
Univariate analysis showing important metabolites/features between samples of patients with H1N1 pneumonia and bacterial pneumonia samples. The top ten metabolites detected by proton nuclear magnetic resonance (first line) and gas chromatography-mass spectrometry (second line) that have significantly changed in plasma between samples of patients with H1N1 pneumonia and culture-positive bacterial pneumonia samples (units in normalized and scaled concentrations). The x-axis shows the specific metabolite, and the y-axis is the relative concentration when samples of patients with community-acquired pneumonia are compared with the samples of patients with H1N1. The box-and-whisker plots show the mean and SD of the metabolite
Fig. 4
Fig. 4
Univariate analysis showing important features of metabolites between H1N1 pneumonia samples and ventilated ICU control samples. The top ten metabolites/features detected by proton nuclear magnetic resonance (first line) and gas chromatography-mass spectrometry (second line) that have significantly changed in the plasma between H1N1 pneumonia samples and ventilated ICU control samples (units in normalized and scaled concentrations). The x-axis shows the specific metabolite, and the y-axis is the relative concentration when samples of patients with H1N1 are compared with the ventilated ICU control patient samples. The box-and-whisker plots show the mean and SD of the metabolite
Fig. 5
Fig. 5
The supervised orthogonal partial least-squares discriminant analysis (OPLS-DA) shows the best possible discrimination between nonsurvivors and survivors of H1N1 infection. a OPLS-DA plot for proton nuclear magnetic resonance data (R 2 = 0.831, Q 2 = 0.597, P = 0.004). b OPLS-DA plot for gas chromatography-mass spectrometry data (R 2 = 0.909, Q 2 = 0.829, P = 0.0001). The x-axis represents the prediction component that shows differences between groups, and the y-axis represents the orthogonal component differences within the group. R 2 represents goodness of fit, Q2 represents goodness of prediction, and P value shows the significance level of the model (x-axis = predictive components, y-axis = orthogonal component)
Fig. 6
Fig. 6
Univariate analysis showing all metabolites/features between H1N1 pneumonia nonsurvivors and H1N1 pneumonia survivors. All significant metabolites/features detected by proton nuclear magnetic resonance (first and second lines) and gas chromatography-mass spectrometry (third line) that have significantly changed in the plasma between H1N1 pneumonia nonsurvivors (D) and H1N1 pneumonia survivors (S) (units in normalized and scaled concentrations). The x-axis shows the specific metabolite, and the y-axis is the relative concentration when samples from surviving patients with H1N1 are compared with the samples of nonsurviving patients with H1N1. The box-and-whisker plots show the mean and SD of the metabolite

Similar articles

Cited by

References

    1. Perez-Padilla R, de la Rosa-Zamboni D, Ponce de Leon S, Hernandez M, Quiñones-Falconi F, Bautista E, et al. Pneumonia and respiratory failure from swine-origin influenza A (H1N1) in Mexico. N Engl J Med. 2009;361(7):680–9. doi: 10.1056/NEJMoa0904252. - DOI - PubMed
    1. Ramsey C, Kumar A. H1N1: viral pneumonia as a cause of acute respiratory distress syndrome. Curr Opin Crit Care. 2011;17(1):64–71. doi: 10.1097/MCC.0b013e3283427259. - DOI - PubMed
    1. Ruuskanen O, Lahti E, Jennings LC, Murdoch DR. Viral pneumonia. Lancet. 2011;377(9773):1264–75. doi: 10.1016/S0140-6736(10)61459-6. - DOI - PMC - PubMed
    1. Freed DH, Henzler D, White CW, Fowler R, Zarychanski R, Hutchison J, et al. Extracorporeal lung support for patients who had severe respiratory failure secondary to influenza A (H1N1) 2009 infection in Canada. Can J Anaesth. 2010;57(3):240–7. doi: 10.1007/s12630-009-9253-0. - DOI - PMC - PubMed
    1. Sehgal N, Woodhead M. Predicting the unpredictable: is it possible clinically to separate H1N1 from non-H1N1 community-acquired pneumonia? Thorax. 2011;66(3):187–8. doi: 10.1136/thx.2010.157404. - DOI - PubMed