. 2017 Jun 22;129(25):3371-3378.
doi: 10.1182/blood-2017-01-763425. Epub 2017 Apr 19.

Clinical significance of somatic mutation in unexplained blood cytopenia

Affiliations

Clinical significance of somatic mutation in unexplained blood cytopenia

Luca Malcovati et al. Blood. .

Abstract

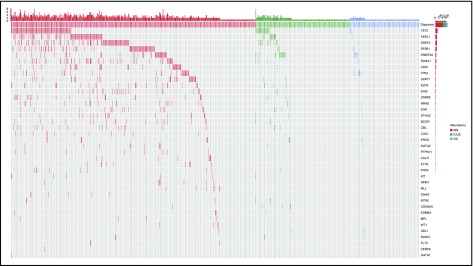
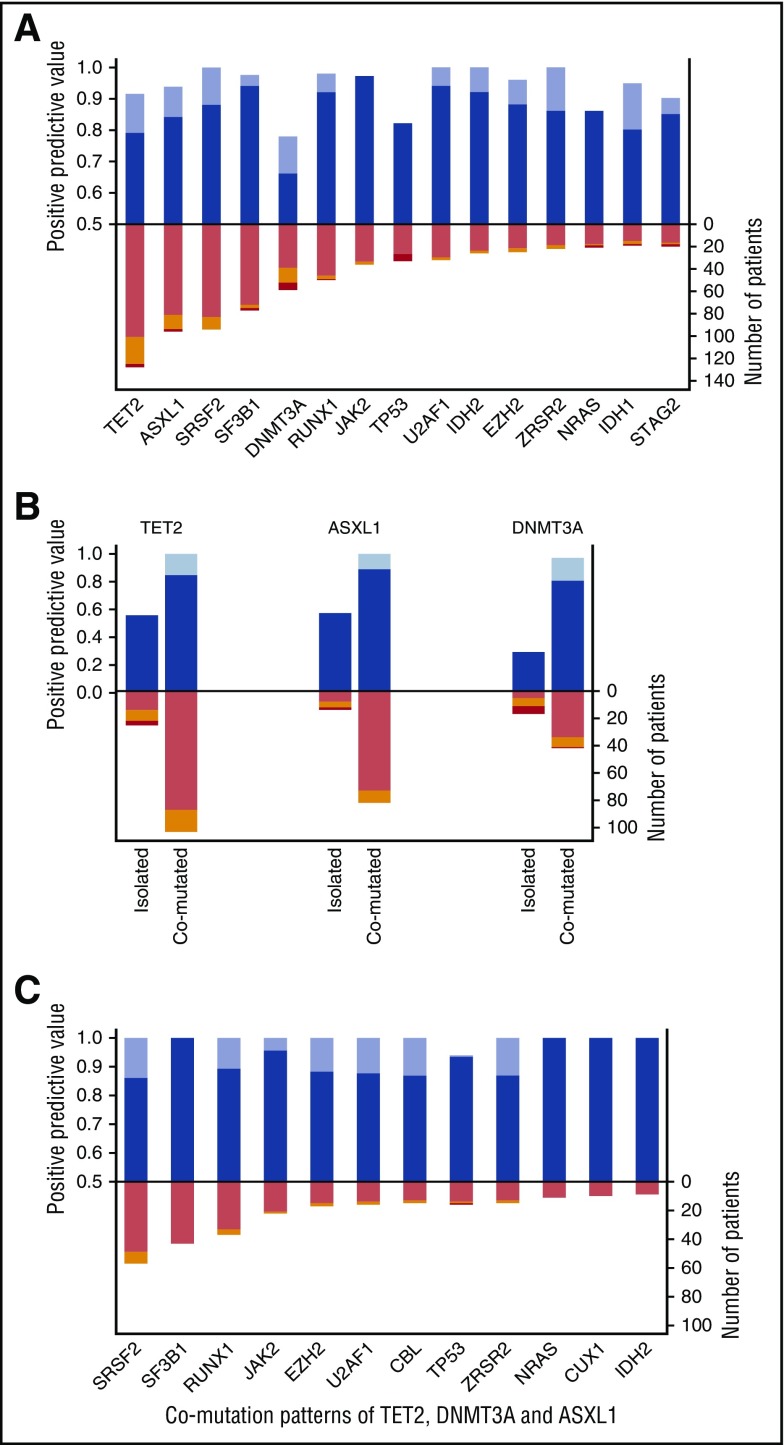
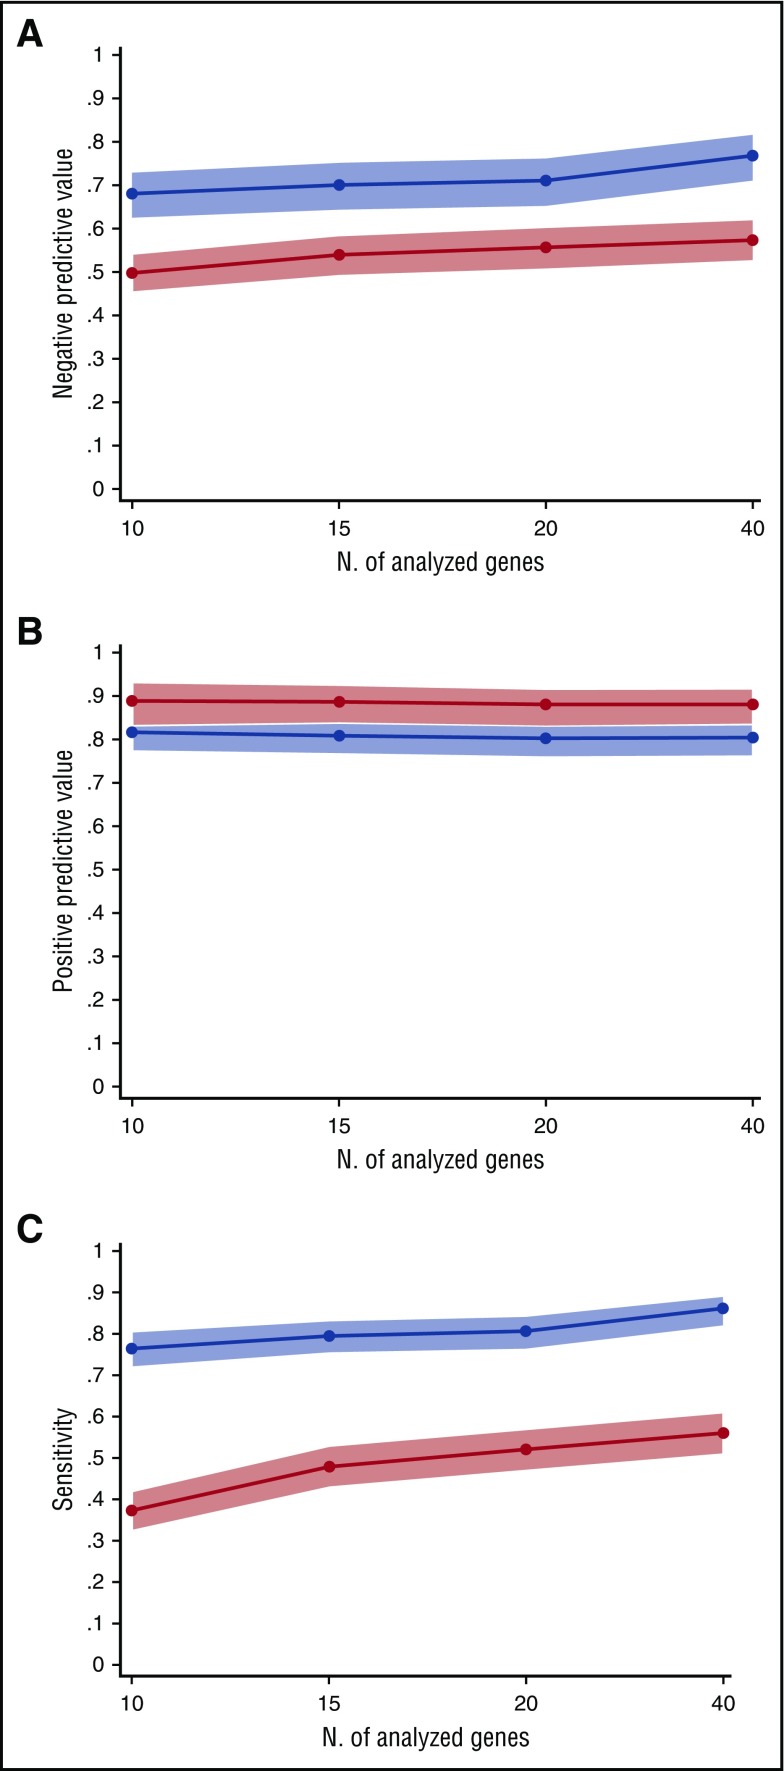
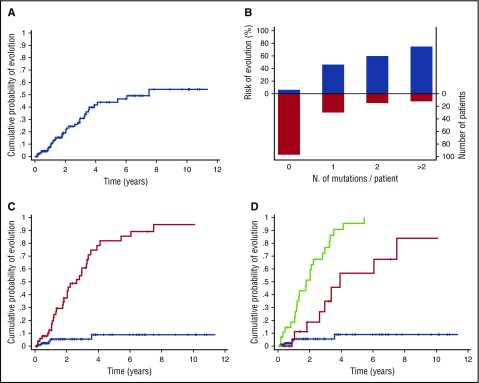
Unexplained blood cytopenias, in particular anemia, are often found in older persons. The relationship between these cytopenias and myeloid neoplasms like myelodysplastic syndromes is currently poorly defined. We studied a prospective cohort of patients with unexplained cytopenia with the aim to estimate the predictive value of somatic mutations for identifying subjects with, or at risk of, developing a myeloid neoplasm. The study included a learning cohort of 683 consecutive patients investigated for unexplained cytopenia, and a validation cohort of 190 patients referred for suspected myeloid neoplasm. Using granulocyte DNA, we looked for somatic mutations in 40 genes that are recurrently mutated in myeloid malignancies. Overall, 435/683 patients carried a somatic mutation in at least 1 of these genes. Carrying a somatic mutation with a variant allele frequency ≥0.10, or carrying 2 or more mutations, had a positive predictive value for diagnosis of myeloid neoplasm equal to 0.86 and 0.88, respectively. Spliceosome gene mutations and comutation patterns involving TET2, DNMT3A, or ASXL1 had positive predictive values for myeloid neoplasm ranging from 0.86 to 1.0. Within subjects with inconclusive diagnostic findings, carrying 1 or more somatic mutations was associated with a high probability of developing a myeloid neoplasm during follow-up (hazard ratio = 13.9, P < .001). The predictive values of mutation analysis were confirmed in the independent validation cohort. The findings of this study indicate that mutation analysis on peripheral blood granulocytes may significantly improve the current diagnostic approach to unexplained cytopenia and more generally the diagnostic accuracy of myeloid neoplasms.


Figures

Figure 1.
Figure 1.
Patterns of the mutations identified in the cohort of 683 patients with unexplained cytopenia. Distribution of somatic lesions in the analyzed genes according to the final diagnosis resulting from standard workup. Red color indicates a diagnosis of myeloid neoplasm; green indicates a diagnosis of ICUS, and blue indicates a diagnosis of other cytopenia. Each column represents an individual patient sample. MN, myeloid neoplasm; OC, other cytopenia.
Figure 2.
Figure 2.
Positive predictive value for myeloid neoplasm of the most frequently mutated genes. (A) Distribution and positive predictive value of the most frequently mutated genes. The upper bars indicate positive predictive values for myeloid neoplasm: blue indicates the predictive value according to standard diagnostic approach, whereas lavender depicts the predictive value when accounting for ICUS with mutation pattern highly specific for myeloid neoplasm as true positive cases. The lower bars report the distribution of mutated genes according to the final diagnosis of standard workup (pink, myeloid neoplasm; orange, ICUS; red, other cytopenia). (B) Distribution and positive predictive value of mutations in TET2, ASXL1, and DNMT3A as isolated mutations or comutation patterns (bar colors as in panel A). (C) Positive predictive value of the most frequent mutated genes associated with TET2, ASXL1, and DNMT3A mutations (bar colors as in panels A and B).
Figure 3.
Figure 3.
Predictive values and sensitivity according to the number of analyzed genes. (A) Negative predictive value for diagnosis of myeloid neoplasms of 40-gene, 20-gene, 15-gene, and 10-gene panels (supplemental Table 12). The blue line represents the negative predictive value of an unmutated status, whereas the red line indicates the negative predictive value of having no or 1 somatic mutation in the set of analyzed genes. Light blue and red areas indicate 95% CIs. (B) Positive predictive value for diagnosis of myeloid neoplasms of 40-gene, 20-gene, 15-gene, and 10-gene panels. The blue line represents the positive predictive value of having 1 or more somatic mutations in the set of analyzed genes, whereas the red line indicates the positive predictive value of having 2 or more somatic mutations. (C) Sensitivity for diagnosis of myeloid neoplasms of 40-gene, 20-gene, 15-gene, and 10-gene panels. The blue line represents the sensitivity of having 1 or more somatic mutations in the set of analyzed genes, whereas the red line indicates the sensitivity of having 2 or more somatic mutations.
Figure 4.
Figure 4.
Probability of progression to myeloid neoplasm of patients receiving a provisional diagnosis of ICUS, according to mutation status and pattern. (A) Cumulative probability of developing a myeloid neoplasm in patients receiving a diagnosis of ICUS. (B) Distribution and cumulative incidence of progression to myeloid neoplasms according to the number of somatic mutations per patient. (C) Cumulative probability of progression to myeloid neoplasm according to mutation status. The red curve represents the probability of progression of patients with ICUS carrying 1 or more mutations in the set of genes analyzed (CCUS), whereas the blue curve reports the probability of progression of patients with ICUS without evidence of clonal hematopoiesis. (D) Cumulative probability of progression to myeloid neoplasm according to mutation pattern. The green curve represents the probability of progression of patients with CCUS showing mutation patterns highly predictive for myeloid neoplasm; the red curve represents the probability of progression of patients with low predictive mutation pattern, whereas the blue curve represents the probability of progression of patients with unmutated status.
Figure 5.
Figure 5.
Overall survival of patients with CCUS and highly specific mutation pattern and of patients with myeloid neoplasm with myelodysplasia. Overall survival of patients with CCUS and highly specific mutation patterns (blue curve) and of patients with myeloid neoplasm with myelodysplasia without excess blasts (red curve) (P = .55). Comparable results were obtained when analyzing survival of patients with CCUS and highly specific mutation pattern and of patients with myeloid neoplasm with myelodysplasia and similar mutation pattern (P = .56).

Comment in

  • Now I cuss less about ICUS.
    Lindsley RC. Lindsley RC. Blood. 2017 Jun 22;129(25):3282-3283. doi: 10.1182/blood-2017-05-781245. Blood. 2017. PMID: 28642360 No abstract available.

References

    1. Vanasse GJ, Berliner N. Anemia in elderly patients: an emerging problem for the 21st century. Hematology Am Soc Hematol Educ Program. 2010;2010:271-275. - PubMed
    1. Guralnik JM, Eisenstaedt RS, Ferrucci L, Klein HG, Woodman RC. Prevalence of anemia in persons 65 years and older in the United States: evidence for a high rate of unexplained anemia. Blood. 2004;104(8):2263-2268. - PubMed
    1. Tettamanti M, Lucca U, Gandini F, et al. . Prevalence, incidence and types of mild anemia in the elderly: the “Health and Anemia” population-based study. Haematologica. 2010;95(11):1849-1856. - PMC - PubMed
    1. Patel KV, Harris TB, Faulhaber M, et al. . Racial variation in the relationship of anemia with mortality and mobility disability among older adults. Blood. 2007;109(11):4663-4670. - PMC - PubMed
    1. Riva E, Tettamanti M, Mosconi P, et al. . Association of mild anemia with hospitalization and mortality in the elderly: the Health and Anemia population-based study. Haematologica. 2009;94(1):22-28. - PMC - PubMed

Publication types