. 2017 May 1;214(5):1371-1386.
doi: 10.1084/jem.20160894. Epub 2017 Apr 19.

Enteropathy-associated T cell lymphoma subtypes are characterized by loss of function of SETD2

Affiliations

Enteropathy-associated T cell lymphoma subtypes are characterized by loss of function of SETD2

Andrea B Moffitt et al. J Exp Med. .

Abstract

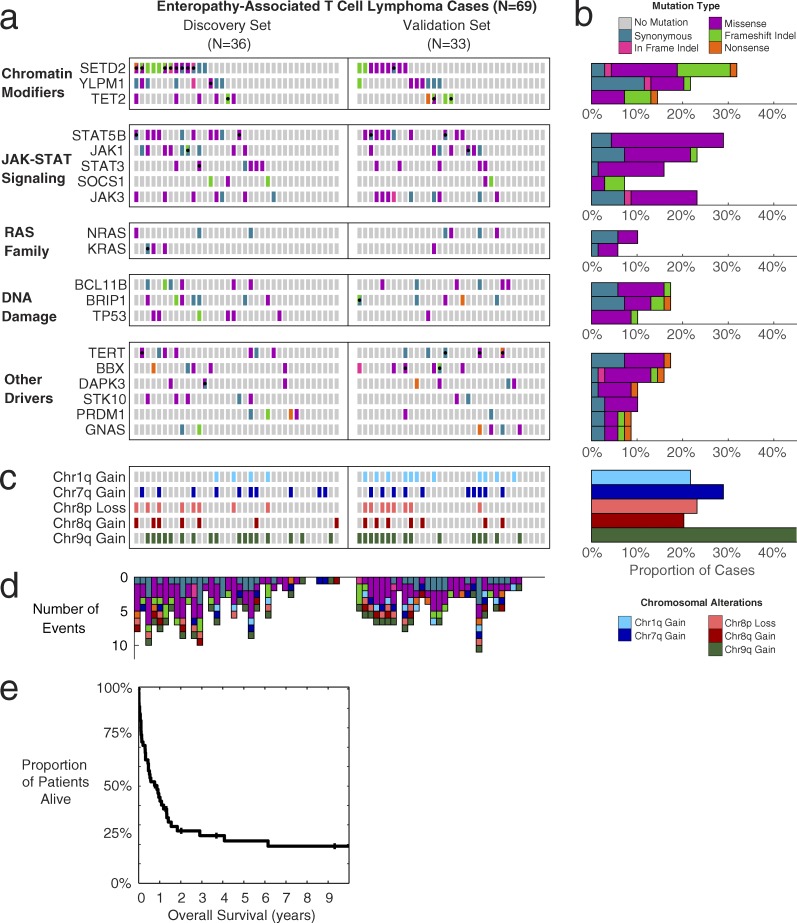
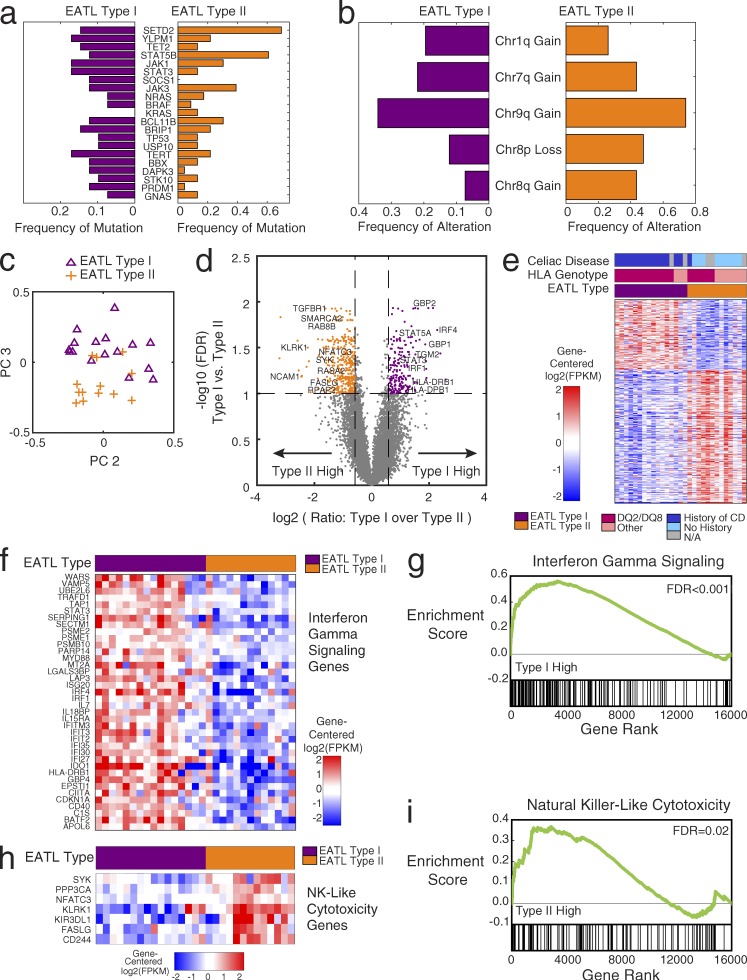
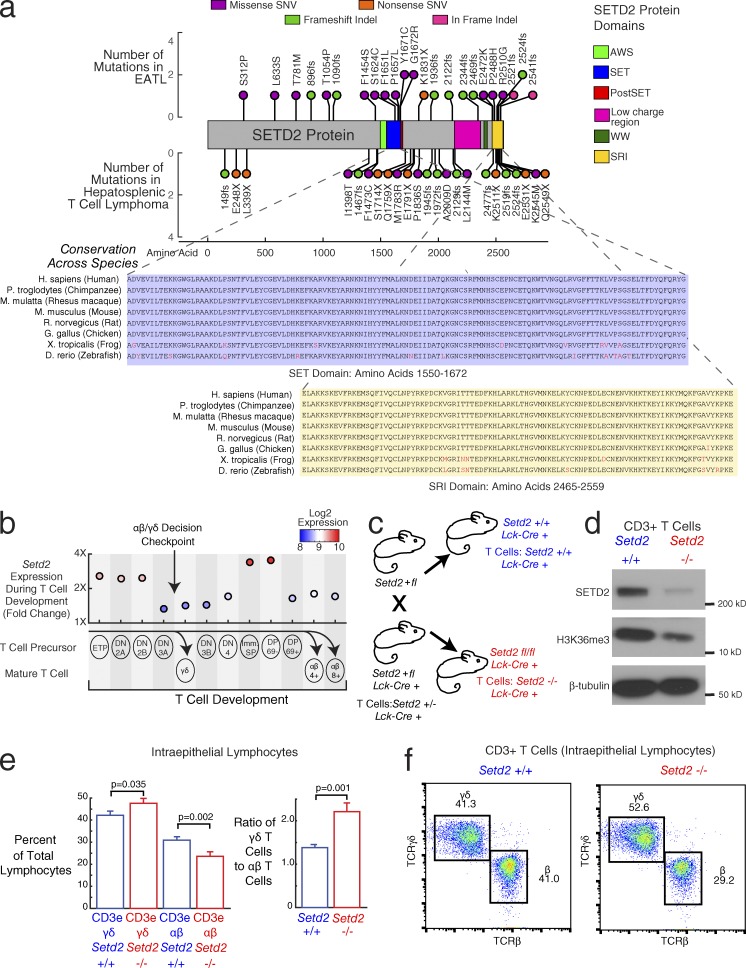
Enteropathy-associated T cell lymphoma (EATL) is a lethal, and the most common, neoplastic complication of celiac disease. Here, we defined the genetic landscape of EATL through whole-exome sequencing of 69 EATL tumors. SETD2 was the most frequently silenced gene in EATL (32% of cases). The JAK-STAT pathway was the most frequently mutated pathway, with frequent mutations in STAT5B as well as JAK1, JAK3, STAT3, and SOCS1 We also identified mutations in KRAS, TP53, and TERT Type I EATL and type II EATL (monomorphic epitheliotropic intestinal T cell lymphoma) had highly overlapping genetic alterations indicating shared mechanisms underlying their pathogenesis. We modeled the effects of SETD2 loss in vivo by developing a T cell-specific knockout mouse. These mice manifested an expansion of γδ T cells, indicating novel roles for SETD2 in T cell development and lymphomagenesis. Our data render the most comprehensive genetic portrait yet of this uncommon but lethal disease and may inform future classification schemes.


Figures

Figure 1.
Figure 1.
Somatic mutations, copy-number alterations, and survival of EATL patients. (a) Heat map of mutations in EATL cohort (n = 69). Every box represents the mutation status of a patient for a particular gene. Columns are split into discovery set with paired normals (n = 36) and validation set (n = 33). Gray, no mutation; teal, synonymous SNV; pink, in-frame indel; purple, missense SNV; green, frameshift indel; orange, nonsense SNV. Black dots indicate more than one mutation in that gene/patient, with boxes split diagonally to show different functions of multiple mutations. (b) Bar graph showing the percentage of cases in the cohort affected by each mutated gene. Bars are color coded by the most-damaging event type observed in each patient. (c) Heat map of arm-level copy-number alterations for each patient (n = 69). Light blue, chr1q gain; dark blue, chr7q gain; light red, chr8p loss; dark red, chr8q gain; dark green, chr9q gain. (d) Bar graph showing number of events from mutated genes and copy-number alterations shown in the heat maps above (n = 69). Bars are color-coded based on the type of alteration. (e) Kaplan-Meier curve showing overall survival of the EATL cohort (n = 55 with available outcome data). Median survival is 10 mo; 1-yr survival rate is 44%.
Figure 2.
Figure 2.
Differences between type I and type II EATL: mutations, copy number, and gene expression. (a) Bar graph indicating frequency of mutation of each gene within the type I (n = 41) and type II (n = 23) EATL cohorts separately: type I frequency (purple; left); type II frequency (orange; right). (b) Bar graph indicating frequency of alteration of each arm-level copy-number alteration within the type I (n = 41) and type II (n = 23) EATL cohorts separately: type I frequency (purple; left); type II frequency (orange; right). (c) Principal-component (PC) analysis of EATL RNA-sequencing gene expression data (n = 29). The second principal component is on the x axis, and the third principal component is on the y-axis. One point is plotted for each sample in the analysis in the principal-component space, labeled by the clinical assignment of type I or type II. (d) Volcano plot showing the selection of differentially expressed genes between EATL type I (n = 16) and type II (n = 13). Every point is one gene in the analysis (number of significant genes is 578). The x axis shows the log2 transformed ratio of mean expression in the type I samples over the mean expression in the type II samples. The y axis shows the log10 transformed q-value (after Benjamini–Hochberg correction) of a Student’s t test between EATL type I and type II. Genes that pass the thresholds for significance (dotted lines) are colored in orange and purple (FDR <0.1 and fold change >1.5× in either direction). Notable genes are labeled with text. (e) Heat map showing the genes that are differentially expressed between EATL type I and type II (type I: n = 16; type II: n = 13; number of genes shown is 578). Genes are median centered per row. Red indicates higher expression; blue indicates lower expression. The color bar shows the twofold range of expression depicted. Genes shown have FDR <0.1 and fold change >1.5× in either direction. Bars above the heat map indicate the clinical subtype, HLA type, and history of celiac disease. (f) Differentially expressed genes in the interferon-γ signaling pathway, showing higher expression in the EATL type I samples (type I: n = 16; type II: n = 13). (g) Gene set enrichment plot showing the enrichment of interferon-γ genes at the top of the ranked list, with genes ordered by difference in type I versus type II (type I: n = 16; type II: n = 13). Gene set enrichment analysis KS-test FDR <0.001. (h) Differentially expressed genes in the natural killer (NK)–like cytotoxicity pathway, showing higher expression in the EATL type II samples (type I: n = 16; type II: n = 13). (i) Gene set enrichment plot showing the enrichment of natural killer–like cytotoxicity genes at the top of the ranked list, with genes ordered by difference in type II versus type I (type I: n = 16; type II: n = 13). Gene set enrichment analysis KS-test FDR = 0.02.
Figure 3.
Figure 3.
SETD2 as a driver of increased γδ T cell proliferation. (a) Stem plot showing distribution of mutations in SETD2. (Top) Mutations in EATL (n = 69). (Middle) Mutations in HSTL, a γδ-driven T cell lymphoma (n = 68). x axis indicates amino acid position of each mutation. y axis indicates number of patients with the same mutation. Circles are color coded by type of mutation (pink, in-frame indel; purple, missense SNV; green, frameshift indel; orange, nonsense SNV). Colored regions in protein diagram represent protein domains (lime green, AWS [associated with SET] domain; blue, SET domain; red, post-SET domain; pink, low-charge region; dark green, WW domain; yellow, SRI [Set2 Rpbl-interacting] domain). (Bottom) Conservation of SET (blue) and SRI (yellow) domain amino acid sequences. Nonconserved amino acids are colored in red. (b) Setd2 expression during T cell development. Labeled circles indicate different stages of T cell development. Corresponding scatterplot shows mouse gene expression (fourfold range) during development, with circles colored by expression. Values represent mean expression from two to three samples per group (34 total samples). αβ T cells differentiate from the DP early T cells, whereas γδ T cell differentiate from the DN3 stage of early T cell. Stages: early T precursor (ETP), DN2A, DN2B, DN3A, DN3B, DN4, immature single positive (Imm. SP), DP CD69 (DP 69), DP CD69+ (DP 69+), γδ T cell (γδ), αβ CD4+ T cell (αβ 4+), αβ CD8+ T cell (αβ 8+). (c) Mouse breeding diagram. The final cross is between a heterozygous knockout Setd2+/fl mouse and a heterozygous knockout Setd2+/fl mouse with Cre transgene under the control of the T cell–specific Lck promoter (Lck-Cre+). The progeny mice that are used for downstream experiments are the wild-type Setd2 (+/+, blue) and null Setd2 (−/− in T cells, red), both with one copy of the Lck-Cre transgene. (d) Western blot in CD3+ splenic T cells from the Setd2 wild-type mouse (left) and Setd2-null mouse (right). (Top) SETD2 protein, (middle) H3K36 trimethylation, (bottom) β-tubulin control. Blot is representative of three experimental replicates. (e) Bar graph showing the quantification of CD3epos and TCRγδpos or CD3epos and TCRβpos T cell populations within IELs. Blue bars show populations from the Setd2+/+ wild-type T cells. Red bars show populations from the Setd2−/− null T cells. (Left) Left bars show γδ T cell receptor expressing populations, and right bars show αβ T cell receptor expressing populations. (Right) Ratio of γδ T cells to αβ T cells in Setd2+/+ T cells versus Setd2−/− T cells. Error bars show standard error of the mean. Two-way ANOVA tests were done for comparisons across genotype, correcting also for experimental batch. P-values for genotype differences are 0.035 (γδ T cells), 0.002 (αβ T cells), and 0.001 (ratio of γδ T cells to αβ T cells). Data are shown from five different experimental batches with a mean of five mice per batch. Total number of Setd2 wild-type mice: 11. Total number of Setd2-null mice: 15. (f) Flow cytometry representative plot showing the proportion of cells with TCR γδ and TCR β staining, corresponding to the αβ and γδ TCR-expressing T cell populations. (Left) Setd2 wild-type mouse (+/+). (Right) Setd2-null mouse (−/−). Plots are representative of results found comparing 11 Setd2 wild-type mice and 15 Setd2-null mice.

Similar articles

Cited by

References

    1. Adiconis X., Borges-Rivera D., Satija R., DeLuca D.S., Busby M.A., Berlin A.M., Sivachenko A., Thompson D.A., Wysoker A., Fennell T., et al. . 2013. Comparative analysis of RNA sequencing methods for degraded or low-input samples. Nat. Methods. 10:623–629. 10.1038/nmeth.2483 - DOI - PMC - PubMed
    1. Adzhubei I., Jordan D.M., and Sunyaev S.R.. 2013. Predicting functional effect of human missense mutations using PolyPhen-2. Curr. Protoc. Hum. Genet. Chapter 7:20. - PMC - PubMed
    1. Arps D.P., and Smith L.B.. 2013. Classic versus type II enteropathy-associated T-cell lymphoma: Diagnostic considerations. Arch. Pathol. Lab. Med. 137:1227–1231. 10.5858/arpa.2013-0242-CR - DOI - PubMed
    1. Bai Y., Ni M., Cooper B., Wei Y., and Fury W.. 2014. Inference of high resolution HLA types using genome-wide RNA or DNA sequencing reads. BMC Genomics. 15:325 10.1186/1471-2164-15-325 - DOI - PMC - PubMed
    1. Belhadj K., Reyes F., Farcet J.-P., Tilly H., Bastard C., Angonin R., Deconinck E., Charlotte F., Leblond V., Labouyrie E., et al. . 2003. Hepatosplenic γδ T-cell lymphoma is a rare clinicopathologic entity with poor outcome: Report on a series of 21 patients. Blood. 102:4261–4269. 10.1182/blood-2003-05-1675 - DOI - PubMed

Substances