. 2017 Jul;27(7):1250-1262.
doi: 10.1101/gr.215004.116. Epub 2017 Apr 19.

Chromatin module inference on cellular trajectories identifies key transition points and poised epigenetic states in diverse developmental processes

Affiliations

Chromatin module inference on cellular trajectories identifies key transition points and poised epigenetic states in diverse developmental processes

Sushmita Roy et al. Genome Res. 2017 Jul.

Abstract

Changes in chromatin state play important roles in cell fate transitions. Current computational approaches to analyze chromatin modifications across multiple cell types do not model how the cell types are related on a lineage or over time. To overcome this limitation, we developed a method called Chromatin Module INference on Trees (CMINT), a probabilistic clustering approach to systematically capture chromatin state dynamics across multiple cell types. Compared to existing approaches, CMINT can handle complex lineage topologies, capture higher quality clusters, and reliably detect chromatin transitions between cell types. We applied CMINT to gain novel insights in two complex processes: reprogramming to induced pluripotent stem cells (iPSCs) and hematopoiesis. In reprogramming, chromatin changes could occur without large gene expression changes, different combinations of activating marks were associated with specific reprogramming factors, there was an order of acquisition of chromatin marks at pluripotency loci, and multivalent states (comprising previously undetermined combinations of activating and repressive histone modifications) were enriched for CTCF. In the hematopoietic system, we defined critical decision points in the lineage tree, identified regulatory elements that were enriched in cell-type-specific regions, and found that the underlying chromatin state was achieved by specific erasure of preexisting chromatin marks in the precursor cell or by de novo assembly. Our method provides a systematic approach to model the dynamics of chromatin state to provide novel insights into the relationships among cell types in diverse cell-fate specification processes.


Figures

Figure 1.
Figure 1.
The CMINT approach. (A) The generative model of the CMINT approach. The model is made up of two parts: the first part corresponds to a mixture of P-dimensional Gaussians, one dimension for each mark. The second part specifies the transition probabilities of genes (black-white matrices) switching modules between a cell type and its predecessor. Each circle on the tree corresponds to a cell type. All cell types other than the root cell type (e.g., the starting differentiated cell type) have a k × k matrix of conditional probabilities. The starting cell type only has an initial prior probability distribution of module assignments (gray boxes). (B) The reprogramming system: (MEFs) mouse embryonic fibroblasts; (pre-iPSCs) partially reprogrammed induced pluripotent stem cells; (iPSCs) induced pluripotent stem cells. Bottom: Histone H3 lysine (K) modifications assessed by ChIP-chip analysis, listed according to their association with transcriptional activation or repression when present alone. (C) The hematopoietic system: (LT) long-term hematopoietic stem cells; (ST) short-term hematopoietic stem cells; (MPP) multipotent progenitor; (CMP) common myeloid progenitor; (MEP) megakaryocyte erythrocyte precursor; (EryA) immature erythrocytes; (EryB) mature erythrocytes; (GMP) granulocyte monocyte precursor; (GN) granulocyte; (MF) macrophage; (Mono) monocyte; (CLP) common lymphoid progenitor; (B) B lymphocyte; (CD4) CD4 T lymphocyte; (CD8) CD8 T lymphocyte. Bottom: Histone modifications profiled in Lara-Astiaso et al. (2014) and their known localization pattern.
Figure 2.
Figure 2.
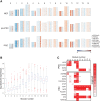
Comparison of CMINT against ChromHMM and GATE on 15 cell types of the hematopoiesis lineage. Cluster coherence (A) and silhouette index (B) of clusters generated by using ChromHMM and CMINT. The filled circles represent the cluster coherence and silhouette index values for ChromHMM. The box plots represent the values obtained using CMINT on 20 different random initializations. Cluster coherence (C) and silhouette index (D) of clusters generated by using GATE and CMINT on one branch of hematopoietic tree. The filled circles represent the silhouette index and cluster coherence values for GATE. The box plots represent the values obtained by CMINT for 20 different runs of the algorithm.
Figure 3.
Figure 3.
Chromatin modules in the reprogramming cell types identified by CMINT. (A) Heatmaps of 15 chromatin modules ordered from 0–14, obtained from CMINT: (top) MEFs; (middle) pre-iPSC; (bottom) iPSC. Each row in each heatmap represents one gene; each column represents one histone modification. (Red) enriched; (blue) depleted as compared to input. Height of each module is roughly proportional to the number of genes. (B) Box plots of gene expression of genes in each of the chromatin modules in iPSC. (C, top) Enrichment of reprogramming factors in the iPSC modules based on ChIP-chip data from iPSCs; (bottom) enrichment of pluripotency factors in the iPSC modules based on ChIP-seq data from ESCs.
Figure 4.
Figure 4.
Chromatin module transitions during reprogramming. (A) Plot of similarity of module membership of genes that change between MEFs and pre-iPSCs (left), and pre-iPSCs and iPSCs (right). Two different colors are used: (red) denotes similarity for modules with the same pattern (diagonal entries); (blue) denotes similarity for modules with different patterns (off-diagonal entries). The more red or blue an entry, the more similar are the matrices. The intensity of red (blue) corresponds to the significance of overlap of regions (genes) between two cell types and is the mean of the negative log of two hypergeometric test P-values. One P-value uses regions from one cell type as the background, and another P-value uses the regions from the second cell type as the background. (B) Example sets of genes that do not change greatly in expression but change in module membership. (Left) Gene names and log gene expression in iPSC, pre-iPSC (pre-i) and MEF. (Right) Heat map of enrichment of all histone modifications in iPSC, pre-iPSC and MEF compared to input. (Red) enriched; (blue) depleted. (412-Rik) 4121402D02Rik. (C) Left and right panels represent different gene sets, each exhibiting a different type of chromatin transition. (Left) Example set of genes that gain multivalency in iPSCs from an active state in MEF. (Right) Example set of genes that gain multivalency in iPSCs from a repressed state in MEF. Gene names are provided on the left. The heat maps show the enrichment of histone marks compared to input in each cell type. (D) Chromatin module dynamics of genes identified using rules encoding patterns. The right panels provide module membership of genes in (I) iPSC, (P) pre-iPSC, and (M) MEF. Gene names are provided on the left, histone modifications in red–blue heatmaps: (red) enriched; (blue) depleted. (i) Example of genes that transition through a multivalent state (module 7) in pre-iPSC to an active state in iPSCs from a repressive state in MEF. (ii) Examples of gene sets that transition to a multivalent state in iPSC (module 6) through activating modules (module 8, 9) in pre-iPSCs (top) or a repressed modules (module 5) in pre-iPSCs (bottom). (iii) Example sets of genes that acquire transient active modifications in pre-iPSC. (iv) Example sets of genes that display an aberrant activated state in pre-iPSC that is not recapitulated in the starting MEF or endpoint iPSC cell types: (170-Rik) 1700061G19Rik; (201-Rik) 2010002N04Rik.
Figure 5.
Figure 5.
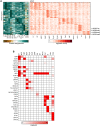
Cell-type–specific regions and decision points identified by CMINT in the hematopoietic hierarchy. (A, left) Regions that uniquely belong to module 15 in Supplemental Figure S5 and their cluster assignments in other cell types; (right) enrichment of each histone modification in the regions that uniquely belong to Module 15 in Supplemental Figure S5. (B) ORegAnno cis-regulatory element enrichment for factors (left) enriched in regions uniquely assigned to module 15 in each of the cell types indicated on top.
Figure 6.
Figure 6.
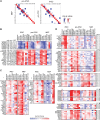
CMINT modules identified on the hematopoiesis cell lineage when applied to a subset of regions containing measurements for all histone modifications. (A) Heatmaps of 16 chromatin modules numbered from 0 to 15, obtained from CMINT restricted to 2000-bp regions with a non-zero value for each of the four histone modifications. Each row in each heatmap represents one region; each column represents one histone modification: (red) enriched; (white) depleted. The height of each module is roughly proportional to the number of regions within it. (B) Plot of similarity of module membership of regions, in which similarity was measured based on F-score, between each pair of cell types. Two different scales are used: (red) similarity for modules with similar patterns (diagonal entries); (blue) similarity for modules with different patterns (off-diagonal entries). The more red or blue an entry, the more similar are the matrices.
Figure 7.
Figure 7.
Rule-based analysis of hematopoiesis CMINT modules identifies regions associated with chromatin state transitions at different lineage points. (A, left) Regions that belong to modules enriched for marks (numbered greater than 10) in MEP and depleted for marks (less than 4) in GMP and their module assignments in other cell types. (Right) Histone modification level in the regions that obey the MEP > 10 and GMP < 4 module membership rule. (B) Similar to A, but for regions that obey the GMP > 10 and MEP < 4 rule. (C) As in A, but for regions that obey the CMP > 10 and CLP < 4 rule. (D) As in A, but for regions that obey the opposite rule, CLP > 10 and CMP < 4.

Similar articles

Cited by

References

    1. Apostolou E, Hochedlinger K. 2013. Chromatin dynamics during cellular reprogramming. Nature 502: 462–471. - PMC - PubMed
    1. Ashburner M, Ball CA, Blake JA, Botstein D, Butler H, Cherry JM, Davis AP, Dolinski K, Dwight SS, Eppig JT, et al. 2000. Gene ontology: tool for the unification of biology. The Gene Ontology Consortium. Nat Genet 25: 25–29. - PMC - PubMed
    1. Caruana R. 1997. Multitask learning. Mach Learn 28: 41–75.
    1. Chen X, Xu H, Yuan P, Fang F, Huss M, Vega VB, Wong E, Orlov YL, Zhang W, Jiang J, et al. 2008. Integration of external signaling pathways with the core transcriptional network in embryonic stem cells. Cell 133: 1106–1117. - PubMed
    1. Dempster A, Laird N, Rubin D. 1977. Maximum likelihood from incomplete data via the EM algorithm. J R Stat Soc Series B (Methodol) 39: 1–38.

Publication types