

Less effective selection leads to larger genomes
- PMID: 28424354
- PMCID: PMC5453316
- DOI: 10.1101/gr.212589.116
Less effective selection leads to larger genomes
Abstract
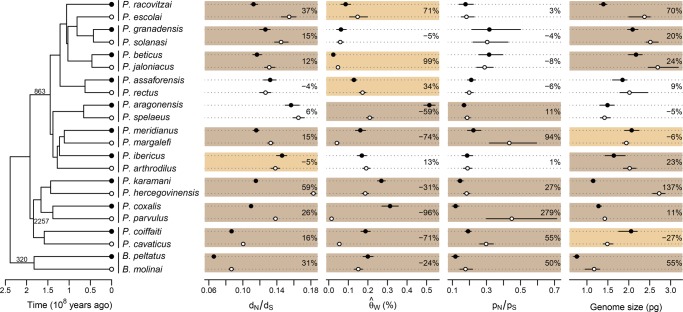
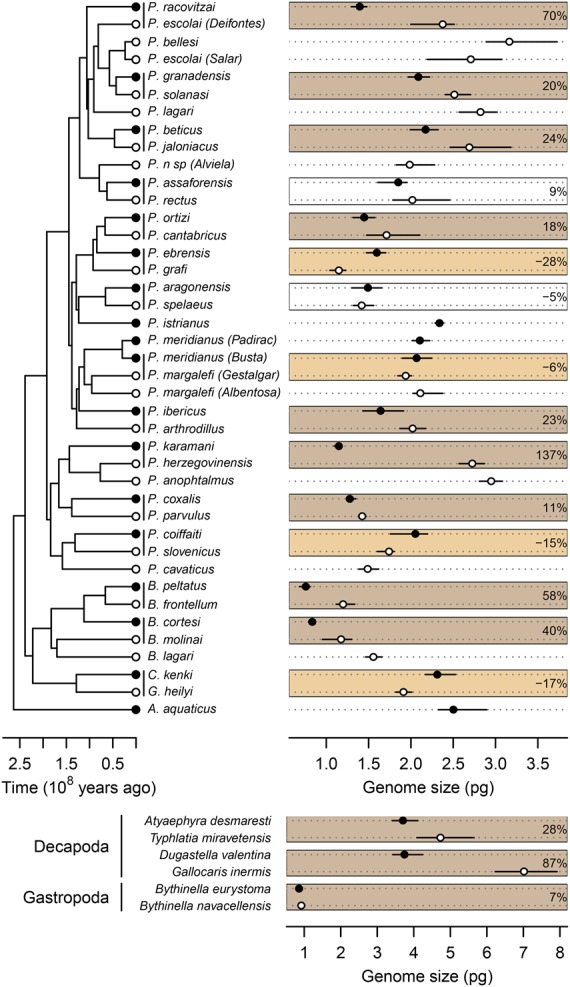
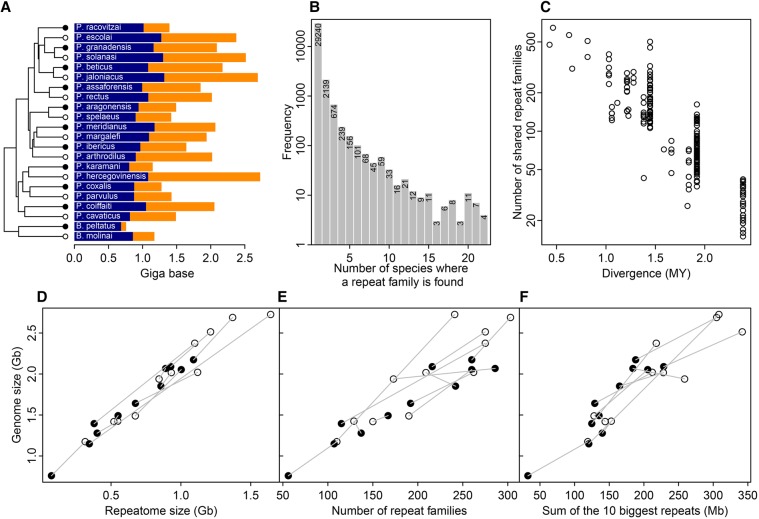
The evolutionary origin of the striking genome size variations found in eukaryotes remains enigmatic. The effective size of populations, by controlling selection efficacy, is expected to be a key parameter underlying genome size evolution. However, this hypothesis has proved difficult to investigate using empirical data sets. Here, we tested this hypothesis using 22 de novo transcriptomes and low-coverage genomes of asellid isopods, which represent 11 independent habitat shifts from surface water to resource-poor groundwater. We show that these habitat shifts are associated with higher transcriptome-wide [Formula: see text] After ruling out the role of positive selection and pseudogenization, we show that these transcriptome-wide [Formula: see text] increases are the consequence of a reduction in selection efficacy imposed by the smaller effective population size of subterranean species. This reduction is paralleled by an important increase in genome size (25% increase on average), an increase also confirmed in subterranean decapods and mollusks. We also control for an adaptive impact of genome size on life history traits but find no correlation between body size, or growth rate, and genome size. We show instead that the independent increases in genome size measured in subterranean isopods are the direct consequence of increasing invasion rates by repeat elements, which are less efficiently purged out by purifying selection. Contrary to selection efficacy, polymorphism is not correlated to genome size. We propose that recent demographic fluctuations and the difficulty of observing polymorphism variation in polymorphism-poor species can obfuscate the link between effective population size and genome size when polymorphism data are used alone.
© 2017 Lefébure et al.; Published by Cold Spring Harbor Laboratory Press.
Figures
References
-
- Ai B, Wang ZS, Ge S. 2012. Genome size is not correlated with effective population size in the oryza species. Evolution 66: 3302–3310. - PubMed
-
- Altschul SF, Gish W, Miller W, Myers EW, Lipman DJ. 1990. Basic local alignment search tool. J Mol Biol 215: 403–410. - PubMed
-
- Aronesty E. 2013. Comparison of sequencing utility programs. Open Bioinforma J 7: 1–8.
MeSH terms
LinkOut - more resources
Full Text Sources
Other Literature Sources