

Vertex coloring of graphs via phase dynamics of coupled oscillatory networks
- PMID: 28424457
- PMCID: PMC5430425
- DOI: 10.1038/s41598-017-00825-1
Vertex coloring of graphs via phase dynamics of coupled oscillatory networks
Erratum in
-
Author Correction: Vertex coloring of graphs via phase dynamics of coupled oscillatory networks.Sci Rep. 2018 Apr 12;8(1):6120. doi: 10.1038/s41598-018-23427-x. Sci Rep. 2018. PMID: 29651031 Free PMC article.
Abstract
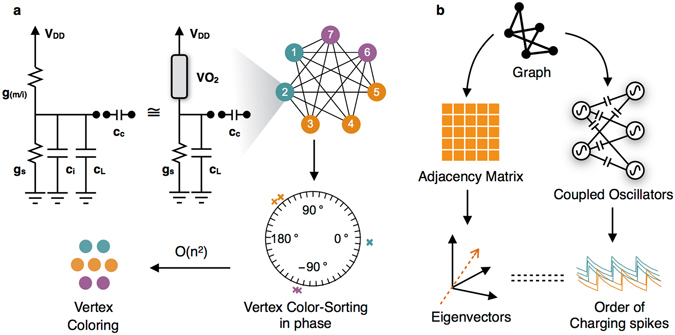
While Boolean logic has been the backbone of digital information processing, there exist classes of computationally hard problems wherein this paradigm is fundamentally inefficient. Vertex coloring of graphs, belonging to the class of combinatorial optimization, represents one such problem. It is well studied for its applications in data sciences, life sciences, social sciences and technology, and hence, motivates alternate, more efficient non-Boolean pathways towards its solution. Here we demonstrate a coupled relaxation oscillator based dynamical system that exploits insulator-metal transition in Vanadium Dioxide (VO2) to efficiently solve vertex coloring of graphs. Pairwise coupled VO2 oscillator circuits have been analyzed before for basic computing operations, but using complex networks of VO2 oscillators, or any other oscillators, for more complex tasks have been challenging in theory as well as in experiments. The proposed VO2 oscillator network harnesses the natural analogue between optimization problems and energy minimization processes in highly parallel, interconnected dynamical systems to approximate optimal coloring of graphs. We further indicate a fundamental connection between spectral properties of linear dynamical systems and spectral algorithms for graph coloring. Our work not only elucidates a physics-based computing approach but also presents tantalizing opportunities for building customized analog co-processors for solving hard problems efficiently.
Conflict of interest statement
The authors declare that they have no competing interests.
Figures


Similar articles
-
A CMOS-compatible oscillation-based VO2 Ising machine solver.Nat Commun. 2024 Apr 18;15(1):3334. doi: 10.1038/s41467-024-47642-5. Nat Commun. 2024. PMID: 38637549 Free PMC article.
-
Using synchronized oscillators to compute the maximum independent set.Nat Commun. 2020 Sep 17;11(1):4689. doi: 10.1038/s41467-020-18445-1. Nat Commun. 2020. PMID: 32943644 Free PMC article.
-
Coupled VO2 Oscillators Circuit as Analog First Layer Filter in Convolutional Neural Networks.Front Neurosci. 2021 Feb 11;15:628254. doi: 10.3389/fnins.2021.628254. eCollection 2021. Front Neurosci. 2021. PMID: 33642984 Free PMC article.
-
Harnessing the Metal-Insulator Transition of VO2 in Neuromorphic Computing.Adv Mater. 2023 Sep;35(37):e2205294. doi: 10.1002/adma.202205294. Epub 2022 Nov 29. Adv Mater. 2023. PMID: 36036767 Review.
-
Computing with oscillators from theoretical underpinnings to applications and demonstrators.Npj Unconv Comput. 2024;1(1):14. doi: 10.1038/s44335-024-00015-z. Epub 2024 Dec 4. Npj Unconv Comput. 2024. PMID: 39650119 Free PMC article. Review.
Cited by
-
Experimental investigation of performance differences between coherent Ising machines and a quantum annealer.Sci Adv. 2019 May 24;5(5):eaau0823. doi: 10.1126/sciadv.aau0823. eCollection 2019 May. Sci Adv. 2019. PMID: 31139743 Free PMC article.
-
Oscillatory Neural Networks Using VO2 Based Phase Encoded Logic.Front Neurosci. 2021 Apr 16;15:655823. doi: 10.3389/fnins.2021.655823. eCollection 2021. Front Neurosci. 2021. PMID: 33935638 Free PMC article.
-
Programmable coupled oscillators for synchronized locomotion.Nat Commun. 2019 Jul 24;10(1):3299. doi: 10.1038/s41467-019-11198-6. Nat Commun. 2019. PMID: 31341167 Free PMC article.
-
Highly reconfigurable oscillator-based Ising Machine through quasiperiodic modulation of coupling strength.Sci Rep. 2023 Mar 10;13(1):4005. doi: 10.1038/s41598-023-31155-0. Sci Rep. 2023. PMID: 36899045 Free PMC article.
-
Design of oscillatory neural networks by machine learning.Front Neurosci. 2024 Mar 4;18:1307525. doi: 10.3389/fnins.2024.1307525. eCollection 2024. Front Neurosci. 2024. PMID: 38500486 Free PMC article.
References
-
- Theis TN, Solomon PM. In Quest of the ‘Next Switch’: Prospects for Greatly Reduced Power Dissipation in a Successor to the Silicon Field-Effect Transistor. Proc. IEEE. 2010;98:2005–2014. doi: 10.1109/JPROC.2010.2066531. - DOI
-
- Zhirnov VV, Cavin RK, Hutchby JA, Bourianoff GI. Limits to binary logic switch scaling - a gedanken model. Proc. IEEE. 2003;91:1934–1939. doi: 10.1109/JPROC.2003.818324. - DOI
-
- Shukla, N. et al. Pairwise coupled hybrid vanadium dioxide-MOSFET (HVFET) oscillators for non-boolean associative computing. InElectron Devices Meeting (IEDM), 2014 IEEE International 28.7.1–28.7.4, 10.1109/IEDM.2014.7047129 (2014).
-
- Hoppensteadt FC, Izhikevich EM. Synchronization of laser oscillators, associative memory, and optical neurocomputing. Phys. Rev. E Stat. Phys. Plasmas Fluids Relat. Interdiscip. Top. 2000;62:4010–4013. - PubMed
-
- Hopfield JJ, Tank DW. ‘Neural’ computation of decisions in optimization problems. Biol. Cybern. 1985;52:141–152. - PubMed
Publication types
LinkOut - more resources
Full Text Sources
Other Literature Sources
