. 2017 Apr 19;7(1):933.
doi: 10.1038/s41598-017-01033-7.

Direct recognition of LPS drive TLR4 expressing CD8+ T cell activation in patients with rheumatoid arthritis

Affiliations

Direct recognition of LPS drive TLR4 expressing CD8+ T cell activation in patients with rheumatoid arthritis

Archana Tripathy et al. Sci Rep. .

Abstract

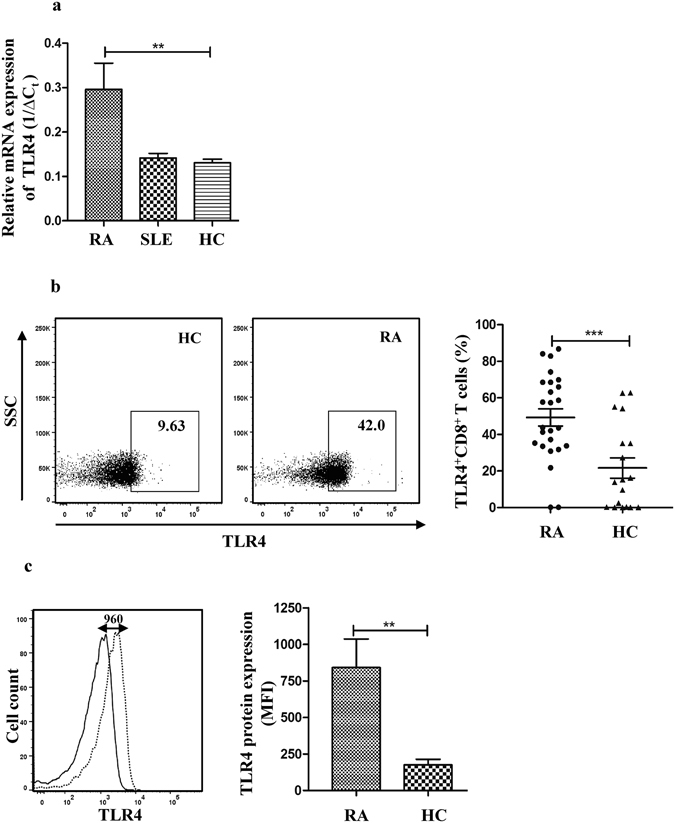
Aberrant immune responses characterize autoimmune disorders like Rheumatoid Arthritis (RA) wherein lymphocytes are recognized as key players. Role of CD8+ T cells in RA has been less defined however we found that these cells are activated in RA patients with increased expression of cytolytic granules and inflammatory mediators thereby modulating immune responses contributing to disease severity. Though unconventional expression of different Toll Like Receptors (TLRs) on CD8+ T cells has been proposed but their expression and role in T cell activation and differentiation in RA still remains obscure. Herein we report, for the first time, an increased expression of TLR4 on peripheral CD8+ T cells of RA patients and its role in skewing CD8+ T cells towards activated and inflammatory phenotype thereby playing a significant role in pathogenesis and progression of RA. We found that the surface expression of TLR4 on CD8+ T cells directly correlates with disease severity. Moreover, these CD8+ T cells respond to the TLR4 ligand LPS and express robust amounts of cytotolytic and inflammatory molecules including TNFα and IFNγ. Our study hence identifies an important role for CD8+ T cells in orchestrating RA through TLR4 mediated activation and differentiation.


Conflict of interest statement

The authors declare that they have no competing interests.

Figures

Figure 1
Figure 1
CD8+ T cells show increase TLR4 expression in RA patients. (a) Relative mRNA expression of TLR4 in peripheral CD8+ T cells was determined by qPCR from 45 RA patients, 9 SLE patients, and 42 healthy controls (HC). The qPCR Ct values were normalized (∆Ct) by subtracting the Ct values of ß-actin from those of TLR4 and 1/∆Ct was plotted. (b) A representative FACS dot plot panel shows TLR4 expression by CD8+ T cell in a HC and RA patient. The box gate represents CD3+CD8+ TLR4+ T cells. The graph represents percentages of CD3+CD8+TLR4+T cells in our case (n = 25) - control (n = 18) cohort. (c) Histogram shows a comparative fluorescence distribution of TLR4 for CD8+ T cells from a single HC and RA patient. A shift in the fluorescence intensity represents an increase in TLR4 expression on CD8+ T cells of the RA patient. Solid line represents HC and dotted line represents RA. The bar graph represents median fluorescence intensities (MFI) of TLR4 protein expressed on CD8+ T cells in the case-control samples as in (c), and indicates significant increase in TLR4 expression in RA patients. Bars represent the mean ± SEM. **p < 0.01, ***p < 0.001.
Figure 2
Figure 2
TLR4 expression by CD8+ T cells in RA patients at different disease activity states. (a,b) The scatter plots represent TLR4 mRNA and protein expression by CD8+ T cells of healthy controls (HC) and RA patients segregated according to low, moderate and high DAS28 scores. (c) The figure shows Spearman non-parametric correlation analysis of TLR4 protein (MFI) with DAS28 score. (d) ROC analysis for TLR4 protein expression in RA and HC samples. CD8+ T cells from 45 patients (DAS28: low = 16, moderate = 13, high = 16) and 42 controls were analyzed for TLR4 transcript analysis and CD8+ T cells from 25 patients (DAS28: low = 5, moderate = 11, high = 9) and 18 controls were analyzed for TLR4 protein analysis. Bars represent the mean ± SEM. *p < 0.05, **p < 0.01, ***p < 0.001, SE = standard error.
Figure 3
Figure 3
Inflammatory mediators profiling of CD8+ T cell in RA patients. (a) The figure represents fold increase in the relative mRNA expression, calculated with respect to β-actin, for Granzyme B, Perforin, TNFα and IFNγ in CD8+ T cells isolated from RA patients (n = 23) and HC samples (n = 23). (b) Bar graph shows percentage of Granzyme B, Perforin, TNFα and IFNγ expressing CD3+CD8+ T cells in rheumatoid arthritis (RA, n = 5) and healthy control (HC, n = 4) samples. (c) Bar graph represents CD8+ T cell subpopulations and a co-expression of TLR4 and Granzyme B proteins (n = 5, RA and n = 4, HC). Bars represent the mean ± SEM. *p < 0.05, **p < 0.01, ***p < 0.001.
Figure 4
Figure 4
LPS triggers TLR4 dependent activation of CD8+ T cells isolated from RA patients augmenting cytotoxic and inflammatory lymphocyte responses. CD8+ T cells isolated from RA (n = 6) and HC (n = 6) blood samples were pre-stimulated with 5 µM of VIPER and 5 µM CP7 for 2 hours and then treated with 5 µg/ml LPS for 6 hours. These cells were then evaluated for relative mRNA expression with respect to β-actin for TLR4 (a), Granzyme B (b), Perforin (c), TNFα (d) and IFNγ (e). Pre-stimulation of VIPER significantly inhibited the expression of all mediators while the inert peptide CP7 had no effect. (f) The graph shows percent CD8+ T cells expressing TLR4, Granzyme B, Perforin, TNFα and IFNγ proteins in the experimental set up. Bars represent the mean ± SEM. *p < 0.05, **p < 0.01, ***p < 0.001.

References

    1. Edwards CJ, Cooper C. Early environmental factors and rheumatoid arthritis. Clin Exp Immunol. 2006;143:1–5. doi: 10.1111/j.1365-2249.2005.02940.x. - DOI - PMC - PubMed
    1. Yarwood A, Huizinga TW, Worthington J. The genetics of rheumatoid arthritis: risk and protection in different stages of the evolution of RA. Rheumatology (Oxford). 2016;55:199–209. doi: 10.1093/rheumatology/keu323. - DOI - PMC - PubMed
    1. Gupta B, et al. Association of mannose-binding lectin gene (MBL2) polymorphisms with rheumatoid arthritis in an Indian cohort of case-control samples. J Hum Genet. 2005;50:583–591. doi: 10.1007/s10038-005-0299-8. - DOI - PubMed
    1. Agrawal C, et al. Tumor necrosis factor-alpha microsatellite polymorphism association with rheumatoid arthritis in Indian patients. Arch Med Res. 2005;36:555–9. doi: 10.1016/j.arcmed.2005.03.035. - DOI - PubMed
    1. Gupta B, Raghav SK, Das HR. S-nitrosylation of mannose binding lectin regulates its functional activities and the formation of autoantibody in rheumatoid arthritis. Nitric Oxide. 2008;18:266–73. doi: 10.1016/j.niox.2008.01.009. - DOI - PubMed