. 2017 Apr 27;544(7651):465-470.
doi: 10.1038/nature22051. Epub 2017 Apr 19.

Super-multiplex vibrational imaging

Affiliations

Super-multiplex vibrational imaging

Lu Wei et al. Nature. .

Abstract

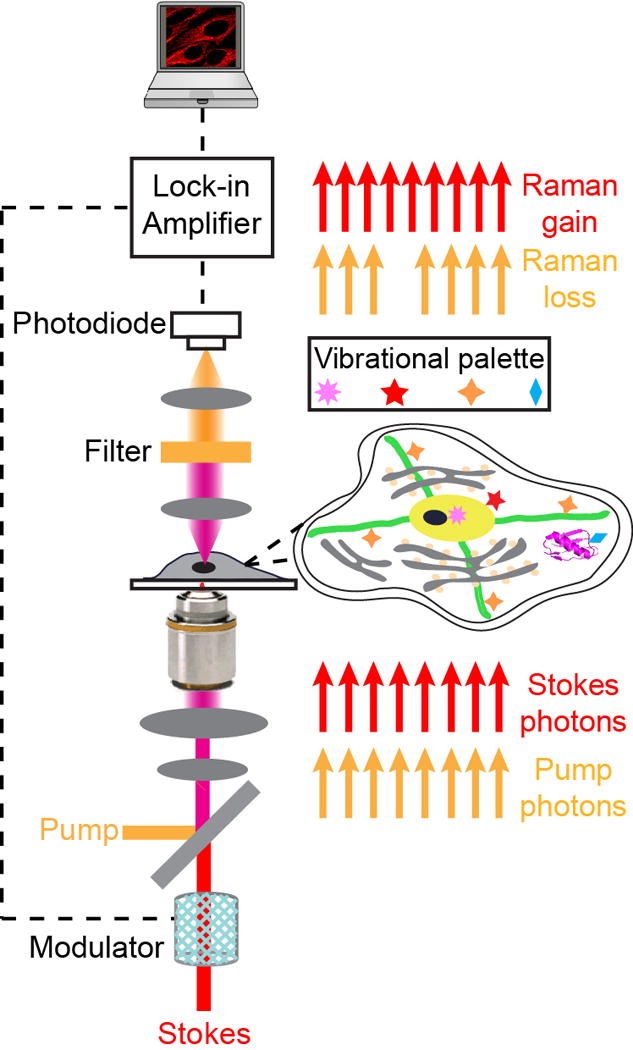
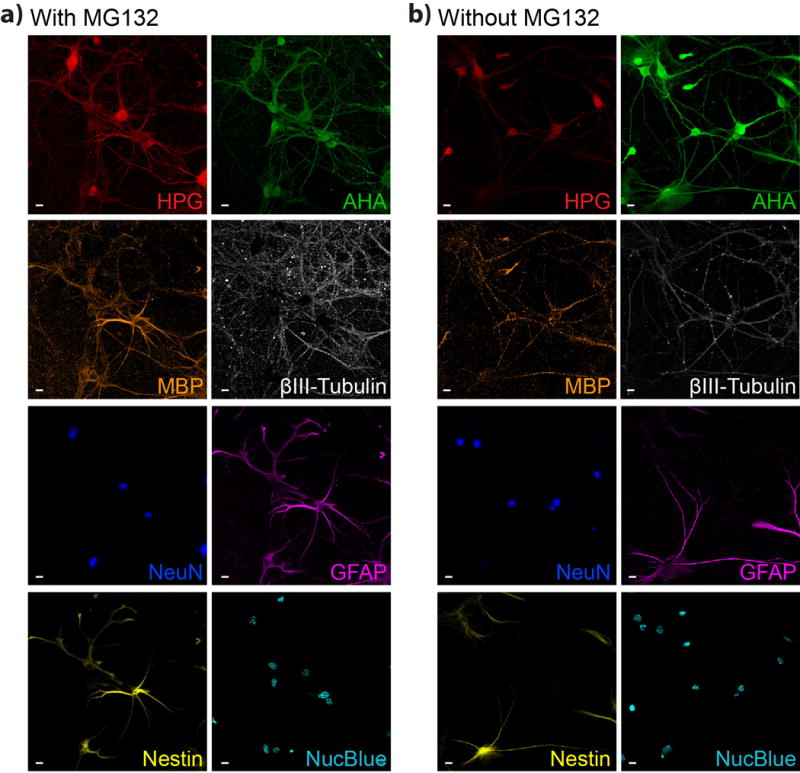
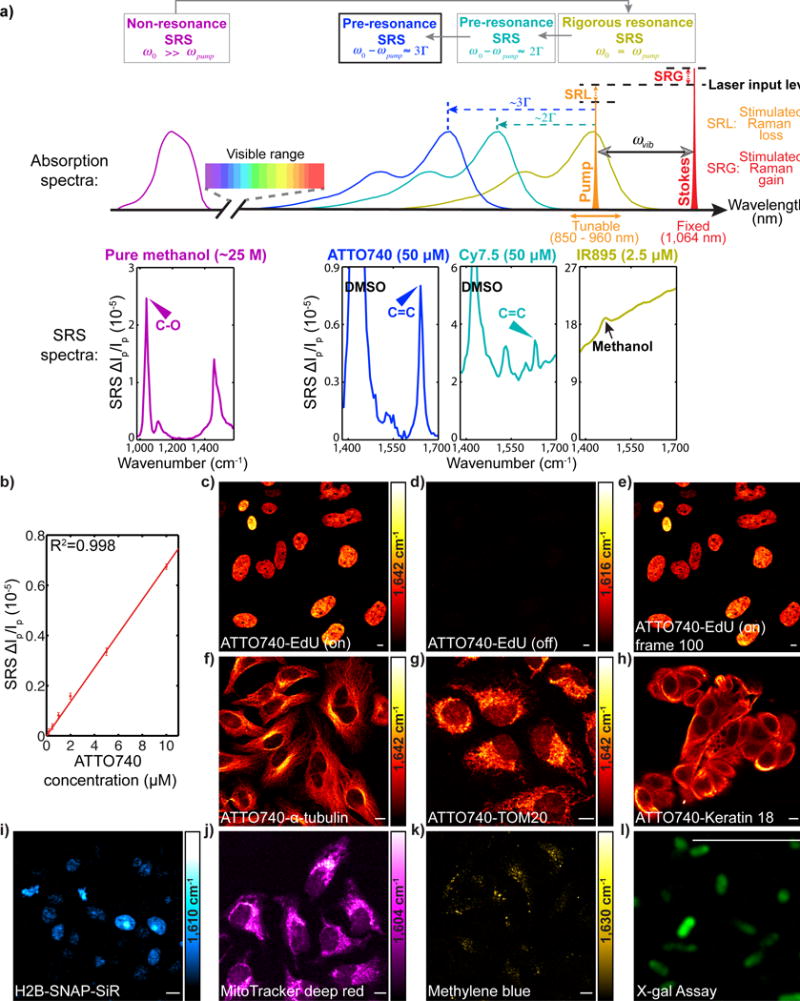
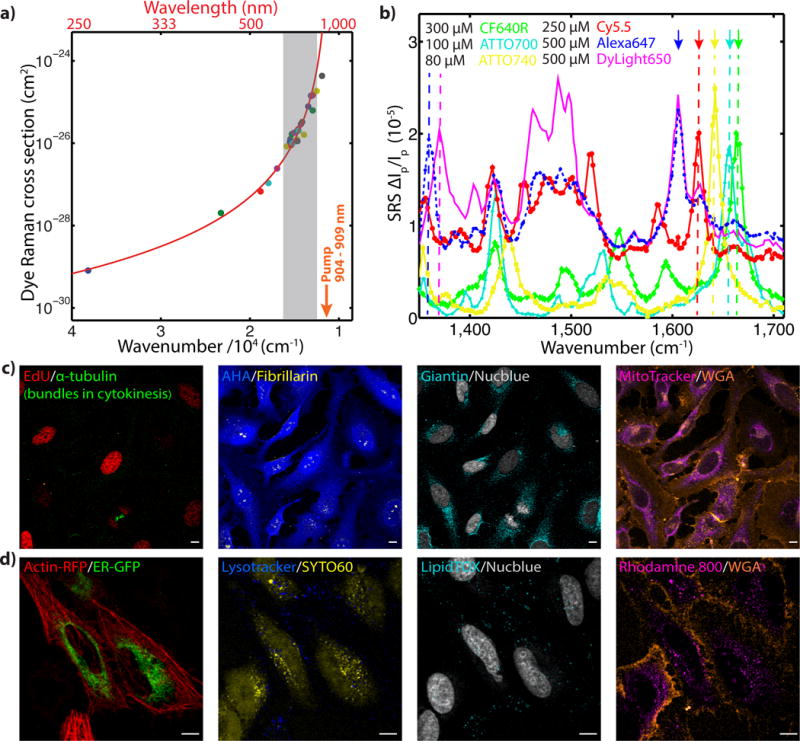
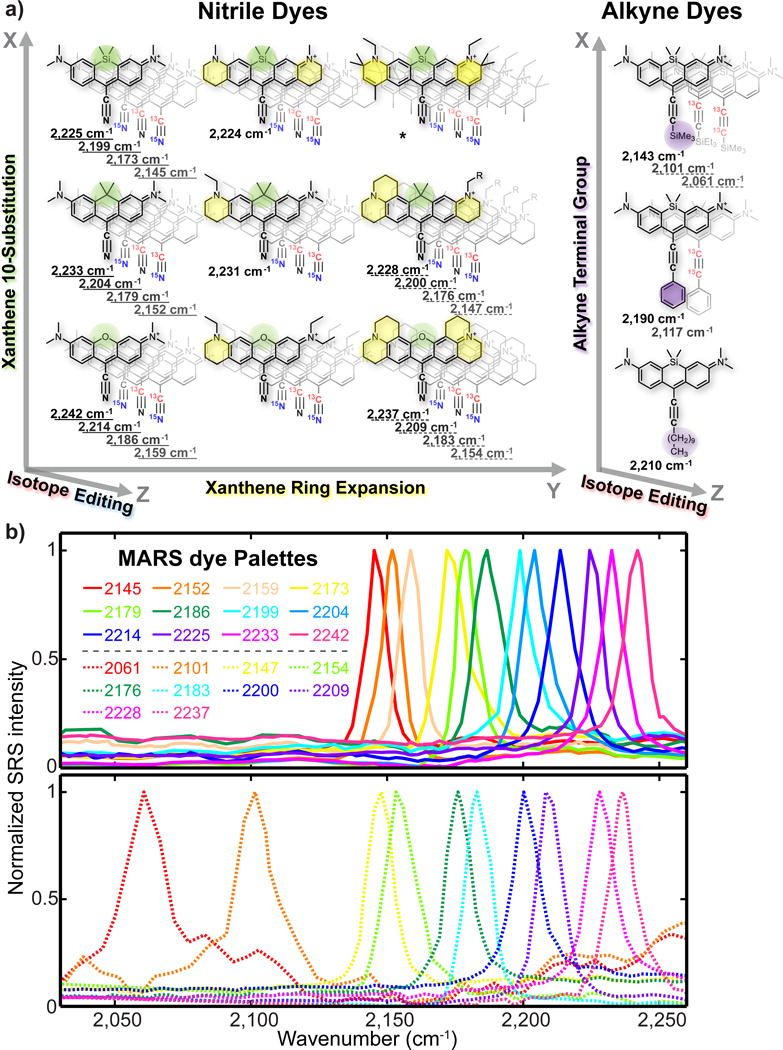
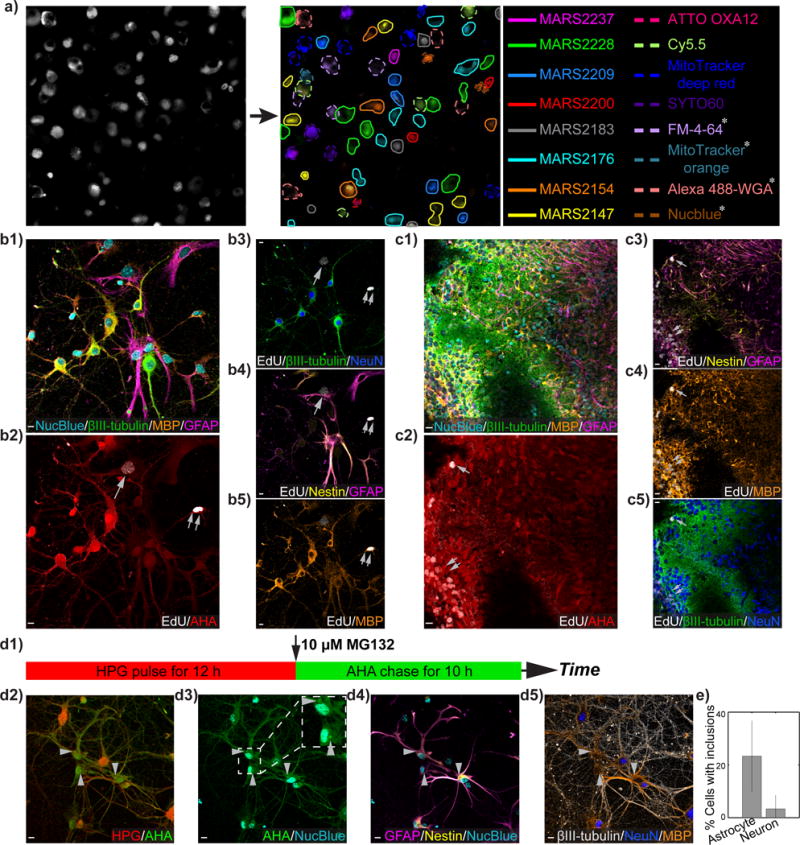
The ability to visualize directly a large number of distinct molecular species inside cells is increasingly essential for understanding complex systems and processes. Even though existing methods have successfully been used to explore structure-function relationships in nervous systems, to profile RNA in situ, to reveal the heterogeneity of tumour microenvironments and to study dynamic macromolecular assembly, it remains challenging to image many species with high selectivity and sensitivity under biological conditions. For instance, fluorescence microscopy faces a 'colour barrier', owing to the intrinsically broad (about 1,500 inverse centimetres) and featureless nature of fluorescence spectra that limits the number of resolvable colours to two to five (or seven to nine if using complicated instrumentation and analysis). Spontaneous Raman microscopy probes vibrational transitions with much narrower resonances (peak width of about 10 inverse centimetres) and so does not suffer from this problem, but weak signals make many bio-imaging applications impossible. Although surface-enhanced Raman scattering offers high sensitivity and multiplicity, it cannot be readily used to image specific molecular targets quantitatively inside live cells. Here we use stimulated Raman scattering under electronic pre-resonance conditions to image target molecules inside living cells with very high vibrational selectivity and sensitivity (down to 250 nanomolar with a time constant of 1 millisecond). We create a palette of triple-bond-conjugated near-infrared dyes that each displays a single peak in the cell-silent Raman spectral window; when combined with available fluorescent probes, this palette provides 24 resolvable colours, with the potential for further expansion. Proof-of-principle experiments on neuronal co-cultures and brain tissues reveal cell-type-dependent heterogeneities in DNA and protein metabolism under physiological and pathological conditions, underscoring the potential of this 24-colour (super-multiplex) optical imaging approach for elucidating intricate interactions in complex biological systems.


Figures

Extended Data Fig. 1
Extended Data Fig. 1. Apparatus of SRS microscopy
A narrow-band pump laser (6-ps pulse width) and an intensity modulated Stokes laser (fixed at 1064 nm, 6-ps pulse width) are both temporally and spatially synchronized before collinearly focused onto cells samples. When the energy difference between the pump photons and the Stokes photons matches with the vibrational frequency (ωvib) of the targeted chemical bonds, the chemical bonds are efficiently excited to the vibrational excited state. For each transition, a photon in the pump beam is annihilated (stimulated Raman loss) and a photon in the Stokes beam is created (stimulated Raman gain). A lock-in detection scheme is used to sensitively measure the intensity loss of the pump beam (i.e. stimulated Raman loss).
Extended Data Fig. 2
Extended Data Fig. 2. Sensitive epr-SRS imaging of ATTO740 labeled individual targets in HeLa, MCF7 and hippocampal neurons
(a) Corresponding fluorescence image of ATTO740-labeled 5-Ethynyl-2′-deoxyuridine (EdU) for newly synthesized DNA in the same cells as in Fig. 1c. (b) Representative epr-SRS images of ATTO740-labeled EdU through continuous 100 frame imaging. Frame numbers are indicated. Signal intensity curves are shown for imaging through 100 frames. The average photobleaching constant is determined to be 0.0003. (c) Epr-SRS imaging of ATTO740 immuno-labeled Giantin (Golgi membrane marker), Fibrillarin (nucleolar marker) in HeLa cells; alpha-tubulin and Neurofilament (Heavy, Neuronal Marker) in hippocampal neurons; and ATTO740 conjugated Wheat Germ Agglutinin (WGA), binded to membrane glycoproteins in live HeLa cells. (d) Epr-SRS imaging of ATTO740 immuno-labeled circulating tumor cell markers35: epithelial cell adhesion molecule (EpCAM); insulin-like growth factor 1 (IGF1) and CD44. Scale bar: 10 μm.
Extended Data Fig. 3
Extended Data Fig. 3. Chemical specificity comparison between Epr-SRS and fluorescence imaging
(a) On-resonance epr-SRS imaging of Alexa647 labeled EdU in HeLa cells at 1606 cm−1pump = 909 nm). (b) Off-resonance image at 1580 cm−1pump = 911 nm) of the same HeLa cells as in (a). (c-d) Two-photon fluorescence images of the same HeLa cells as in (a) at 810 nm (c) and 812 nm (d) around the two-photon excitation peak of Alexa647. (e) Absorption (solid) and emission (dashed) spectra for CF640R (green), Alexa647 (blue), DyLight650 (magenta), Cy5.5 (red), ATTO700 (cyan) and ATTO740 (yellow). Scale bar: 10 μm.
Extended Data Fig. 4
Extended Data Fig. 4. Quantitative epr-SRS and fluorescence imaging of non-overlaid images of Fig. 2c
Scale bar: 10 μm.
Extended Data Fig. 5
Extended Data Fig. 5. Minimum chemical-toxicity of MARS dyes for multicolor live-cell imaging (a-c) and photo-toxicity of SRS lasers (d-e)
(a) Control fluorescence images for live/dead cell viability assay for live HeLa cells (Calcein-AM, green, as live cell indicator) and fixed cells (EthD-1, red, as dead cell indicator). (b) Live/dead cell viability assay with 4 μM and 80 μM MARS2228 stained live cells did not reveal significant chemical toxicity and cell death. 4 μM concentration is the same as used for live-cell stains in Fig. 4a; and 80 μM with 20× concentration mimics the 20-color staining conditions. This test would lead to same results for MARS2200, MARS2176, MARS2147 due to the minimum chemical structural changes by isotopic editing. (c) Similar live/dead cell viability assay with 1× and 20× concentration stain by MARS2237. This test would lead to same results for MARS2209, MARS2183, MARS2154. (d) 12 continuous frames of SRS imaging targeting vibrational peak of CH3 (2940 cm−1) with the same laser power and dwell time used for multiplex live-cell imaging. (e) Fluorescence image of the same set of pre-imaged cells in (d) with live/dead cell viability assay did not show observable cell death or any cell viability loss when compared to the surrounding cells without pre-exposure to the SRS laser. Scale bar: 10 μm.
Extended Data Fig. 6
Extended Data Fig. 6. Photo-stability characterization for 10 representative epr-SRS dyes (including 8 MARS dyes) for live-cell imaging
The photobleaching percentage after 100 frames of SRS scans ranges from 4% to below 13%. Scale bar: 10 μm.
Extended Data Fig. 7
Extended Data Fig. 7. Linear unmixing on MARS solutions (a-b) and MARS dye stained cells (c-d)
(a) 3-channel epr-SRS images at 2159 cm−1, 2152 cm−1, 2145 cm−1 for 100 μM MARS2145; 1000 μM MARS2152, 300 μM MARS2159 before unmixing. (b) Images after linear unmixing with average readings of 94, 1097 and 315 in the unit of μM for MARS2145, MARS2152 and MARS2159. (c) Raw epr-SRS images for 3-color cell-mix after each stained with 1 μM MARS2237, 4 μM MARS2228, 1 μM MARS2209 separately before linear unmixing. (d) Images and their composite after linear unmixing.
Extended Data Fig 8
Extended Data Fig 8
8-color epr-SRS and fluorescence imaging of non-overlaid images of (a) hippocampal neuronal cultures in Fig. 4b; (b) Organotypic cerebellar brain slices in Fig. 4c. Scale bar: 10 μm.
Extended Data Fig. 9
8-color epr-SRS and fluorescence imaging of non-overlaid images of (a) hippocampal neuronal cultures treated with MG132 as in Fig. 4d. (b) Control set without MG132 treatment. Scale bar: 10 μm.
Fig. 1
Fig. 1. Electronic pre-resonance stimulated Raman scattering (epr-SRS) microscopy
(a) Spectroscopy of different SRS regimes, defined by the energy difference between molecular absorption peak (ω0) and pump laser (ωpump). Representative SRS spectra at each regime: pure methanol at non-resonance; IR895 at rigorous resonance (λabs ~ 900 nm, methanol); Cy7.5 at pre-resonance (λabs ~ 800 nm, DMSO); ATTO740 at pre-resonance (λabs ~ 760 nm, DMSO). C-O band in non-resonance and C=C bands in pre-resonance are arrow-headed. Solvent bands are marked. Γ is the homogeneous linewidth, ~ 700 cm−1. (b) Linear dependence of epr-SRS signals on ATTO740 concentrations (C=C at 1642 cm−1) under a 1-ms time constant. (c) Fast epr-SRS imaging of ATTO740 click-labeled 5-Ethynyl-2’-deoxyuridine (EdU) for newly synthesized DNA in HeLa cells. (d) Off-resonance image and (e) The 100th frame image for the same set of cells shown in (c). (f-l) Epr-SRS imaging of ATTO740 immuno-labeled α-tubulin (f), Tom20 (g) in HeLa cells and Keratin 18 (h) in MCF7 cells; SiR SNAP-tagged genetically encoded H2B proteins (i), MitoTracker deep red (j), methylene blue (k) in live HeLa cells; and oxidation product 4,4'-dichloro-5,5'-dibromoindigo from X-gal hydrolysis in E. coli (l). Scale bar: 10 μm.
Fig. 2
Fig. 2. Multiplex epr-SRS imaging with commercial dyes in fixed and live mammalian cells
(a) Semi-log plot of the measured Raman cross-sections for conjugated C=C of 28 organic dyes across a wide range of absorption peak energies (excited by λpump = 904 – 909nm). Grey-shaded area indicates the defined epr-SRS region. (b) Resolvable epr-SRS spectra of 6 commercial dyes (dash-lined): CF640R (1665 cm−1), ATTO700 (1657 cm−1), ATTO740 (1642 cm−1), Cy5.5 (1626 cm−1), Alexa647 (1606 cm−1, 1359 cm−1) and DyLight650 (1606 cm−1, 1370 cm−1). Occasional residual backgrounds (e.g. DyLight650) are likely from two-photon absorption. (c) 8-color epr-SRS (channels arrowed in b) and fluorescence imaging in fixed HeLa cells. Epr-SRS: EdU (newly synthesized DNA, Cy5.5, red), α-tubulin (bundles in cytokinesis, CF640R, green), Azidohomoalaine (AHA) (newly synthesized proteins, Alexa647, blue), Fibrillarin (nucleoli marker, ATTO740, yellow), Giantin (Golgi marker, ATTO700, cyan). Fluorescence: Nucblue (total DNA, gray), Wheat Germ Agglutinin (WGA) (Glycoproteins, Alexa488, orange); MitoTracker orange (mitochondria marker, magenta). (d) 8-color imaging in live Hela cells. Epr-SRS: Lysotracker (lysosome marker, blue), SYTO60 (nucleic acid stain, yellow), LipidTOX Deep Red (neutral lipid stain, cyan), WGA (Glycoproteins, ATTO740, orange), Rhodamine 800 (mitochondria marker, magenta). Fluorescence: Actin (RFP, red), endoplasmic reticulum (ER) (GFP, green), Nucblue (total DNA, gray). Scale bar: 10 μm.
Fig 3
Fig 3. MAnhattan Raman Scattering (MARS) dyes bearing π-conjugated, isotopically-edited and electronically fine-tuned triple bonds
(a) Design principles and structures for a library of epr-SRS nitrile and alkyne dyes. *Overwhelming background due to close electronic resonance. (b) Two sets of MARS palettes and their normalized epr-SRS spectra in the cell-silent window. The upper panel contains 12 MARS dyes, whose vibrational frequencies are indicated by numbers after solid lines and the corresponding structures are solid-underlined in (a). The lower panel contains 10 MARS dyes, whose vibrational frequencies are indicated by numbers after dashed lines and the corresponding structures are dash-underlined in (a).
Fig. 4
Fig. 4. Super-multiplex optical microscopy and its applications for probing metabolic activity in nervous systems under physiological and pathological conditions
(a) 16-color live-cell imaging with 8 MARS dyes, 4 commercial vibrational dyes in the fingerprint and 4 additional fluorescent dyes (star indicated). Each pre-stained cell in the cell mix (gray image, left) is circled with the matching line color and shape (16-color image, right) with the corresponding dye. (b-c) 8-color epr-SRS imaging of DNA replication and protein synthesis in hippocampal neuronal cultures (b1-b5) and organotypic cerebellar brain slices (c1-c5). (d1-d5) Pulse (HPG) – chase (AHA) imaging of proteome turnover dynamics in hippocampal neuronal cultures with proteasome inhibitor MG132 in the chase period, with the percentages of astrocyte and neuron cells that contain protein inclusions shown in (e). Error bars, mean±s.d based on imaging n=6 samples (see also methods), with P<0.01 determined using two-sided Student’s t-test. For labeling in b-c, Epr-SRS: βIII-tubulin (neurons, MARS2200, green in b-c; gray in d), Myelin basic protein (MBP) (oligodendrocytes, MARS2176, orange), Glial fibrillary acidic protein (GFAP) (astrocytes and neural stem cells, MARS2147, magenta), EdU (newly synthesized DNA, MARS2228, gray in b-c), HPG (proteins synthesized in pulse period, MARS2228, red in d), AHA (proteins synthesized in chase period, Alexa647, red in b-c; green in d). Fluorescence: Nucblue (total DNA, cyan), NeuN (neurons, Alexa568, blue), Nestin (neural stem cells and astrocytes, Alexa488, yellow). Scale bar: 10 μm.

Comment in

References

    1. Lichtman JW, Denk W. The big and the small: challenges of imaging the brain’s circuits. Science. 2011;334:618–623. - PubMed
    1. Chen KH, Boettiger AN, Moffitt JR, Wang S, Zhuang X. Spatially resolved, highly multiplexed RNA profiling in single cells. Science. 2015;348:6233. - PMC - PubMed
    1. Giesen C, et al. Highly multiplexed imaging of tumor tissues with subcellular resolution by mass cytometry. Nat Methods. 2014;11:417–422. - PubMed
    1. Shroff H, et al. Dual-color superresolution imaging of genetically expressed probes within individual adhesion complexes. Proc Natl Acad Sci USA. 2007;104:20308–20313. - PMC - PubMed
    1. Lakowicz JR. Principles of Fluorescence Spectroscopy. 3rd. Springer; 2011.

Publication types

MeSH terms