. 2017 Apr 27;544(7651):493-497.
doi: 10.1038/nature22076. Epub 2017 Apr 19.

SLAMF7 is critical for phagocytosis of haematopoietic tumour cells via Mac-1 integrin

Affiliations

SLAMF7 is critical for phagocytosis of haematopoietic tumour cells via Mac-1 integrin

Jun Chen et al. Nature. .

Abstract

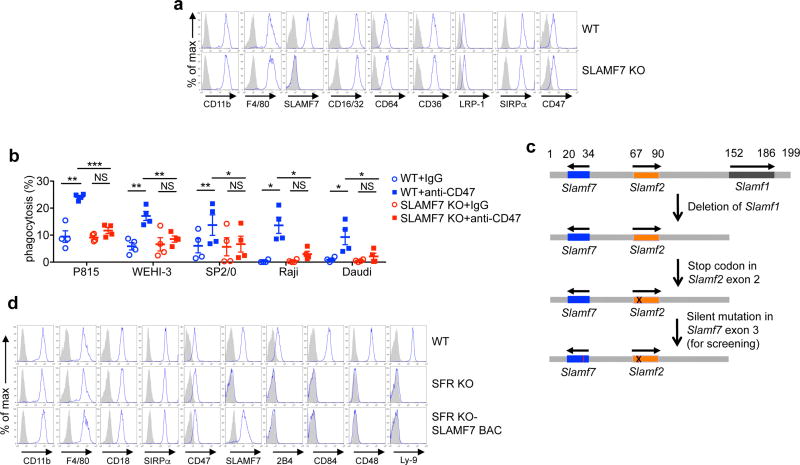
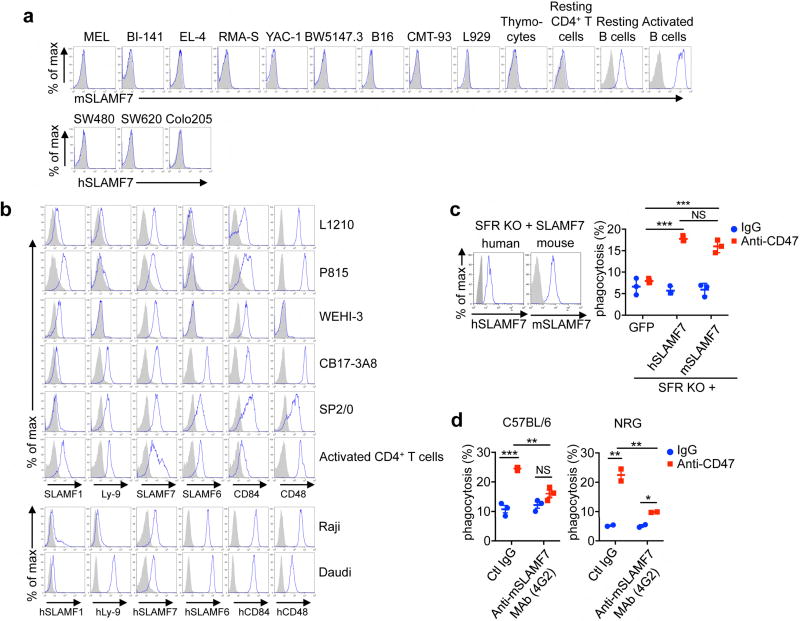
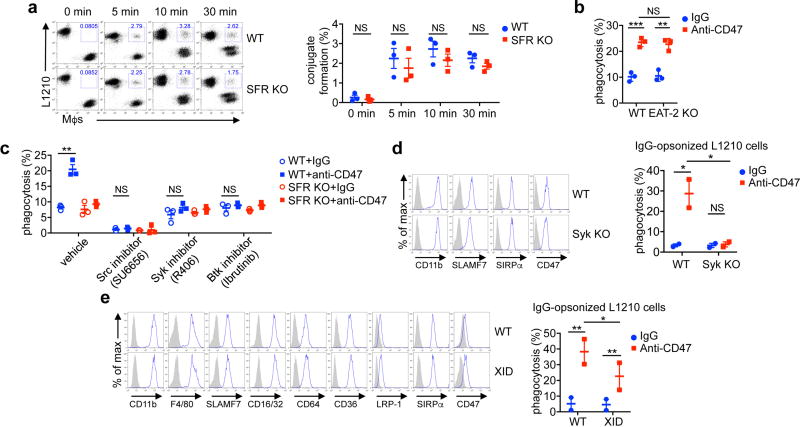
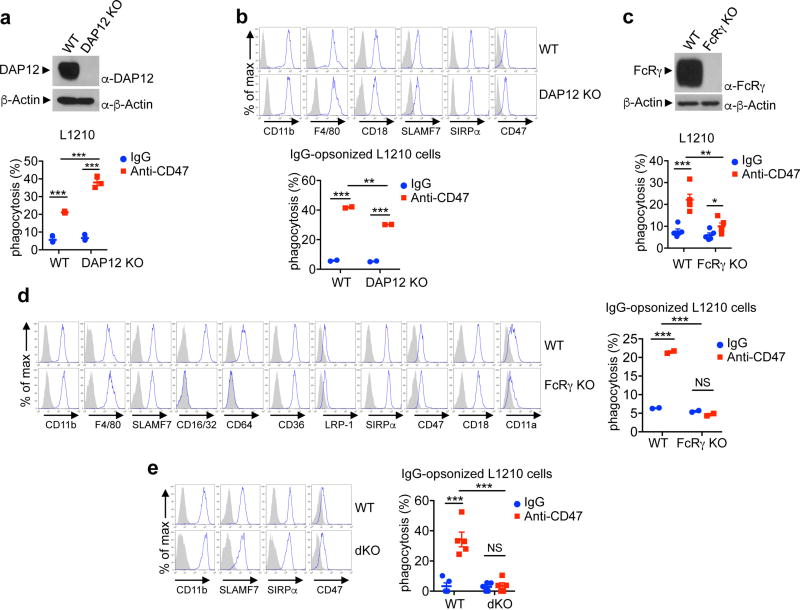
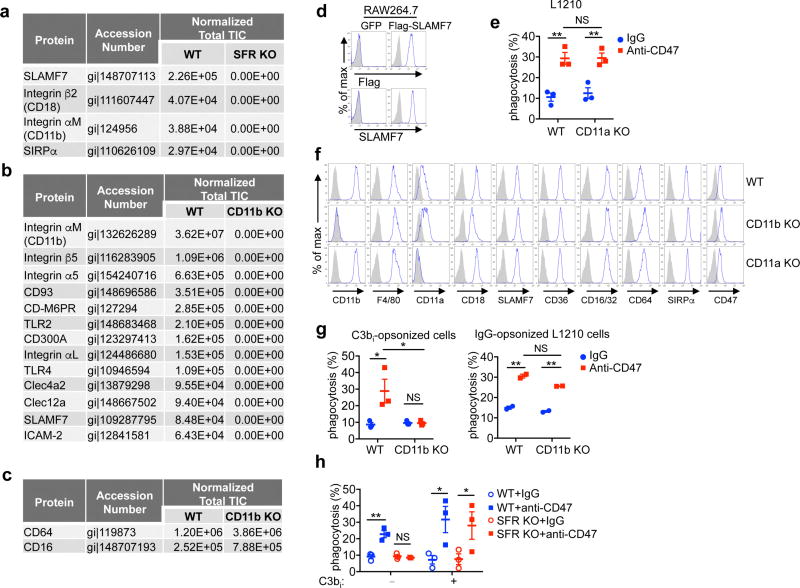
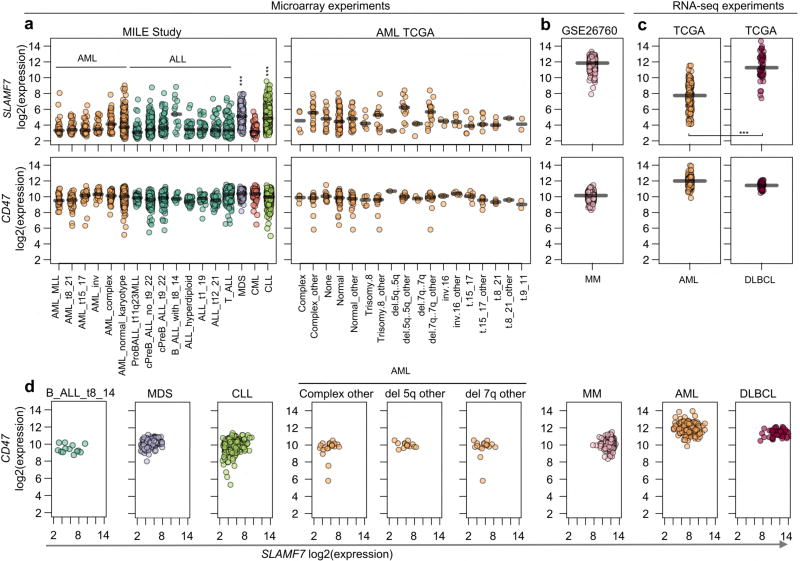
Cancer cells elude anti-tumour immunity through multiple mechanisms, including upregulated expression of ligands for inhibitory immune checkpoint receptors. Phagocytosis by macrophages plays a critical role in cancer control. Therapeutic blockade of signal regulatory protein (SIRP)-α, an inhibitory receptor on macrophages, or of its ligand CD47 expressed on tumour cells, improves tumour cell elimination in vitro and in vivo, suggesting that blockade of the SIRPα-CD47 checkpoint could be useful in treating human cancer. However, the pro-phagocytic receptor(s) responsible for tumour cell phagocytosis is(are) largely unknown. Here we find that macrophages are much more efficient at phagocytosis of haematopoietic tumour cells, compared with non-haematopoietic tumour cells, in response to SIRPα-CD47 blockade. Using a mouse lacking the signalling lymphocytic activation molecule (SLAM) family of homotypic haematopoietic cell-specific receptors, we determined that phagocytosis of haematopoietic tumour cells during SIRPα-CD47 blockade was strictly dependent on SLAM family receptors in vitro and in vivo. In both mouse and human cells, this function required a single SLAM family member, SLAMF7 (also known as CRACC, CS1, CD319), expressed on macrophages and tumour cell targets. In contrast to most SLAM receptor functions, SLAMF7-mediated phagocytosis was independent of signalling lymphocyte activation molecule-associated protein (SAP) adaptors. Instead, it depended on the ability of SLAMF7 to interact with integrin Mac-1 (refs 18, 19, 20) and utilize signals involving immunoreceptor tyrosine-based activation motifs. These findings elucidate the mechanism by which macrophages engulf and destroy haematopoietic tumour cells. They also reveal a novel SAP adaptor-independent function for a SLAM receptor. Lastly, they suggest that patients with tumours expressing SLAMF7 are more likely to respond to SIRPα-CD47 blockade therapy.


Figures

Extended Data Figure 1
Extended Data Figure 1. Phagocytosis assays and direct impact of anti-CD47 on target cells
a, b, Same as Fig. 1b, except phagocytosis assessed by flow cytometry using Tac-expressing L1210 (a) or pHrodo dye (b). Mϕs, macrophages. c, Cell death (in the absence of added macrophages) was examined by staining with annexin V and propidium iodide (PI), and flow cytometry. d, Cell proliferation was studied by CFSE dilution and flow cytometry. MFI, mean fluorescence intensity. e, Ca2+ fluxes were analysed using the Ca2+ indicator dye Indo-1, and flow cytometry. Ionomycin served as positive control. Time of addition of stimuli is shown by arrow. f, Protein tyrosine phosphorylation was detected by anti-phosphotyrosine (pTyr) immunoblotting. Representative of four (a), three (b–d), and two (e, f) independent experiments. Uncropped blots can be seen in Supplementary Fig. 1.
Extended Data Figure 2
Extended Data Figure 2. Cell-surface receptors on target cells
a, Expression of CD47 (blue lines); prefixes m, mouse; h, human. Filled curves, isotype controls. b, c, Expression of LRP-1 in BMDMs from LRP-1 KO mice (Lrp1fl/fl;Lys2-Cre) and mice expressing Lys2-Cre alone (as control) was verified by immunoblot (b), while phagocytosis was determined as detailed for Fig. 1d (c). *P < 0.05; **P < 0.01 (two-tailed Student’s t-tests). Results pooled from a total of three (L1210) and two (P815) independent mice (c). Each symbol represents one mouse. All data are means ± s.e.m. Flow cytometry profiles are representative of five (L1210, P815, CB17-3A8, WEHI-3, SP2/0, activated CD4+ T cells, Raji, Daudi), three (MEL, BI-141, EL-4, RMA-S, YAC-1, BW5147.3, B16, CMT-93, L929, thymocytes, resting CD4+ T cells, resting B cells, activated B cells), and two (SW480, SW620, Colo205) experiments (a). Immunoblots are representative of one experiment (deletion of the LRP-1-encoding gene was shown by genotyping in three experiments (data notshown)) (b). Uncropped blots can be seen in Supplementary Fig. 1.
Extended Data Figure 3
Extended Data Figure 3. SLAM receptors are required for phagocytosis of haematopoietic cells, but not of other targets
a, Expression of various cell surface markers, including SLAM receptors (blue lines). Filled curves, isotype controls. b, Phagocytosis analysed as detailed for Extended Data Fig. 1a, b, using a flow cytometry-based assay (top) or the pHrodo-based assay (bottom). Left, representative experiments; right, quantification. c, Same as Fig. 1d, using peritoneal macrophages. d, Expression of CD47 (blue lines) on parental and CD47 KO L1210 cells. Filled curves, isotype controls. e, Phagocytosis of IgG-containing immune complexes (I.C.), GFP-expressing E. coli, or IgG-opsonized sRBCs was examined by flow cytometry (blue lines). Filled curves, BMDMs in the absence of phagocytosis. Phagocytosis of apoptotic thymocytes was analysed using microscopy-based assay. f, Phagocytosis of RBCs from WT or CD47 KO mice (mRBCs) was analysed by microscopy. g, Phagocytosis of IgG-opsonized L1210 was analysed. *P < 0.05; **P < 0.01 (two-tailed Student’s t-tests). Results pooled from a total of four (top) and three (bottom) (b), three (left) and two (right) (c), three (e, g), and two (f) mice in independent experiments. Each symbol represents one mouse. All data are means ± s.e.m. Flow cytometry profiles are representative of four (a) and three (d; e, left) independent experiments.
Extended Data Figure 4
Extended Data Figure 4. Tumour transplantation assays
a, b, From the experiment depicted in Fig. 2e. Cells were analysed by flow cytometry, in the presence of a fixed number of fluorescent beads to allow quantitation of total cell numbers. Beads are boxed in R1, while L1210 are boxed in R2 (a). Numbers of peritoneal macrophages were determined (b). c, Schematic representation of the experiment presented in Fig. 2f. TG, thioglycollate. d, e, From experiment depicted in Fig. 2f. Cells were analysed as specified for a and b. f, g, Tumours from experiment depicted in Fig. 2g were dissected, weighed, measured, and analysed by flow cytometry. Two RAG-1 KO mice treated with anti-CD47 (mice 9 and 10) showed no clinically detectable tumour when alive. However, upon dissection, small nodules with no detectable mass on the scale were present. These nodules were processed and analysed as for the other tumours. Masses are denoted as ‘0’ in the Source Data. L1210 were GFP+; macrophages were Ly6GCD11b+NK1.1; neutrophils were Ly6G+CD11b+NK1.1; and NK cells were Ly6GCD11b+NK1.1+. *P < 0.05; **P < 0.01; ***P < 0.001 (two-tailed Student’s t-tests). Results pooled from a total of six mice analysed in five independent experiments (b), two mice (e), or 11 mice in two of four independent experiments (f, g). Each symbol represents one mouse. All data are means ± s.e.m. Dot plots are representative of six (a) or two (d) independent mice. See Source Data.
Extended Data Figure 5
Extended Data Figure 5. Impact of SLAMF7 on phagocytosis
a, Expression of various cell surface markers, including SLAMF7 (blue lines). Filled curves, isotype controls. b, Phagocytosis was tested as detailed in Fig. 1d. For human targets (Raji, Daudi), F(ab′)2 fragments of antibodies were used. c, BAC transgenic mice expressing SLAMF7 were generated as detailed in Methods. In brief, the C57BL/6 BAC clone was first truncated at the 3′ end to eliminate the Slamf1 gene. Then, a stop codon (denoted by ‘X’) was introduced in exon 2 of Slamf2, the gene coding for CD48, and a silent mutation (HindIII site; denoted by short vertical red line) was created in Slamf7 to allow screening of transgenic mice. The transcriptional orientation of the Slam genes is depicted by arrows, while the relative positions of the genes in the clone are indicated by their distances from the 5′ end (in kilobases). d, Expression of various cell surface markers, including SLAMF7 (blue lines). Filled curves, isotype controls. *P < 0.05; **P < 0.01; ***P < 0.001 (two-tailed Student’s t-tests). Results pooled from a total of four mice studied in independent experiments (b). Each symbol represents one mouse. All data are means ± s.e.m. Flow cytometry profiles are representative of four (a) and three (d) independent experiments.
Extended Data Figure 6
Extended Data Figure 6. Expression of SLAMF7 on target cells
a, b, Expression of various cell surface markers, including SFRs and their ligands (blue lines); prefixes m, mouse; h, human. Filled curves, isotype controls. c, Phagocytosis of L1210 by SFR KO macrophages expressing GFP alone or with SLAMF7 (human or mouse). Left, representative flow cytometry analysis; right, quantification. d, Phagocytosis of L1210 by macrophages from WT C57BL/6 or NRG mice, in the presence of anti-mSLAMF7 monoclonal antibody 4G2 or control rat IgG. Results pooled from a total of three (c), and three (C57BL/6) or two (NRG) (d) independent mice. Each symbol represents one mouse. All data are means ± s.e.m. Flow cytometry profiles are representative of three (MEL, BI-141, EL-4, RMA-S, YAC-1, BW5147.3, B16, CMT-93, L929, thymocytes, resting CD4+ T cells, resting B cells, activated B cells) or two (SW480, SW620, Colo205) (a), and four (b) independent experiments.
Extended Data Figure 7
Extended Data Figure 7. Mechanism of action of SLAMF7
a, Formation of conjugates (boxed) between macrophages and L1210 was detected by flow cytometry. Left, representative experiment. The percentages of conjugate formation are indicated above the boxes. Right, quantification. b, Same as Fig. 1d, using EAT-2 KO macrophages and L1210. c, Same as Fig. 1d, using WT or SFR KO macrophages and L1210, in the presence of kinase inhibitors. d, e, Expression of various cell surface markers (blue lines); filled curves, control antibodies. Phagocytosis of IgG-opsonized L1210 was analysed as detailed for Extended Data Fig. 3g. *P < 0.05; **P < 0.01; ***P < 0.001 (two-tailed Student’s t-tests). Results pooled from a total of three (a–c) or two (d, e) mice studied in independent experiments. Each symbol represents one mouse. All data are means ± s.e.m. Flow cytometry profiles representative of two independent experiments (d, left; e, left).
Extended Data Figure 8
Extended Data Figure 8. Impact of FcRγ and DAP12 on phagocytosis
a–e, Same as Fig. 1d and Extended Data Fig. 3g, using macrophages from DAP12 KO (a, b), FcRγ KO (c, d), or dKO (e) mice and L1210. a, c, Top, representative anti-DAP12 and anti-FcRγ immunoblots. **P < 0.01; ***P < 0.001 (two-tailed Student’s t-tests). Results pooled from a total of three (a, bottom), two (b, bottom; d, right; e, right), and five (c, bottom) mice studied in independent experiments. Each symbol represents one mouse. All data are means ± s.e.m. Flow cytometry profiles are representative of two independent experiments (b, top; d, left; e, left). Uncropped blots can be seen in Supplementary Fig. 1.
Extended Data Figure 9
Extended Data Figure 9. Influence of integrins on phagocytosis
a, Mass spectrometry analysis of anti-SLAMF7 immunoprecipitates. The GenInfo Identifier (gi) accession number and means of the normalized total ion current (TIC) for the potential interactors are shown. b, Same as a, except that CD11b was immunoprecipitated. c, Same as b, except that the data for FcRs CD64 and CD16 are shown. d, Expression of SLAMF7 and Flag (blue lines); filled curves, isotype control antibodies. e, Phagocytosis of L1210 was analysed as detailed for Fig. 1d. f, Expression of various cell surface markers (blue lines); filled curves, isotype control antibodies. g, h, Phagocytosis of L1210 opsonized with C3bi or IgG was analysed as detailed for Extended Data Fig. 3g. *P < 0.05; **P < 0.01 (two-tailed Student’s t-tests). Results pooled from two experiments with a total of five (a) or six (b, c) immunoprecipitates from independent mice, or three (e, g, h) independent experiments. Each symbol represents one mouse. All data are means ± s.e.m. Flow cytometry profiles are representative of four (d) or three (f) independent experiments.
Extended Data Figure 10
Extended Data Figure 10. Gene expression analyses of SLAMF7 and CD47
Expression of SLAMF7 and CD47 RNA in human haematological tumours. a, RNA levels of SLAMF7 (top) and CD47 (bottom) in several types and subtypes of leukaemia were analysed, using data obtained from microarray experiments. Data for only one oligonucleotide probe are shown. However, similar findings were made with other SLAMF7 and CD47 probes (data not shown). Each symbol represents a different patient sample. Median expression for a given type or subtype of malignancy is depicted by a horizontal line. For statistical analysis, Student’s t-tests were performed comparing SLAMF7 expression in the combination of all acute myelogenous leukaemia (AML) and acute lymphocytic leukaemia (ALL), versus either myelodysplastic syndrome (MDS) or chronic lymphocytic leukaemia (CLL). CML, chronic myelogenous leukaemia. b, Same as a, except that samples of multiple myeloma (MM) were analysed. c, Same as a, except that samples of acute myelogenous leukaemia and diffuse large B-cell lymphoma (DLBCL) were studied. Moreover, RNA expression was quantitated by RNA sequencing. d, Levels of SLAMF7 and CD47 RNAs for individual samples from selected tumour types, which displayed higher levels of SLAMF7 RNA, were analysed in parallel using dot plots. ***P < 0.001. The values of n, from left to right, are (a) MILE Study: 38, 41, 37, 28, 48, 352, 70, 237, 122, 13, 40, 36, 58, 174, 206, 76, 448; AML TCGA: 4, 20, 16, 91, 27, 6, 14, 1, 14, 3, 17, 3, 5, 7, 7, 6, 1, 2; (b) multiple myeloma: 304; (c) TCGA AML: 173; TCGA diffuse large B-cell lymphoma: 48; (d) 13, 206, 448, 20, 14, 17, 304, 173, 48.
Figure 1
Figure 1. Macrophages phagocytose a subset of haematopoietic cells
a, Phagocytosis assay. Ctrl, control. b, Phagocytosis (arrows) of L1210 (green) was assessed by fluorescence microscopy. Scale bars, 50 µm. c, Same as b, except using confocal microscopy. Macrophages, red; targets, green. Arrow, non-phagocytosed cell. Scale bars, 5 µm. d, Same as b, using various mouse haematopoietic tumour cell lines as targets. e, Same as d, using F(ab′)2 fragments of antibodies. f, Same as d, using peritoneal macrophages. g, Same as d, using other mouse targets. NS, not significant. h, Same as d, using human targets. i, Same as d, using normal mouse haematopoietic target cells. *P < 0.05; **P < 0.01; ***P < 0.001 (two-tailed Student’s t-tests). Results pooled from five (L1210, P815, WEHI-3), three (CB17–3A8), or four (SP2/0) (d), three (e, i), two (f), three (MEL, BI-141, BW5147.3), or four (EL-4, RMA-S, YAC-1, B16, CMT-93, L929) (g), and four (h) mice studied in independent experiments. Each symbol represents one mouse. All data are means ± s.e.m. Photographs are representative of six (b) or two (c) independent experiments. See also Extended Data Figs 1 and 2.
Figure 2
Figure 2. SLAM receptors are required for phagocytosis of haematopoietic cells
a, Same as Fig. 1d, using macrophages from WT or SFR KO mice. b, Same as a, using human targets. c, Same as Fig. 1e, using SFR KO macrophages. d, Phagocytosis of parental or CD47 KO L1210. e, Intraperitoneal tumour clearance assay using L1210 cells. f, Same as e, except WT mice were injected with liposomes containing clodronate or phosphate-buffered saline (PBS). g, Growth of L1210 injected subcutaneously in RAG-1 KO or RAG-1 SFR dKO mice. D, day. *P <0.05; **P <0.01; ***P <0.001; ****P <0.0001 (two-tailed Student’s t-tests). Results pooled from a total of eight (L1210), six (P815), seven (WEHI-3) or five (CB17–3A8, SP2/0) (a), five (b, d), three (c), and two (f) mice studied in independent experiments; six mice from five independent experiments (e); and 11 mice from two of four independent experiments (g). Each symbol represents one mouse. For g, bar graphs represent mean volumes. All data are means ± s.e.m. See also Extended Data Figs 3 and 4 and Source Data for this figure are available in the online version of the paper.
Figure 3
Figure 3. SLAMF7 is necessary and sufficient for phagocytosis of haematopoietic cells
a, Same as Fig. 1d, using macrophages lacking individual SFRs and L1210. b, c, Same as Fig. 1d (b) and Fig. 2e (c), using macrophages from SFR KO mice reconstituted with Slamf7 bacterial artificial chromosome (BAC) transgene and L1210. d, Expression of SLAMF7 (blue lines); prefixes m, mouse; h, human. Filled curves: isotype controls. e, Phagocytosis of activated WT or SLAMF7 KO CD4+ T cells by WT macrophages. f, Residual WT and SLAMF7 KO CD4+ T cells in blood of WT mice. Left, representative dot plot; right, quantification. g, Phagocytosis of Raji cells by human monocytes/macrophages, in the presence of anti-hSLAMF7 162 or control IgG. *P < 0.05; **P < 0.01; ***P < 0.001 (two-tailed Student’s t-tests). Results pooled from a total of eight (SLAMF7 KO) or three (all other KO mice) (a) and three (b, c, e) mice studied in independent experiments; six mice in three experiments (f); and three healthy human donors studied in one experiment (g). Each symbol represents one mouse or healthy donor. All data are means ± s.e.m. Flow cytometry profiles are representative of six independent experiments (d). See also Extended Data Figs 5 and 6 and Source Data for this figure are available in the online version of the paper.
Figure 4
Figure 4. SLAMF7 controls actin polarization and promotes phagocytosis independently of SAP adaptors
a, Conjugate formation (left) and phagocytosis (right) of L1210 by macrophages. b, Actin polarization (arrows) in macrophages incubated with L1210 detected by immunofluorescence. Left, representative examples of fully polarized and non-polarized conjugates. Right, quantitation from a total of 130 conjugates in three experiments. Scale bars, 5 µm. c, Same as Fig. 1d, using SFR KO macrophages expressing green fluorescent protein (GFP) alone or in combination with WT or Y→ F mSLAMF7, and L1210. Left, expression of SLAMF7 was determined by flow cytometry; right, quantification. Blue lines, anti-SLAMF7; filled curves, control antibodies. d, e, Same as Fig. 1d, using macrophages from Syk KO (d) or X-linked immunodeficient (e) mice, and L1210. Representative anti-Syk immunoblot is shown in d (left). **P < 0.01; ***P < 0.001 (two-tailed Student’s t-tests). Results pooled from a total of four (a, left), three (a, right), three (b), five (c), or four (d, e) independent mice studied in independent experiments. Each symbol represents one mouse. In b, bars represent mean numbers of conjugates with fully polarized actin. All data are means ± s.e.m. Uncropped blots can be seen in Supplementary Fig. 1. See also Extended Data Fig. 7.
Figure 5
Figure 5. SLAMF7-dependent phagocytosis requires ITAMs and Mac-1
a, Same as Fig. 1d, using macrophages from FcRγ-DAP12 dKO mice and L1210. Left, representative anti-FcRγ and anti-DAP12 immunoblots; right, quantification. b, Co-immunoprecipitation of SLAMF7 and CD11b (Mac-1) in RAW264.7 expressing GFP alone or with Flag-tagged SLAMF7 (Flag–SLAMF7). IP, immunoprecipitation. c, Co-localization of SLAMF7 and CD11b in RAW264.7 cells expressing GFP alone or with Flag– SLAMF7 assessed by immunofluorescence. Two examples of conjugates for each cell type are shown at top and bottom. Scale bars, 5 µm. d, Same as Fig. 1d, using WT macrophages incubated with antibodies against integrins or control IgG. e, Same as Fig. 1d, using CD11b KO macrophages and L1210. **P < 0.01; ***P < 0.001 (two-tailed Student’s t-tests). Results pooled from a total of three (a, d) or five (e) mice studied in independent experiments. Each symbol represents one mouse. All data are means ± s.e.m. Immunoblots (b) and photographs (c) are representative of five and three independent experiments, respectively. Uncropped blots can be seen in Supplementary Fig. 1. See also Extended Data Figs 8 and 9.

References

    1. Korman AJ, Peggs KS, Allison JP. Checkpoint blockade in cancer immunotherapy. Adv. Immunol. 2006;90:297–339. - PMC - PubMed
    1. Sharma P, Allison JP. Immune checkpoint targeting in cancer therapy: toward combination strategies with curative potential. Cell. 2015;161:205–214. - PMC - PubMed
    1. Arandjelovic S, Ravichandran KS. Phagocytosis of apoptotic cells in homeostasis. Nat. Immunol. 2015;16:907–917. - PMC - PubMed
    1. Gordon S, Plüddemann A, Martinez Estrada F. Macrophage heterogeneity in tissues: phenotypic diversity and functions. Immunol. Rev. 2014;262:36–55. - PMC - PubMed
    1. Schultze JL, Schmidt SV. Molecular features of macrophage activation. Semin. Immunol. 2015;27:416–423. - PubMed

Publication types

MeSH terms