Gray Matter Atrophy Is Primarily Related to Demyelination of Lesions in Multiple Sclerosis: A Diffusion Tensor Imaging MRI Study
- PMID: 28424595
- PMCID: PMC5372801
- DOI: 10.3389/fnana.2017.00023
Gray Matter Atrophy Is Primarily Related to Demyelination of Lesions in Multiple Sclerosis: A Diffusion Tensor Imaging MRI Study
Abstract
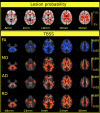
Objective: Cortical pathology, periventricular demyelination, and lesion formation in multiple sclerosis (MS) are related (Hypothesis 1). Factors in the cerebrospinal fluid close to these compartments could possibly drive the parallel processes. Alternatively, the cortical atrophy could be caused by remote axonal transection (Hypothesis 2). Since MRI can differentiate between demyelination and axon loss, we used this imaging modality to investigate the correlation between the pattern of diffusion parameter changes in the periventricular- and deep white matter and the gray matter atrophy. Methods: High-resolution T1-weighted, FLAIR, and diffusion MRI images were acquired in 52 RRMS patients and 50 healthy, age-matched controls. We used EDSS to estimate the clinical disability. We used Tract Based Spatial Statistics to compare diffusion parameters (fractional anisotropy, mean, axial, and radial diffusivity) between groups. We evaluated global brain, white, and gray matter atrophy with SIENAX. Averaged, standard diffusion parameters were calculated in four compartment: periventricular lesioned and normal appearing white matter, non-periventricular lesioned and normal appearing white matter. PLS regression was used to identify which diffusion parameter and in which compartment best predicts the brain atrophy and clinical disability. Results: In our diffusion tensor imaging study compared to controls we found extensive alterations of fractional anisotropy, mean and radial diffusivity and smaller changes of axial diffusivity (maximal p > 0.0002) in patients that suggested demyelination in the lesioned and in the normal appearing white matter. We found significant reduction in total brain, total white, and gray matter (patients: 718.764 ± 14.968, 323.237 ± 7.246, 395.527 ± 8.050 cm3, controls: 791.772 ± 22.692, 355.350 ± 10.929, 436.422 ± 12.011 cm3; mean ± SE), (p < 0.015; p < 0.0001; p < 0.009; respectively) of patients compared to controls. The PLS analysis revealed a combination of demyelination-like diffusion parameters (higher mean and radial diffusivity in patients) in the lesions and in the non-lesioned periventricular white matter, which best predicted the gray matter atrophy (p < 0.001). Similarly, EDSS was best predicted by the radial diffusivity of the lesions and the non-lesioned periventricular white matter, but axial diffusivity of the periventricular lesions also contributed significantly (p < 0.0001). Interpretation: Our investigation showed that gray matter atrophy and white matter demyelination are related in MS but white matter axonal loss does not significantly contribute to the gray matter pathology.
Keywords: brain atrophy; demyelination; multiple sclerosis; normal-appearing white matter; periventricular white matter.
Figures


Similar articles
-
Quantitative MRI of the spinal cord and brain in adrenomyeloneuropathy: in vivo assessment of structural changes.Brain. 2016 Jun;139(Pt 6):1735-46. doi: 10.1093/brain/aww068. Epub 2016 Apr 11. Brain. 2016. PMID: 27068048
-
In vivo characterization of cortical and white matter neuroaxonal pathology in early multiple sclerosis.Brain. 2017 Nov 1;140(11):2912-2926. doi: 10.1093/brain/awx247. Brain. 2017. PMID: 29053798 Free PMC article.
-
The Contribution of Various MRI Parameters to Clinical and Cognitive Disability in Multiple Sclerosis.Front Neurol. 2019 Jan 23;9:1172. doi: 10.3389/fneur.2018.01172. eCollection 2018. Front Neurol. 2019. PMID: 30728801 Free PMC article.
-
Diffusion-weighted MR of the brain: methodology and clinical application.Radiol Med. 2005 Mar;109(3):155-97. Radiol Med. 2005. PMID: 15775887 Review. English, Italian.
-
The role of diffusion tensor imaging and fractional anisotropy in the evaluation of patients with idiopathic normal pressure hydrocephalus: a literature review.Neurosurg Focus. 2016 Sep;41(3):E12. doi: 10.3171/2016.6.FOCUS16192. Neurosurg Focus. 2016. PMID: 27581308 Review.
Cited by
-
Myalgic encephalomyelitis or chronic fatigue syndrome: how could the illness develop?Metab Brain Dis. 2019 Apr;34(2):385-415. doi: 10.1007/s11011-019-0388-6. Epub 2019 Feb 13. Metab Brain Dis. 2019. PMID: 30758706 Free PMC article. Review.
-
The Impact of HIV on Early Brain Aging-A Pathophysiological (Re)View.J Clin Med. 2024 Nov 21;13(23):7031. doi: 10.3390/jcm13237031. J Clin Med. 2024. PMID: 39685490 Free PMC article. Review.
-
Contributing factors to health-related quality of life in multiple sclerosis.Brain Behav. 2019 Dec;9(12):e01466. doi: 10.1002/brb3.1466. Epub 2019 Nov 11. Brain Behav. 2019. PMID: 31709732 Free PMC article.
-
Assessing Repair in Multiple Sclerosis: Outcomes for Phase II Clinical Trials.Neurotherapeutics. 2017 Oct;14(4):924-933. doi: 10.1007/s13311-017-0558-3. Neurotherapeutics. 2017. PMID: 28695472 Free PMC article. Review.
-
Ethnoracial disparities in gray matter atrophy are mediated by structural disconnectivity in multiple sclerosis.Ann Clin Transl Neurol. 2025 Mar;12(3):615-630. doi: 10.1002/acn3.52311. Epub 2025 Feb 17. Ann Clin Transl Neurol. 2025. PMID: 39957675 Free PMC article.
References
-
- Andersson J. L. R., Jenkinson M., Smith S. (2007). Non-linear Optimisation. (Oxford: FMRIB technical report; ).
LinkOut - more resources
Full Text Sources
Other Literature Sources

