Review
. 2017 Mar 25;9(2):103-118.
doi: 10.1007/s12551-017-0262-x. eCollection 2017 Apr.

Catalytic robustness and torque generation of the F1-ATPase

Affiliations
Review

Catalytic robustness and torque generation of the F1-ATPase

Hiroyuki Noji et al. Biophys Rev. .

Abstract

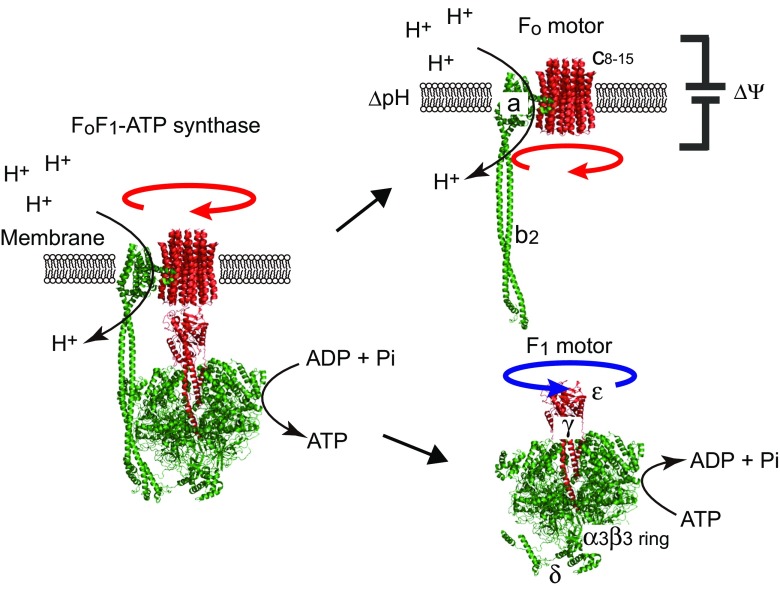
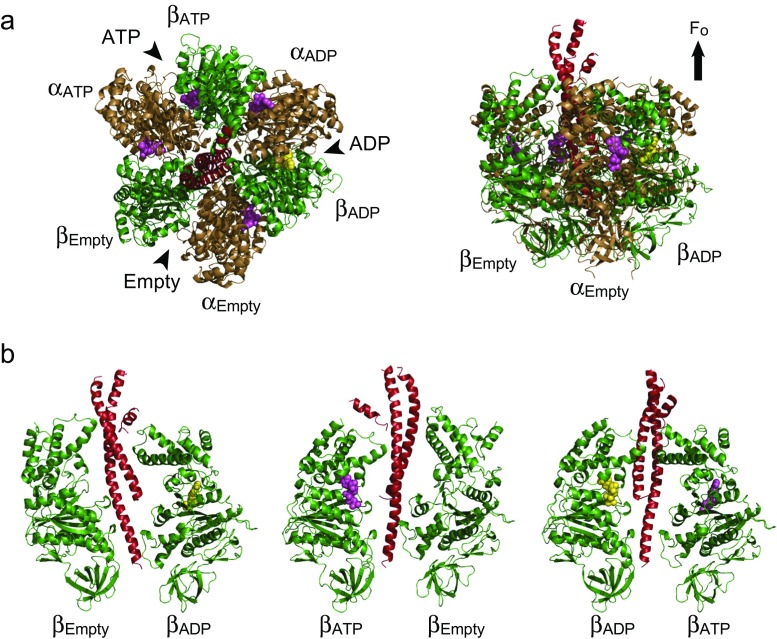
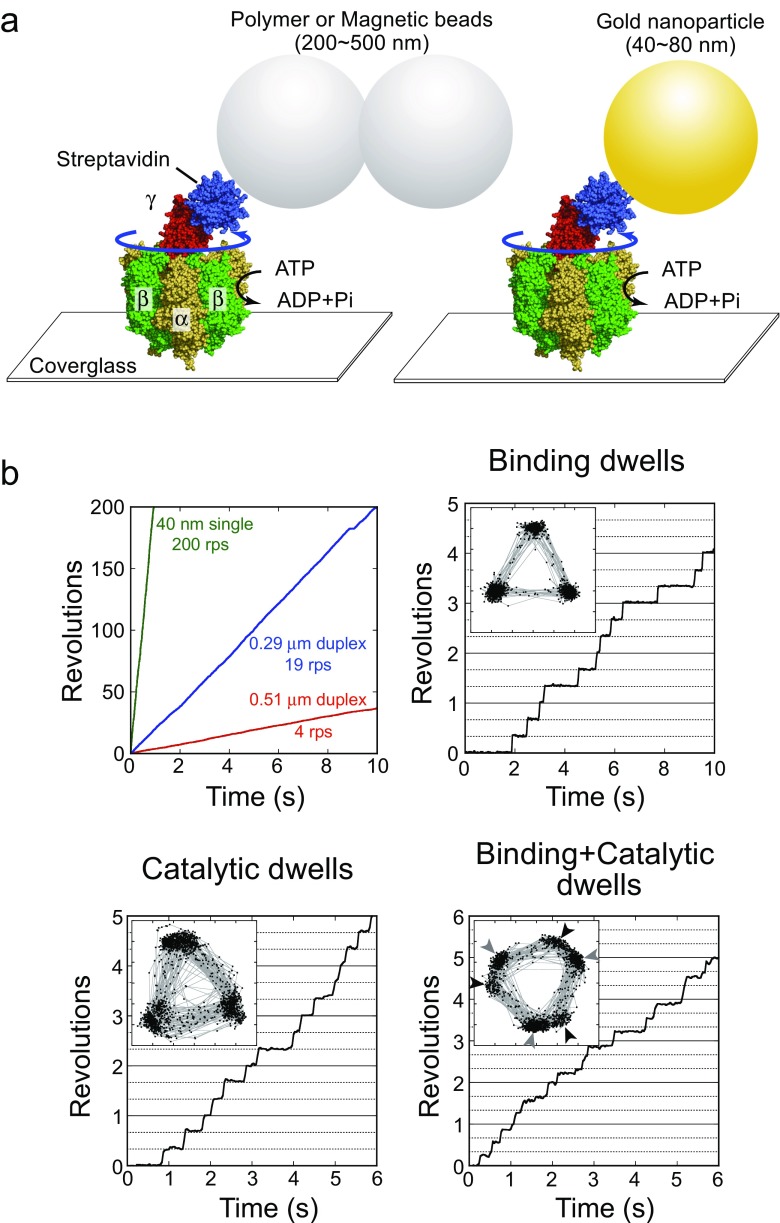
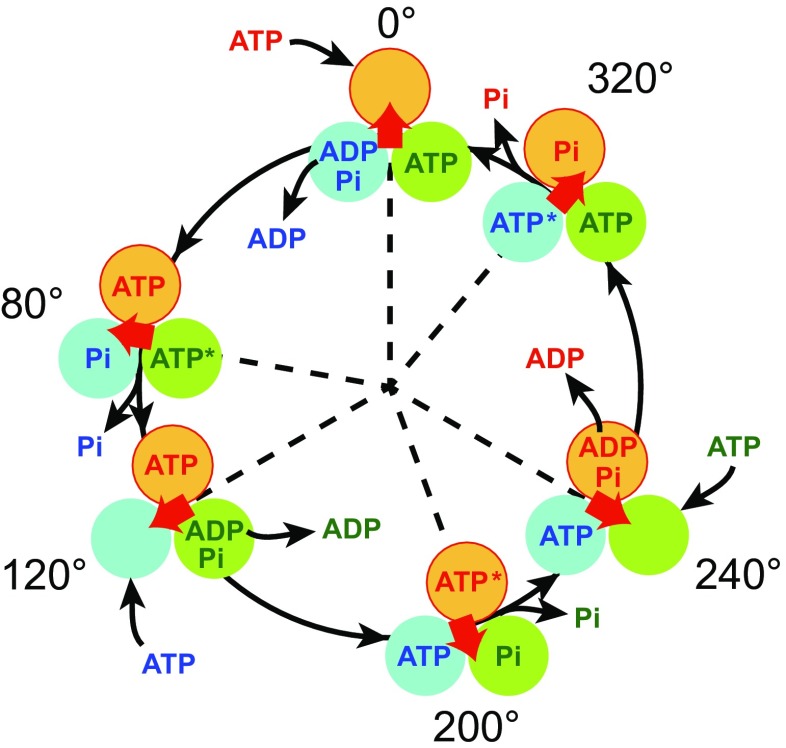
The F1-ATPase is the catalytic portion of the FoF1 ATP synthase and acts as a rotary molecular motor when it hydrolyzes ATP. Two decades have passed since the single-molecule rotation assay of F1-ATPase was established. Although several fundamental issues remain elusive, basic properties of F-type ATPases as motor proteins have been well characterized, and a large part of the reaction scheme has been revealed by the combination of extensive structural, biochemical, biophysical, and theoretical studies. This review is intended to provide a concise summary of the fundamental features of F1-ATPases, by use of the well-described model F1 from the thermophilic Bacillus PS3 (TF1). In the last part of this review, we focus on the robustness of the rotary catalysis of F1-ATPase to provide a perspective on the re-designing of novel molecular machines.

Keywords: ATP synthase; F1-ATPase; Molecular motor; Single-molecule techniques.


Conflict of interest statement

Conflict of interest

Hiroyuki Noji declares that he has no conflicts of interest. Hiroshi Ueno declares that he has no conflicts of interest. Duncan G. G. McMillan declares that he has no conflicts of interest.

Ethical approval

This article does not contain any studies with human participants or animals performed by any of the authors.

Figures

Fig. 1
Fig. 1
Two rotary motors of FoF1-ATP synthase. Schematic models of the FoF1-ATP synthase. The structural models of FoF1 (PDB ID: 5T4O) (Sobti et al. 2016) are shown as cartoon representation. The rotor and stator parts are shown in red and green, respectively. The FoF1-ATP synthase is composed of two tethered rotary motors, Fo and F1, each driven by two different fuels. The subunit composition of bacterial F1 and Fo are α3β3γδε and ab 2 c x (where x is the copy number of c subunits, which varies from 8 to 15 in different species), respectively. The membrane-embedded Fo motor rotates the c-ring (rotor) against the ab 2 (stator), clockwise when viewed from the membrane side, which is driven by pmf consisting of membrane potential (ΔΨ) and proton concentration gradient (ΔpH). The F1 is an ATP-driven rotary motor in which the γ subunit (rotor) rotates against the α3β3-ring (stator). The ε subunit binds to the protruding part of the γ subunit. The δ binds to the bottom of the α3β3-ring. Note that the rotational direction of F1 is opposite to that of Fo. In the whole complex of FoF1, Fo reverses the rotation of F1, leading to ATP synthesis from ADP and Pi
Fig. 2
Fig. 2
Crystal structures of F1. The crystal structures of F1 from bovine mitochondria (PDB ID: 1BMF) (Abrahams et al. 1994) are shown in cartoon diagrams as a top view from the membrane side (a, left) and as a side view (a, right and b). a The α, β, and γ subunits are shown in dark yellow, green, and red, respectively. The bound AMP-PNP and ADP are shown in magenta and yellow, respectively. The catalytic sites are located at the interfaces between α and β subunits (black arrowheads), which are mainly harbored by the β subunits. Each carries AMP-PNP, ADP, or none. Therefore, each β subunit catalytic site at any one point in time is designated as βATP, βADP, or βEmpty, respectively. The non-catalytic sites are located at the other interfaces, all of which are occupied with AMP-PNP. Each α subunit forming a catalytic site is designated as αATP, αADP, or αEmpty, respectively. The protruding part of the γ subunit is directed toward the Fo side. b Three β–β pairs with different nucleotide states are shown with the γ subunit. Both α and β subunits are composed of the N-terminal domain, nucleotide-binding domain, and C-terminal domain (from bottom to top). βEmpty takes an open conformation, and both βATP and βADP take a closed conformation with bound nucleotide. The C-terminal domain of the closed β subunit appears to push the γ subunit
Fig. 3
Fig. 3
Rotation assay of F1. a A schematic image of the single-molecule rotation assay. The structural models of F1 (PDB ID: 1E79) (Gibbons et al. 2000) and streptavidin (PDB ID: 1N43) (Le Trong et al. 2003) are shown as sphere representation. The F1-ATPase α3β3-ring is immobilized on a glass surface, and an optical probe (fluorescently labeled actin filament, polymer beads, gold nanoparticle, gold nanorod, etc.) is attached to the γ subunit to visualize the rotary motion of γ subunit by an optical microscope. b Top left panel shows the time courses of rotation with various probe sizes under saturating ATP conditions (1∼5 mM ATP). The top right panel represents the time course of rotation of wild-type F1 under an ATP-limiting condition (60 nM ATP), where the dwell is caused by slow ATP binding. The inset shows the trajectory of the centroid of the optical probe. The bottom left panel shows the time course of rotation of a mutant F1 (βE190D) (Shimabukuro et al. 2003) under a saturating ATP condition (2 mM ATP). Each dwell is caused by the slow catalysis by the mutant F1. The bottom right panel shows the time course of rotation of a mutant F1 (βE190D) around the K m region (2 μM ATP). In this condition, the 120° step splits into 0° and 80° substeps, each intervened with a binding dwell and catalytic dwell, respectively. The black and gray arrowheads indicate the positions of ATP binding and catalytic dwell, respectively
Fig. 4
Fig. 4
Proposed chemomechanical coupling scheme of TF1. Each circle represents the chemical state of the catalytic site in each β subunit. ATP* represents pre- or post-hydrolysis state of ATP. The central red arrow represents the orientation of the γ subunit. 0° is defined as the ATP binding angle for the catalytic site at the 12 o’clock position (orange). In this model, ATP bound at 0° is cleaved into ADP and Pi at 200°, ADP dissociates at 240°, and then phosphate release occurs at 320°. Other catalytic sites (blue and green) also obey the same reaction scheme offset by 120° and 240°
Fig. 5
Fig. 5
Stator–rotor interactions within F1. a αEmpty–βATP pair and the γ subunit are shown as cartoon representation (PDB ID: 1E79). The blue and red circles indicate the orifice and sleeve regions in the α3β3-ring, respectively, at which the γ subunit is held. The helix-turn-helix (HTH) structure of the β subunit forming the main interface of the stator orifice is colored blue. b The structure of axle-less mutant γΔN22C43 (Furuike et al. 2008). The 22 residues of the N-terminal helix and the 43 residues of the C-terminal helix in the γ subunit are deleted. c The positions of deletion in the HTH structure are shown in red (Usukura et al. 2012). d All residues of the HTH in contact with the γ subunit are substituted with glycine or alanine (red region) (Tanigawara et al. 2012)
Fig. 6
Fig. 6
High-speed atomic force microscopy (HS-AFM) imaging of the isolated α3β3-ring. a Averaged AFM image without nucleotide when observed from the C-terminal side. The red arrows indicate β subunits showing an open conformation (Uchihashi et al. 2011). b Averaged AFM image at 1 mM AMP-PNP. The blue arrows indicate the β subunits showing a closed conformation. c Successive HS-AFM images showing conformational change of the β subunits at 2 μM ATP (left-to-right and top-to-bottom). The red circles indicate the highest pixel in each image. The frame rate of imaging is 12.5/s. d Time course of the cumulated number of counterclockwise shifts of the CCO state. The black circles, crosses, and pluses represent CCO, COO, and other irregular states, respectively
Fig. 7
Fig. 7
Rotation of F1-FliJ chimera. a Sequence alignment of FliJ and F1-γ subunit. The amino acid sequences of F1-γ from thermophilic Bacillus PS3 (PS3-γ), Escherichia coli (Eco-γ), and bovine mitochondria (Bov-γ) were aligned using ClustalW. The FliJ sequence (Sen-J, PDB ID: 3AJW) and Bov-γ (PDB ID: 1E79) were structurally aligned using the MATRAS server due to the low sequence similarity between them (Baba et al. 2016). The conserved residues are highlighted in red (identical) or pink (strong similarity). b Left panel shows the structure model of F1-FliJ chimera. αEmpty–βATP pair (PDB ID: 1E79) and FliJ (cyan, PDB ID: 3AJW) are shown as cartoon representations. The linker portion is represented by an orange line. The right panel shows the time courses of rotation of F1 (black lines) and F1-FliJ chimera (cyan lines). c Structural alignment of FliJ and V1-D or F1-γ subunit. FliJ (cyan, PDB ID: 3AJW) was superimposed on the D subunit of V1 (yellow, PDB ID: 3W3A) or the γ subunit of F1 (orange, PDB ID: 4XD7) using the MATRAS server. Root-mean-square deviations (RMSDs) between FliJ and the D subunit of V1 or γ subunit of F1 are 3.2 Å or 4.4 Å, respectively
Fig. 8
Fig. 8
Two-step ATP binding model. The upper and lower panels show the conformational states of the β subunit and the chemical states in the binding pocket during ATP binding and subsequent torque generation. The ATP-binding process consists of two steps (first docking and second induced fit). The first docking process is triggered by the recognition of the base portion of ATP, and the subsequent induced-fit process is triggered by the recognition of the phosphate portion, which contributes to the torque generation (Arai et al. 2014)

Similar articles

Cited by

References

    1. Abrahams JP, Leslie AG, Lutter R, Walker JE. Structure at 2.8 a resolution of F1-ATPase from bovine heart mitochondria. Nature. 1994;370:621–628. doi: 10.1038/370621a0. - DOI - PubMed
    1. Abrahams JP, Buchanan SK, Van Raaij MJ, Fearnley IM, Leslie AG, Walker JE. The structure of bovine F1-ATPase complexed with the peptide antibiotic efrapeptin. Proc Natl Acad Sci U S A. 1996;93:9420–9424. doi: 10.1073/pnas.93.18.9420. - DOI - PMC - PubMed
    1. Adachi K, Oiwa K, Nishizaka T, Furuike S, Noji H, Itoh H, Yoshida M, Kinosita K. Coupling of rotation and catalysis in F(1)-ATPase revealed by single-molecule imaging and manipulation. Cell. 2007;130:309–321. doi: 10.1016/j.cell.2007.05.020. - DOI - PubMed
    1. Ahmad Z, Senior AE. Involvement of ATP synthase residues αArg-376, βArg-182, and βLys-155 in Pi binding. FEBS Lett. 2005;579:523–528. doi: 10.1016/j.febslet.2004.12.022. - DOI - PubMed
    1. Ahmadian MR, Stege P, Scheffzek K, Wittinghofer A. Confirmation of the arginine-finger hypothesis for the GAP-stimulated GTP-hydrolysis reaction of Ras. Nat Struct Biol. 1997;4:686–689. doi: 10.1038/nsb0997-686. - DOI - PubMed

LinkOut - more resources