. 2017 Nov;222(8):3615-3637.
doi: 10.1007/s00429-017-1422-2. Epub 2017 Apr 19.

The integrity of the nucleus of the lateral olfactory tract is essential for the normal functioning of the olfactory system

Affiliations

The integrity of the nucleus of the lateral olfactory tract is essential for the normal functioning of the olfactory system

Ricardo P Vaz et al. Brain Struct Funct. 2017 Nov.

Abstract

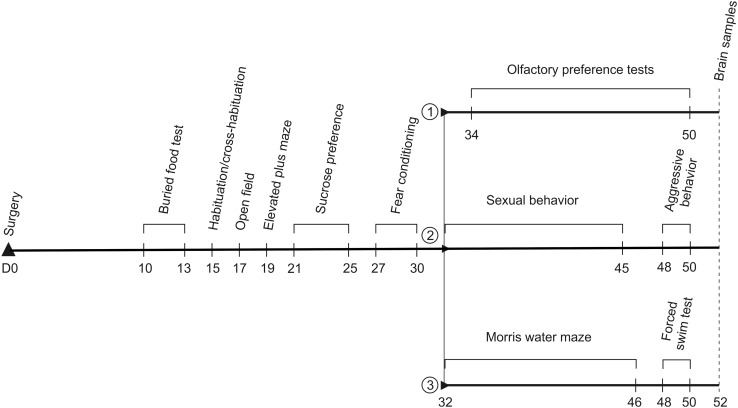
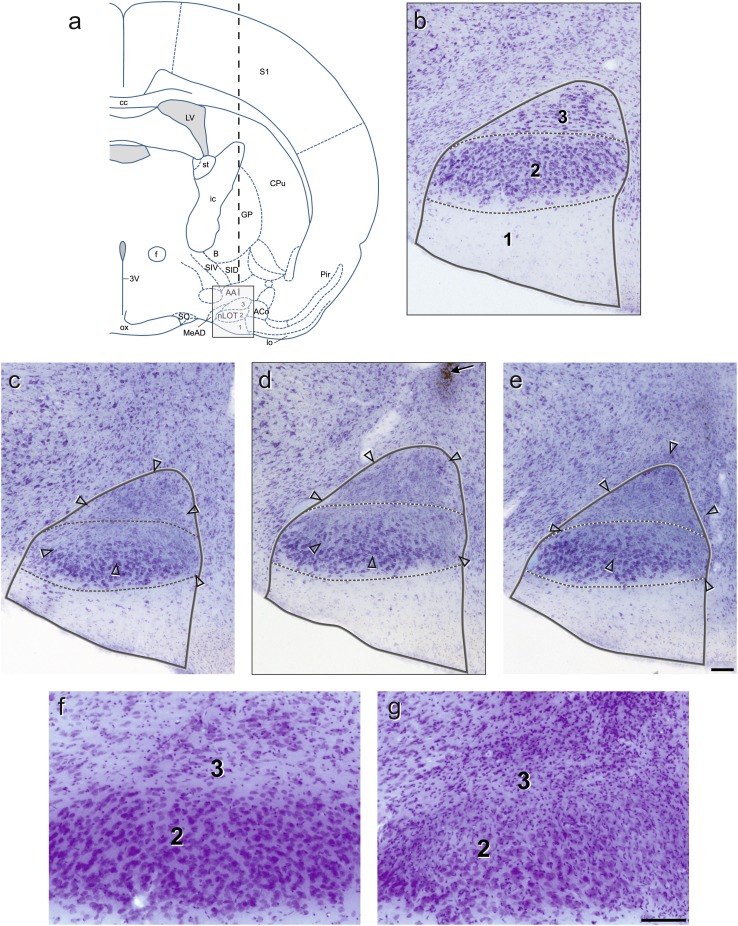
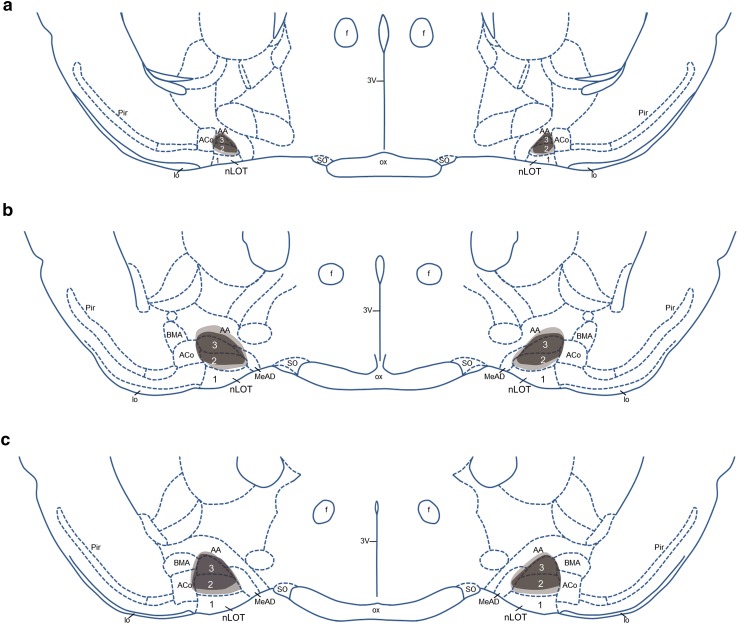
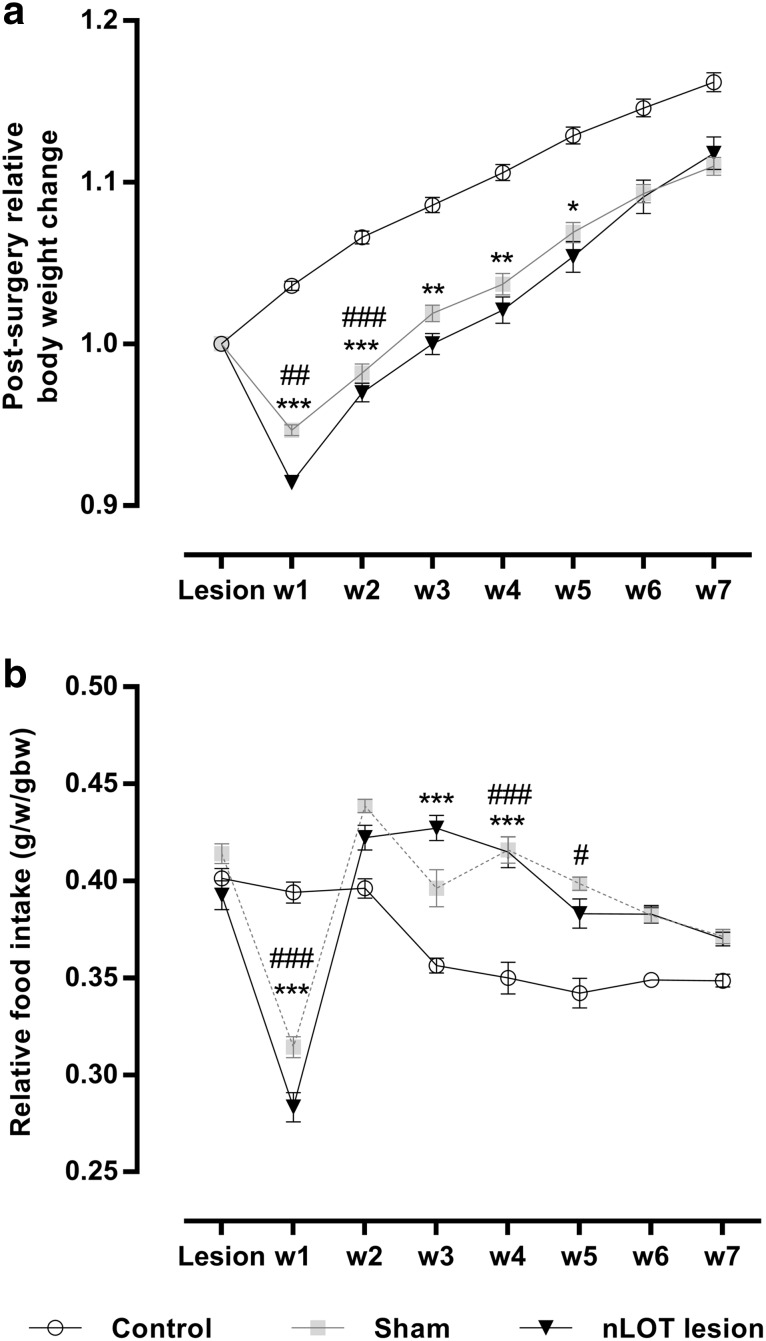
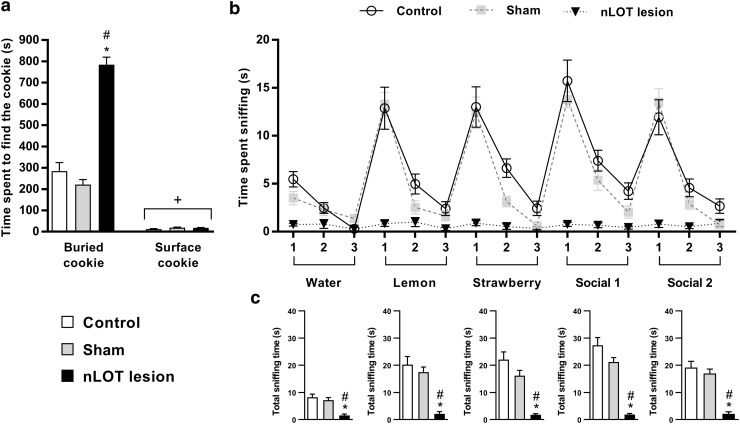
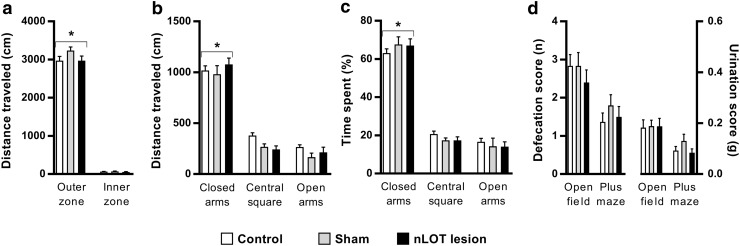
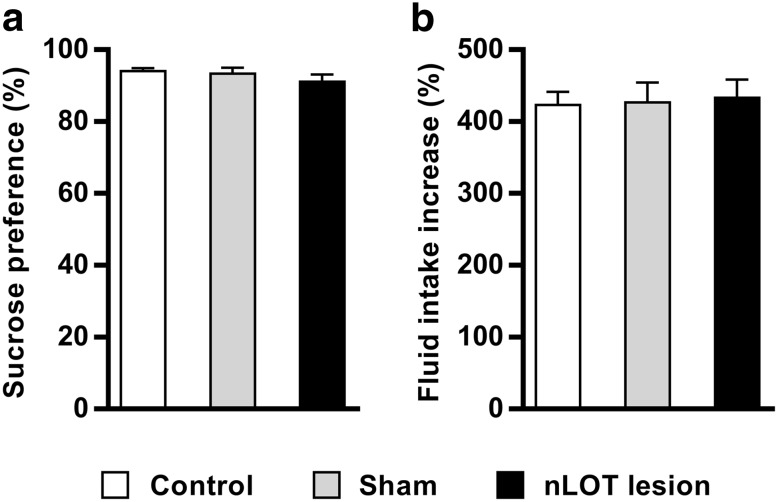
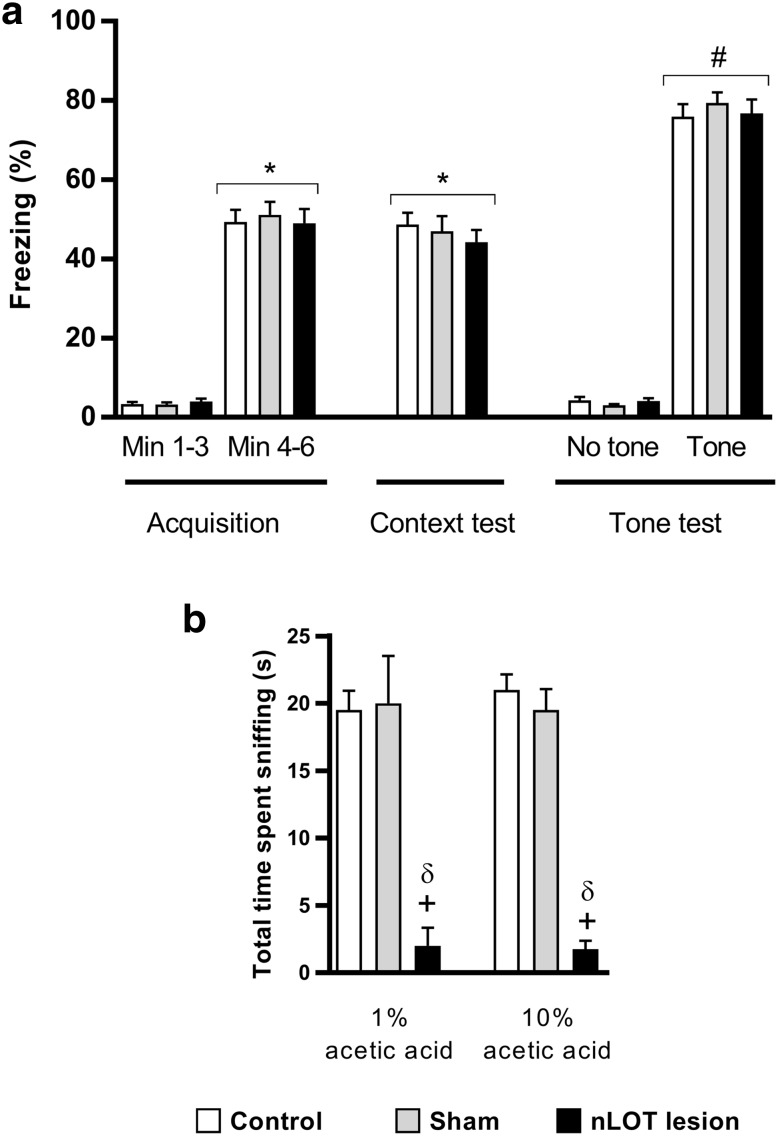
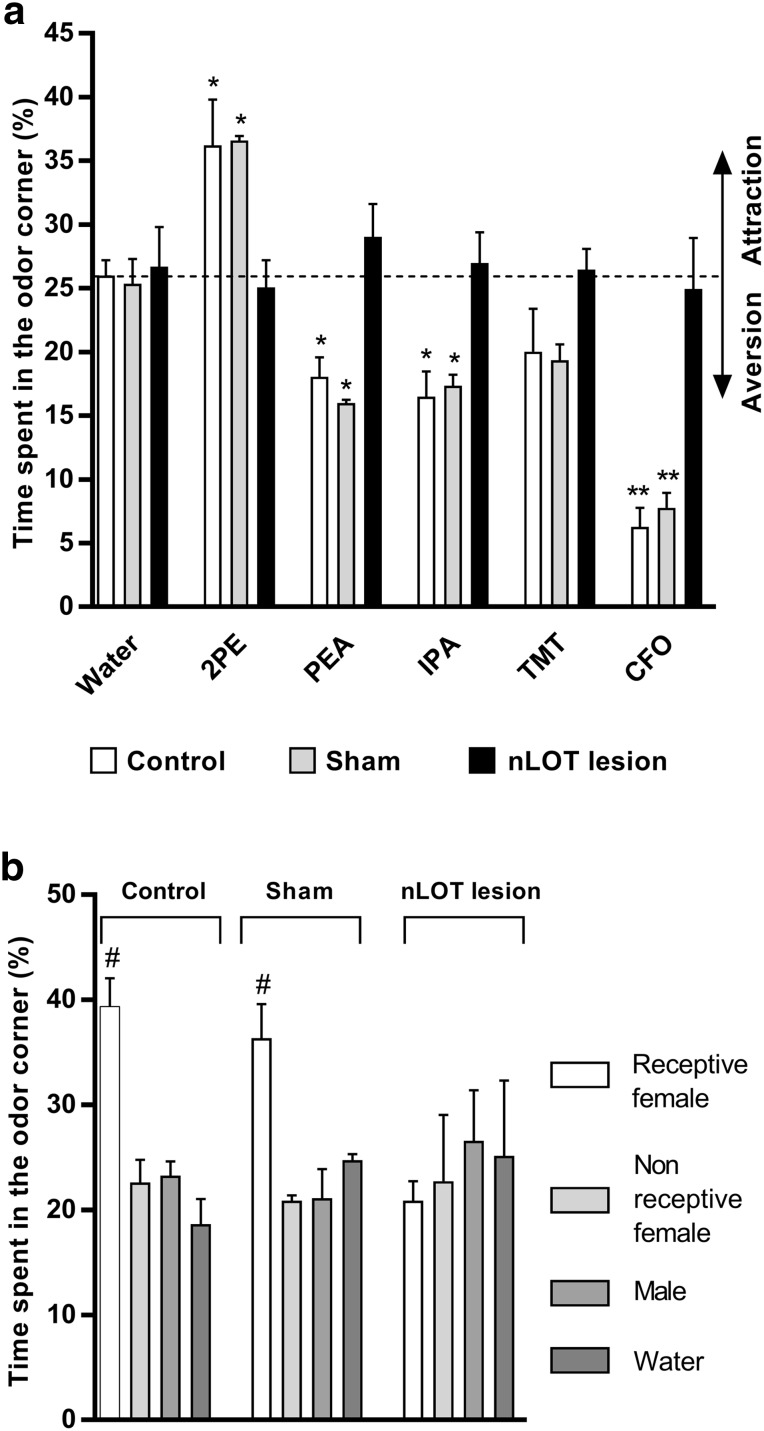
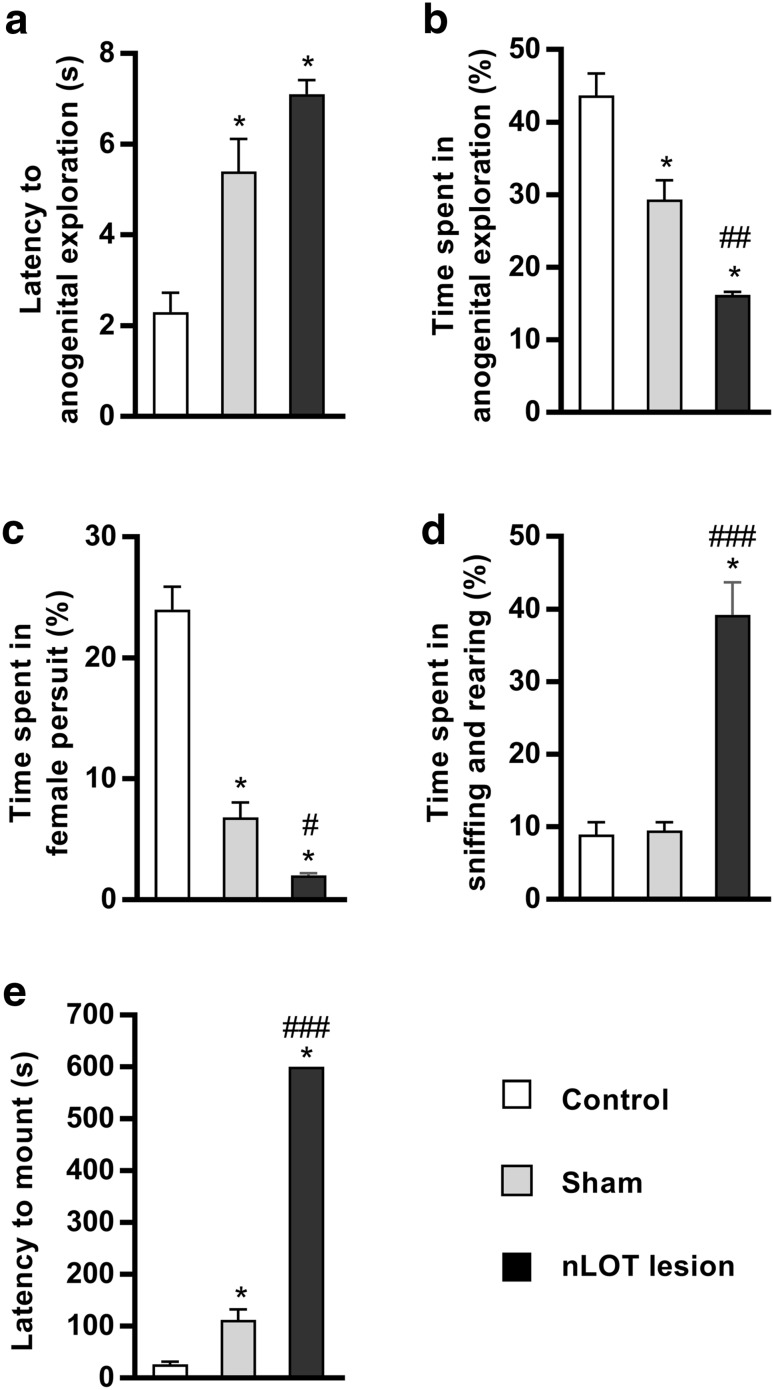
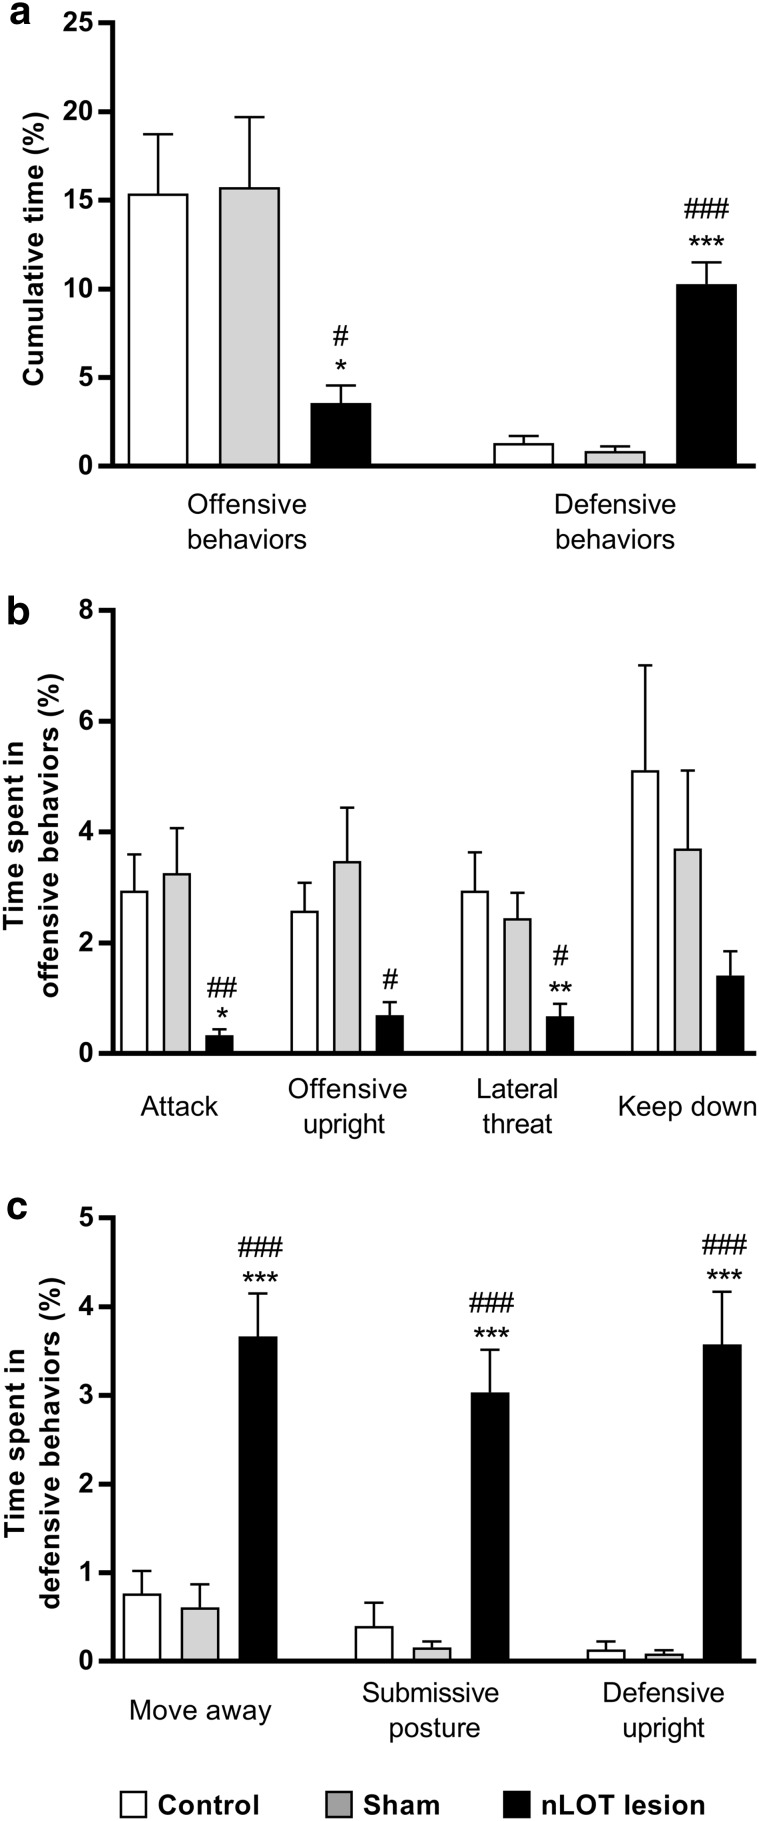
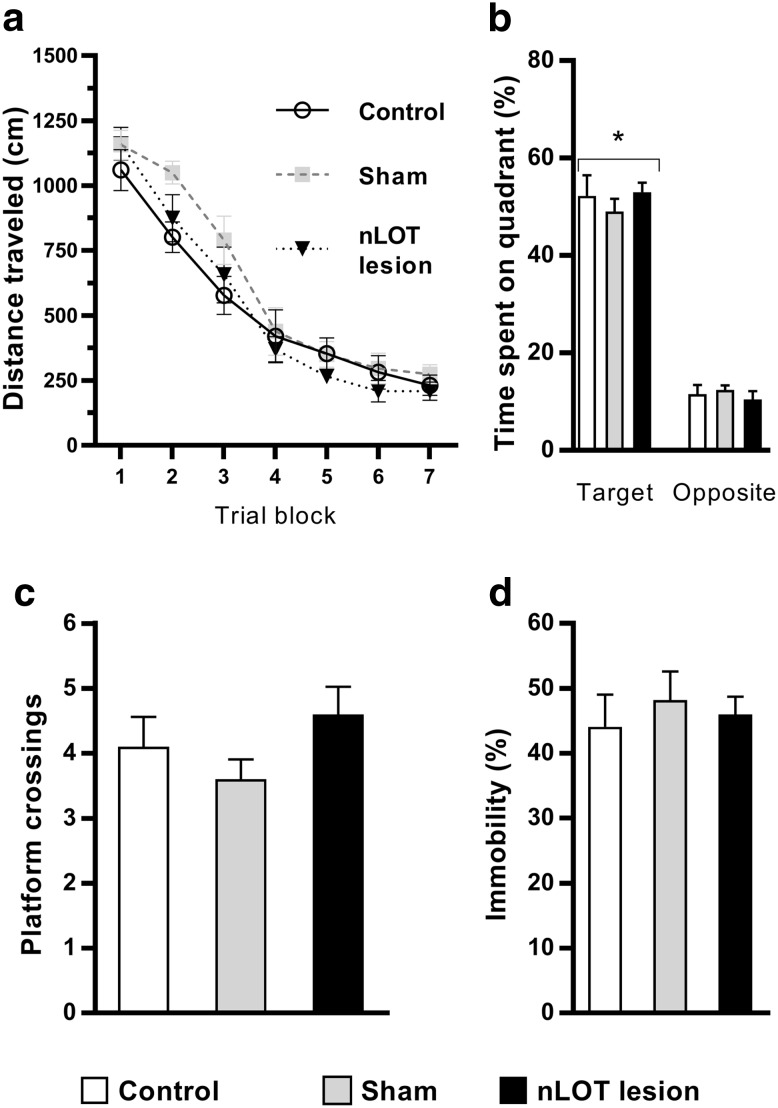
The nucleus of the lateral olfactory tract (nLOT) is a relatively small component of the cortical pallial amygdala, with peculiar neurogenic, neurochemical and connectivity patterns. Although it has been suggested that it might be involved in non-pheromonal olfactory-guided behaviors, particularly feeding, the functional implications of the nLOT have never been investigated. In view of this fact, we have tackled this subject by performing a series of behavioral tests and by quantifying biological and biochemical parameters in sexually naïve adult male rats that were submitted to bilateral excitotoxic lesions of the nLOT. nLOT-lesioned rats had severe olfactory deficits with inability to detect and discriminate between odors. Additionally, they did not display innate behavioral responses to biologically relevant chemosignals. Specifically, nLOT-lesioned rats did not show avoidance towards predator odors or aggressive behaviors towards intruders, and had severely impaired sexual behavior. In fact, nLOT lesions abolished preference for odors of receptive females, reduced chemoinvestigatory behavior and eliminated mounting behavior. nLOT-lesioned rats had normal circulating levels of testosterone, did not display anxiety- or depressive-like behaviors, and had unimpaired cognitive functions and fear acquisition and memory. Altogether, our results suggest that the nLOT integrity is required for the normal functioning of the olfactory system.

Keywords: Aggression; Anosmia; Attractive and avoidance behaviors; Cortical pallial amygdala; Olfactory cortex; Sexual behavior.


Conflict of interest statement

The authors declare that they have no conflict of interest.

Figures

Fig. 1
Fig. 1
Sequence and experimental timeline of the behavioral tests. The day of surgery was used as day 0 (D0) of the experiments. Control rats were age-matched. Tests were all done with 1-day inter-test intervals. Tests done until day 30 post-surgery included all rats (n = 30/group). Thereafter, one third of the rats in each group (n = 10/group) were submitted either to (1) olfactory preference tests, (2) sexual behavior followed by aggression, or (3) Morris water maze followed by forced swim test
Fig. 2
Fig. 2
a Schematic drawing of a coronal section of the rat brain through the nLOT (adapted from Paxinos and Watson 1998). The thick dashed vertical line indicates the trajectory of the needle. (b–e) Digital photomicrographs of Giemsa-stained coronal sections of the nLOT of a sham-lesioned rat (b) and a nLOT-lesioned rat (c–e). The light-gray box drawn in a delineates approximately the area where the photomicrographs shown in b and d were taken. The c and e sections are located 160 μm rostral and caudal, respectively, to the d section. In b–e, the nLOT is outlined by a continuous line and the borders between the adjacent layers are indicated by dashed lines. The open arrowheads in c–e demarcate the periphery of the lesion and the arrow in d indicates the injection track. (f–g) Photomicrographs of Nissl-stained coronal sections of the nLOT layers 2 and 3 of a sham-lesioned rat (f) and a nLOT-lesioned rat (g) taken at a higher magnification than those shown in b–e to demonstrate that, by comparison with section of the sham-lesioned rat (f), there are numerous reactive glial cells in the nLOT-lesioned rat (g). 3V 3rd ventricle, AA anterior amygdaloid area, ACo anterior cortical amygdaloid nucleus, B basal nucleus (Meynert), cc corpus callosum, CPu caudate putamen (striatum), f fornix, ic internal capsule, GP globus pallidus, lo lateral olfactory tract, LV lateral ventricle, MeAD medial amygdaloid nucleus, anterodorsal part, nLOT nucleus of the lateral olfactory tract (layers 1, 2 and 3), ox optic chiasm, Pir piriform cortex, S1 primary somatosensory cortex, SID substantia innominata, dorsal part, SIV substantia innominata, ventral part, SO supraoptic nucleus, st stria terminalis. Scale bars 100 μm
Fig. 3
Fig. 3
Rostrocaudal sequence a–c of schematic drawings of coronal sections of the rat brain through the nLOT (adapted from Paxinos and Watson 1998). Shaded areas represent the maximal (light gray) and the minimal (dark gray) extent of the nLOT lesions that were observed in the rats included in the study. 3V 3rd ventricle, AA anterior amygdaloid area, ACo anterior cortical amygdaloid nucleus, BMA basomedial amygdaloid nucleus, anterior part, f fornix, lo lateral olfactory tract, MeAD medial amygdaloid nucleus, anterodorsal part, nLOT nucleus of the lateral olfactory tract (layers 1, 2 and 3), ox optic chiasm, Pir piriform cortex, SO supraoptic nucleus
Fig. 4
Fig. 4
Relative body weight and food intake variations following the day of surgery for inducing nLOT or sham lesions, presented as mean ± SEM. a Body weight change, expressed as a percent of the average weekly gain or loss from pre-surgery weight. One week after surgery, nLOT- and sham-lesioned rats showed significant weight loss compared to controls, followed by a progressive increase until the end of the experiments. During week-2 post-surgery, the relative body weight gain was significantly higher in nLOT- and sham-lesioned rats than in controls. From weeks 3 to 5, only in nLOT-lesioned rats the relative weight gain was significantly higher than in controls. Thereafter, the relative body weight variations were similar in all groups. b Relative food intake, expressed as grams of food intake per week, per gram body weight. The relative food intake was smaller in nLOT- and sham-lesioned rats compared to controls during week-1 post-surgery. Thereafter, there was a tendency for the relative food intake to be higher in nLOT- and sham-lesioned rats than in controls. However, the differences reached statistical significant levels only at weeks 3 and 4 for nLOT-lesioned rats, and weeks 4 and 5 for sham-lesioned rats. *p < 0.05, **p < 0.01, ***p < 0.001 between nLOT-lesioned and controls; # p < 0.05, ## p < 0.01, ### p < 0.001 between sham-lesioned and control rats
Fig. 5
Fig. 5
nLOT-lesioned rats have severe olfactory deficits. a Buried food test. Histograms show the mean + SEM time spent to find the hidden and the surface cookies. The latency to find the hidden cookie was significantly longer in nLOT-lesioned than in sham-lesioned and control rats. No differences were found between groups to find the visible cookie. b, c Olfactory habituation/cross-habituation test. The graph b shows mean ± SEM olfactory investigation times across three consecutive 2-min trials separated with 1-min inter-trial of water, two nonsocial and two social odors. Control and sham-lesioned rats, but not nLOT-lesioned rats, show significantly shorter investigation times across three presentations of the same odor (habituation). In addition, control and sham-lesioned rats, but not nLOT-lesioned rats, significantly increased the investigation time after presentation of a new odor (cross-habituation). No significant differences were found between the investigation times of control and sham-lesioned rats. The values of the post-hoc tests are shown in the “Results” section. The histogram c shows that the mean + SEM cumulative time that nLOT-lesioned rats spent investigating each odor was significantly inferior to that spent by sham-lesioned and control rats. *p < 0.001 compared to controls; # p < 0.001 compared to sham-lesioned rats; + p < 0.001 compared to the respective group in the buried food test
Fig. 6
Fig. 6
nLOT-lesioned rats have normal locomotor activity and do not exhibit anxiety-like behaviors. a Open-field test. The histogram shows the mean + SEM distances travelled in outer and inner zones of the open-field. There were no significant differences between groups in the distances travelled in each zone, and similar to control and sham-lesioned rats, nLOT-lesioned rats travelled significant longer distances in the outer zone than in the inner zone. b, c Elevated plus-maze test. Graphic representation of the mean + SEM distances travelled (b) and time spent (c) in closed and open arms, and in central square of the elevated plus-maze. There were no significant differences between controls, sham-lesioned and nLOT-lesioned rats in the distances travelled and in the time spent in the closed and open arms, and in central square of the maze. In addition, rats of all groups travelled significantly longer distances and spent significantly more time in the closed arms than in the open arms and central square of the maze. d The histogram shows the mean + SEM number of fecal boli and amount of urine deposited by rats during the open-field and elevated plus-maze tests. No significant differences between the groups were found. *p < 0.001 compared with the inner zone in the open-field test and with the open arms and central square in the elevated plus-maze test
Fig. 7
Fig. 7
nLOT-lesioned rats do not have depressive-like behaviors. a, b Sucrose preference test. The histogram in a shows the mean + SEM percentage of sucrose solution ingestion relative to the total amount of liquid consumption by each group of rats averaged over the 4 days of the test. No significant differences were found in sucrose preference between groups, indicating that nLOT lesions do not increase anhedonia or induce depressive-like behaviors. The histogram in b shows the mean + SEM percent increase in the total amount of fluid consumption (water plus sucrose solution) during the test relative to baseline water consumption. No differences among all groups were found
Fig. 8
Fig. 8
nLOT-lesioned rats have similar levels of contextual and cued fear conditioned learning and memory. a nLOT- and sham-lesioned rats did not show any difference compared to control rats in the percentage of freezing time for each of the 3-min periods of the acquisition session, during the context retention test, and during each of the 3-min periods of the tone retention test, which was performed in a novel context. No tone or footshock was delivered during the first 3-min periods of the acquisition session and of the tone retention test. The histogram b shows that the mean cumulative time that nLOT-lesioned rats spent investigating 1% and 10% acetic acid was significantly inferior to that spent by sham-lesioned and control rats. Data are presented as the mean + SEM. *p < 0.001 compared to min 1–3 of the acquisition test of the respective group; # p < 0.001 compared to the no tone period of the respective group; + p < 0.001 compared to controls, δ p < 0.001 compared to sham-lesioned rats
Fig. 9
Fig. 9
nLOT-lesioned rats do not show innate odor attractive or aversive behaviors. The histogram in a shows the mean + SEM percentage of the cumulative time that rats spent investigating the corner of the open-field arena where the several odors were individually presented over the duration of the test. The percentage of time spent investigating water (dashed line) was used as the criterion to define the threshold between attraction and aversion. Control and sham-lesioned rats spent significantly more time sniffing the attractive odor 2-phenylethanol (2PE) and significantly less time sniffing the aversive odors 2-phenylethylamine (PEA), isopentylamine (IPA) and cat fur odor (CFO) than water. Conversely, nLOT-lesioned rats spent a similar time investigating water and all the other odors presented. b Graphic representation of the mean + SEM percentage of the cumulative time that rats spent investigating the corners of the open-field arena where the Petri dishes containing the odors of receptive females, non-receptive females, males and water (one in each corner) over the duration of the test. Control and sham-lesioned rats spent significantly more time sniffing the receptive female odor than the remaining odors. Conversely, nLOT-lesioned rats did spent a similar time investing all odors presented. *p < 0.05, **p < 0.001 compared to water of the respective group; # p < 0.001 compared to other odors and water
Fig. 10
Fig. 10
nLOT-lesioned rats have impaired sexual behavior. Histograms show means + SEM values. a The latency to the first anogenital exploration of receptive females was significantly longer in nLOT- and sham-lesioned rats than in control. No differences were found between nLOT- and sham-lesioned rats. b The percentage of cumulative time over the duration of the test that nLOT-lesioned rats engaged in anogenital exploration was significantly shorter than in sham-lesioned and control rats. Sham-lesioned rats also spent significantly less time in anogenital exploration than controls. c The percentage of cumulative time over the duration of the test that nLOT-lesioned rats spent in female pursuit was significantly shorter than that spent by sham-lesioned and control rats. Sham-lesioned rats also spent significantly less time in female pursuit than controls. d The percentage of cumulative time over the duration of the test that nLOT-lesioned rats spent in sniffing and rearing behaviors was significantly shorter than that spent by sham-lesioned and control rats. No differences were found in these behaviors between sham-lesioned and control rats. e None of the nLOT-lesioned rats exhibited mounting over the 10 min of testing. Contrariwise, all sham-lesioned and control rats exhibited mounting, but the latency to mount was significantly longer in sham-lesioned than in control rats. *p < 0.001 compared to control rats; # p < 0.05, ## p < 0.01 and ### p < 0.001 compared to sham-lesioned rats
Fig. 11
Fig. 11
nLOT-lesioned rats do not show aggressive behavior as revealed by the resident-intruder test. Histograms represent means + SEM values of the percentage of the cumulative time over the duration of the test that rats engaged in offensive and defensive behaviors. a nLOT-lesioned rats spent significantly less time in offensive behaviors and significantly more time in defensive behaviors than control and sham-lesioned rats. b nLOT-lesioned rats spent significantly less time in attack, offensive upright and lateral threat offensive behaviors than control and sham-lesioned rats. c Percentage of cumulative time that rats spent in moving away, submissive posture and defensive upright behaviors. nLOT-lesioned rats spent significantly more time in moving away, submissive posture and defensive upright behaviors than control and sham-lesioned rats. *p < 0.05, **p < 0.01 and ***p < 0.001 compared to control; # p < 0.05, ## p < 0.01 and ### p < 0.001 compared to sham-lesioned rats
Fig. 12
Fig. 12
nLOT-lesioned rats do not display cognitive alterations. ac Morris water maze test. The graph in a shows the mean ± SEM total distances travelled (cm) to find the hidden platform for each block of four consecutive trials in the Morris water maze. There were no significant differences in acquisition performance between groups. The histogram in b shows mean + SEM values of the percentage of the cumulative time spent, over the duration of the test, on the quadrant where the hidden platform was located compared to the opposite quadrant. No significant differences were found between the three groups. The histogram in c shows mean + SEM number of platform crossings over the duration of the test. No significant differences were found among groups. d Forced swim test. The histogram shows the mean + SEM percentage of cumulative immobility time over the duration of the test. No differences were found between nLOT-lesioned, sham-lesioned and control rats. *p < 0.001 compared to the opposite quadrant

Similar articles

Cited by

References

    1. Albers HE. The regulation of social recognition, social communication and aggression: vasopressin in the social behavior neural network. Horm Behav. 2012;61:283–292. doi: 10.1016/j.yhbeh.2011.10.007. - DOI - PubMed
    1. Baum MJ, Cherry JA. Processing by the main olfactory system of chemosignals that facilitate mammalian reproduction. Horm Behav. 2015;68:53–64. doi: 10.1016/j.yhbeh.2014.06.003. - DOI - PubMed
    1. Brennan P, Keverne EB. Biological complexity and adaptability of simple mammalian olfactory memory systems. Neurosci Biobehav Rev. 2015;50:29–40. doi: 10.1016/j.neubiorev.2014.10.020. - DOI - PubMed
    1. Brignall AC, Cloutier J-F. Neural map formation and sensory coding in the vomeronasal system. Cell Mol Life Sci. 2015;72:4697–4709. doi: 10.1007/s00018-015-2029-5. - DOI - PMC - PubMed
    1. Canteras NS, Pavesi E, Carobrez AP. Olfactory instruction for fear: neural system analysis. Front Neurosci. 2015;9:276. doi: 10.3389/fnins.2015.00276. - DOI - PMC - PubMed

LinkOut - more resources