. 2017 Jun;145(3):275-293.
doi: 10.1007/s10709-017-9964-z. Epub 2017 Apr 19.

Transposable elements in the Anopheles funestus transcriptome

Affiliations

Transposable elements in the Anopheles funestus transcriptome

Rita D Fernández-Medina et al. Genetica. 2017 Jun.

Abstract

Transposable elements (TEs) are present in most of the eukaryotic genomes and their impact on genome evolution is increasingly recognized. Although there is extensive information on the TEs present in several eukaryotic genomes, less is known about the expression of these elements at the transcriptome level. Here we present a detailed analysis regarding the expression of TEs in Anopheles funestus, the second most important vector of human malaria in Africa. Several transcriptionally active TE families belonging both to Class I and II were identified and characterized. Interestingly, we have identified a full-length putative active element (including the presence of full length TIRs in the genomic sequence) belonging to the hAT superfamily, which presents active members in other insect genomes. This work contributes to a comprehensive understanding of the landscape of transposable elements in A. funestus transcriptome. Our results reveal that TEs are abundant and diverse in the mosquito and that most of the TE families found in the genome are represented in the mosquito transcriptome, a fact that could indicate activity of these elements.The vast diversity of TEs expressed in A. funestus suggests that there is ongoing amplification of several families in this organism.

Keywords: Anopheles funestus; Transcriptome; Transposable elements.


Figures
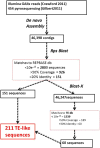
Figure 1
Figure 1
Pipeline used for the identification of TE-like sequences in the transcriptome of A. funestus.
Figure 2
Figure 2. Distribution of TE-like sequences in the A. funestus transcriptome
The outer chart represents the three main classes/orders of TEs (LTRs, Non-LTRs and Class II) and the inner chart shows the distribution of TE superfamilies within each class/order. The figures are based on the 211 sequences that were characterized in the transcriptome.
Figure 3
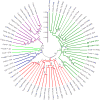
Figure 3. Phylogenetic relationships of LTR sequences from A. funestus
The phylogenetic relationships of 22 LTR sequences from A. funestus plus 35 reference sequences from other insect genomes (accession numbers in Table S3) including sequences from the gypsy, copia, Bel-Pao, and HIV, spanning the RT domain. The phylogeny was inferred using the Neighbor-Joining method (Saitou and Nei 1987). The optimal tree with the sum of branch length = 15.51243938 is shown. The tree is drawn to scale, with branch lengths in the same units as those of the evolutionary distances used to infer the phylogenetic tree. The evolutionary distances were computed using the p-distance method and are in the units of the number of amino acid differences per site. The analysis involved 59 amino acid sequences. All ambiguous positions were removed for each sequence pair. There were a total of 302 positions in the final dataset. The analyses were conducted in MEGA5 (Tamura et al. 2011). The numbers above the branches indicate the bootstrap value of a total of 1000 resamplings (only values higher than 70 are shown in the Figure). The different LTR superfamilies are coloured as follows: Gypsy in red, Pao-Bel in green and Copia in blue. The A. funestus' sequences are highlighted with colored dots corresponding to each superfamily.
Figure 4
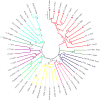
Figure 4. Phylogenetic relationships of Gypsy sequences from A. funestus
The phylogenetic relationships of ten sequences from A. funestus and 56 reference sequences from other insect genomes (accession numbers in Table S3). The phylogeny was inferred using the Neighbor-Joining method (Saitou and Nei 1987). The optimal tree with the sum of branch length = 15.77766579 is shown. The tree is drawn to scale, with branch lengths in the same units as those of the evolutionary distances used to infer the phylogenetic tree. The evolutionary distances were computed using the p-distance method and are in the units of the number of amino acid differences per site. The analysis involved 85 amino acid sequences. All ambiguous positions were removed for each sequence pair. There were a total of 334 positions in the final dataset. The analyses were conducted in MEGA5 (Tamura et al. 2011). The numbers above the branches indicate the bootstrap value of a total of 1000 resamplings (only values higher than 70 are shown in the Figure). The different Gypsy lineages are coloured as follows: blue for Gypsy, olive-green for Mdg1, light-green for CsRn1, purple for Mdg3, and red for the Mag lineage. The A. funestus' sequences are highlighted with colored dots corresponding to each lineage.
Figure 5
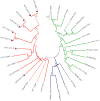
Figure 5. Phylogenetic relationships of Bel/Pao sequences from A. funestus
Phylogenetic relationships of nine sequences from A. funestus and 69 reference sequences from other insect genomes (accession numbers in Table S3). The phylogeny was inferred using the Neighbor-Joining method (Saitou and Nei 1987). The optimal tree with the sum of branch length = 17.56064770 is shown. The tree is drawn to scale, with branch lengths in the same units as those of the evolutionary distances used to infer the phylogenetic tree. The evolutionary distances were computed using the p-distance method and are in the units of the number of amino acid differences per site. The analysis involved 78 amino acid sequences. All ambiguous positions were removed for each sequence pair. There were a total of 241 positions in the final dataset. The analyses were conducted in MEGA5 (Tamura et al. 2011). The numbers above the branches indicate the bootstrap value of a total of 1000 resamplings (only values higher than 70 are shown in the Figure). The different Pao/Bel lineages are coloured as follows: green for Dan, red for Simbad, light-green for Pao, turquoise for Suzu, olive-green for Flow, purple for Tas and pink for Bel. The A. funestus' sequences are highlighted with colored dots corresponding to each lineage.
Figure 6
Figure 6. Phylogenetic relationships of Copia sequences from A. funestus
Phylogenetic relationships of three sequences from A. funestus and 62 reference sequences from other insect genomes (accession numbers in Table S3). The phylogeny was inferred using the Neighbor-Joining method (Saitou and Nei 1987). The optimal tree with the sum of branch length = 12.87295711 is shown. The tree is drawn to scale, with branch lengths in the same units as those of the evolutionary distances used to infer the phylogenetic tree. The evolutionary distances were computed using the p-distance method and are in the units of the number of amino acid differences per site. The analysis involved 65 amino acid sequences. All ambiguous positions were removed for each sequence pair. There were a total of 268 positions in the final dataset. The analyses were conducted in MEGA5 (Tamura et al. 2011). The numbers above the branches indicate the bootstrap value of a total of 1000 resamplings (only values higher than 70 are shown in the Figure). The different Copia lineages are colored. The A. funestus' sequences are highlighted with green colored dots.
Figure 7
Figure 7. Phylogenetic relationships of NLTRs sequences from A. funestus
Phylogenetic relationships of seven sequences from A. funestus and 42 reference sequences from other insect genomes (accession numbers in Table S3). The phylogeny was inferred using the Neighbor-Joining method (Saitou and Nei 1987). The optimal tree with the sum of branch length = 12.45383147 is shown. The tree is drawn to scale, with branch lengths in the same units as those of the evolutionary distances used to infer the phylogenetic tree. The evolutionary distances were computed using the p-distance method and are in the units of the number of amino acid differences per site. The analysis involved 50 amino acid sequences. All ambiguous positions were removed for each sequence pair. There were a total of 316 positions in the final dataset. The analyses were conducted in MEGA5 (Tamura et al. 2011). The numbers above the branches indicate the bootstrap value of a total of 1000 resamplings (only values higher than 70 are shown in the Figure). The different NLTR superfmilies are coloured as follows: red for R1, green for Lones, blue for Jockey, pink for Crack, yellow for CR1, light-green for Outcast, purple for I, turquoise for L1 and light-blue for RTE. The A. funestus' sequences are highlighted with colored dots corresponding to each superfamily.
Figure 8
Figure 8. Phylogentic relationships of DDE/D sequences from A. funestus
Phylogenetic relationships of eleven sequences from A. funestus and 48 reference sequences from other insect genomes (accession numbers in Table S3). The phylogeny was inferred using the Neighbor-Joining method (Saitou and Nei 1987). The optimal tree with the sum of branch length = 14.37694765 is shown. The evolutionary distances were computed using the p-distance method and are in the units of the number of amino acid differences per site. The analysis involved 59 amino acid sequences. All ambiguous positions were removed for each sequence pair. There were a total of 285 positions in the final dataset. The analyses were conducted in MEGA5 (Tamura et al. 2011). The numbers above the branches indicate the bootstrap value of a total of 1000 resamplings (only values higher than 70 are shown in the Figure). The different DDE/D superfamilies are coloured as follows: red for Mariners, green for Tc1, pink for pogo, and blue for Harbinger. The A. funestus' sequences are highlighted with colored dots corresponding to each lineage.
Figure 9
Figure 9. Phylogenetic relationships of hAT sequences from A. funestus
Phylogenetic relationships of three sequences from the A. funestus transcriptome and five sequences from the genome together with 23 sequences from other insect genomes (accession numbers in Table S3). The phylogeny was inferred using the Neighbor-Joining method (Saitou and Nei 1987). The optimal tree with the sum of branch length = 6.28002189 is shown. The tree is drawn to scale, with branch lengths in the same units as those of the evolutionary distances used to infer the phylogenetic tree. The evolutionary distances were computed using the p-distance method and are in the units of the number of amino acid differences per site. The analysis involved 31 amino acid sequences. All ambiguous positions were removed for each sequence pair. There were a total of 107 positions in the final dataset. The analyses were conducted in MEGA5 (Tamura et al. 2011). The numbers above the branches indicate the bootstrap value of a total of 1000 resamplings (only values higher than 70 are shown in the Figure). Different hAT lineages are coloured in red, blue and green. The A. funestus' sequences are highlighted with colored dots corresponding to each lineage, in red the sequenes isolated from the transcriptome (T) and in black the sequences obtained from the genome (G).

Similar articles

Cited by

References

    1. Adams MD, Celniker SE, Holt RA, Evans CA, Gocayne JD, Amanatides PG, Scherer SE, Li PW, Hoskins RA, Galle RF, George RA, Lewis SE, Richards S, Ashburner M, Henderson SN, Sutton GG, Wortman JR, Yandell MD, Zhang Q, Chen LX, Brandon RC, Rogers YH, Blazej RG, Champe M, Pfeiffer BD, Wan KH, Doyle C, Baxter EG, Helt G, Nelson CR, Gabor GL, Abril JF, Agbayani A, An HJ, Andrews-Pfannkoch C, Baldwin D, Ballew RM, Basu A, Baxendale J, Bayraktaroglu L, Beasley EM, Beeson KY, Benos PV, Berman BP, Bhandari D, Bolshakov S, Borkova D, Botchan MR, Bouck J, Brokstein P, Brottier P, Burtis KC, Busam DA, Butler H, Cadieu E, Center A, Chandra I, Cherry JM, Cawley S, Dahlke C, Davenport LB, Davies P, de Pablos B, Delcher A, Deng Z, Mays AD, Dew I, Dietz SM, Dodson K, Doup LE, Downes M, Dugan-Rocha S, Dunkov BC, Dunn P, Durbin KJ, Evangelista CC, Ferraz C, Ferriera S, Fleischmann W, Fosler C, Gabrielian AE, Garg NS, Gelbart WM, Glasser K, Glodek A, Gong F, Gorrell JH, Gu Z, Guan P, Harris M, Harris NL, Harvey D, Heiman TJ, Hernandez JR, Houck J, Hostin D, Houston KA, Howland TJ, Wei MH, Ibegwam C, Jalali M, Kalush F, Karpen GH, Ke Z, Kennison JA, Ketchum KA, Kimmel BE, Kodira CD, Kraft C, Kravitz S, Kulp D, Lai Z, Lasko P, Lei Y, Levitsky AA, Li J, Li Z, Liang Y, Lin X, Liu X, Mattei B, McIntosh TC, McLeod MP, cPherson D, Merkulov G, Milshina NV, Mobarry C, Morris J, Moshrefi A, Mount SM, Moy M, Murphy B, Murphy L, Muzny DM, Nelson DL, Nelson DR, Nelson KA, Nixon K, Nusskern DR, Pacleb JM, Palazzolo M, Pittman GS, Pan S, Pollard J, Puri V, Reese MG, Reinert K, Remington K, Saunders RD, Scheeler F, Shen H, Shue BC, Sidãon-Kiamos I, Simpson M, Skupski MP, Smith T, Spier E, Spradling AC, Stapleton M, Strong R, Sun E, Svirskas R, Tector C, Turner R, Venter E, Wang AH, Wang X, Wang ZY, Wassarman DA, Weinstock GM, Weisenbach J, Williams SM, Woodage T, Worley KC, Wu D, Yang S, Yao QA, Ye J, Yeh RF, Zaveri JS, Zhan M, Zhang G, Zhao Q, Zheng L, Zheng XH, Zhong FN, Zhong W, Zhou X, Zhu S, Zhu X, Smith HO, Gibbs RA, Myers EW, Rubin GM, Venter JC. The genome sequence of Drosophila melanogaster. Science. 2000 Mar 24;287(5461):2185–95. - PubMed
    1. Altschul SF, Madden TL, Schaffer AA, Zhang J, Zhang Z, Miller W, Lipman DJ. Gapped BLAST and PSI-BLAST: a new generation of protein database search programs. Nucleic Acids Res. 1997;25:3389–3402. - PMC - PubMed
    1. Arensburger P, Hice RH, Zhou L, Smith RC, Tom AC, Wright JA, Knapp J, O'Brochta DA, Craig NL, Atkinson PW. Phylogenetic and functional characterizationof the hAT transposon superfamily. Genetics. 2011;188(1):45–57. - PMC - PubMed
    1. Arensburger P, Kim YJ, Orsetti J, Aluvihare C, O'Brochta DA, Atkinson PW. An active transposable element, Herves, from the African malaria mosquito Anopheles gambiae. Genetics. 2005;169(2):697–708. - PMC - PubMed
    1. Arensburger P, Megy K, Waterhouse RM, Abrudan J, Amedeo P, Antelo B, Bartholomay L, Bidwell S, Caler E, Camara F, Campbell CL, Campbell KS, Casola C, Castro MT, Chandramouliswaran I, Chapman SB, Christley S, Costas J, Eisenstadt E, Feschotte C, Fraser-Liggett C, Guigo R, Haas B, Hammond M, Hansson BS, Hemingway J, Hill SR, Howarth C, Ignell R, Kennedy RC, Kodira CD, Lobo NF, Mao C, Mayhew G, Michel K, Mori A, Liu N, Naveira H, Nene V, Nguyen N, Pearson MD, Pritham EJ, Puiu D, Qi Y, Ranson H, Ribeiro JM, Roberston HM, Severson DW, Shumway M, Stanke M, Strausberg RL, Sun C, Sutton G, Tu ZJ, Tubio JM, Unger MF, Vanlandingham DL, Vilella AJ, White O, White JR, Wondji CS, Wortman J, Zdobnov EM, Birren B, Christensen BM, Collins FH, Cornel A, Dimopoulos G, Hannick LI, Higgs S, Lanzaro GC, Lawson D, Lee NH, Muskavitch MA, Raikhel AS, Atkinson PW. Sequencing of Culex quinquefasciatus establishes a platform for mosquito comparative genomics. Science. 2010;330(6000):86–8. - PMC - PubMed

Substances

LinkOut - more resources