. 2017 Aug 1;525(11):2592-2610.
doi: 10.1002/cne.24226. Epub 2017 May 11.

Seizure frequency correlates with loss of dentate gyrus GABAergic neurons in a mouse model of temporal lobe epilepsy

Affiliations

Seizure frequency correlates with loss of dentate gyrus GABAergic neurons in a mouse model of temporal lobe epilepsy

Paul S Buckmaster et al. J Comp Neurol. .

Abstract

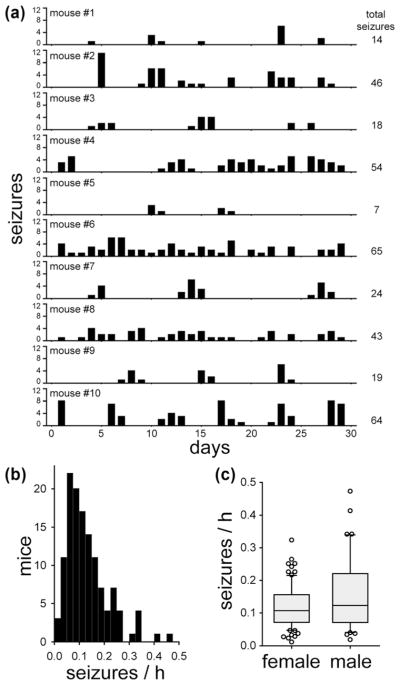
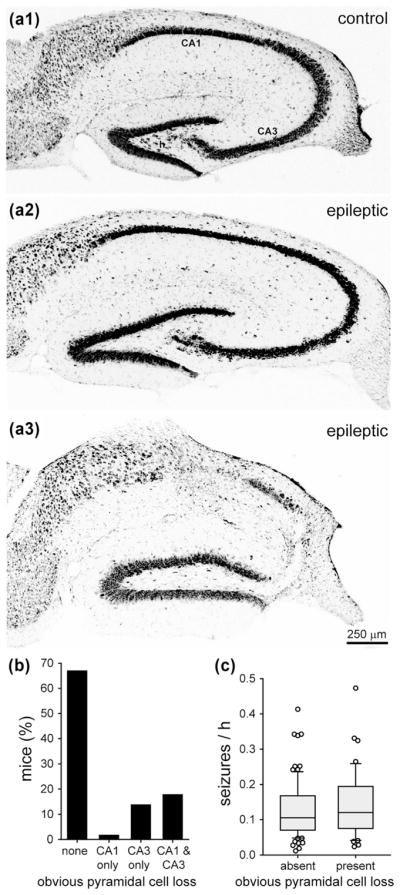
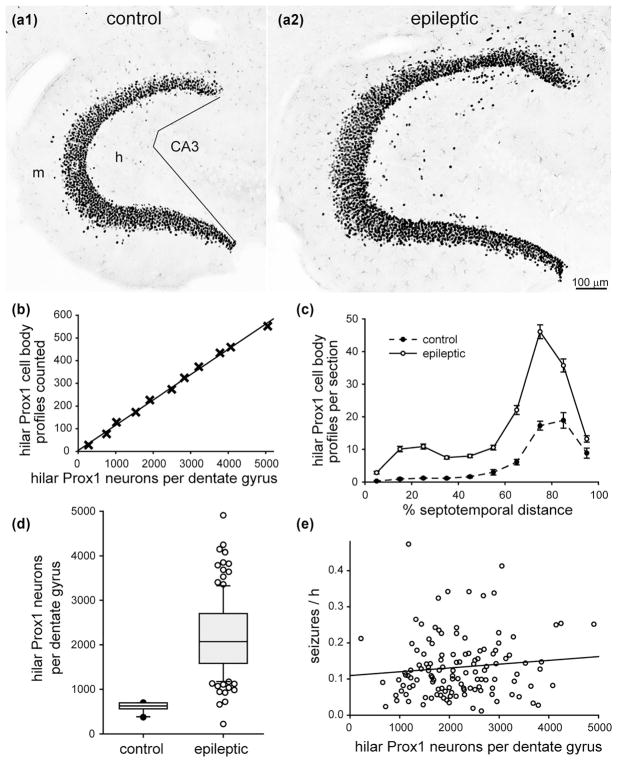
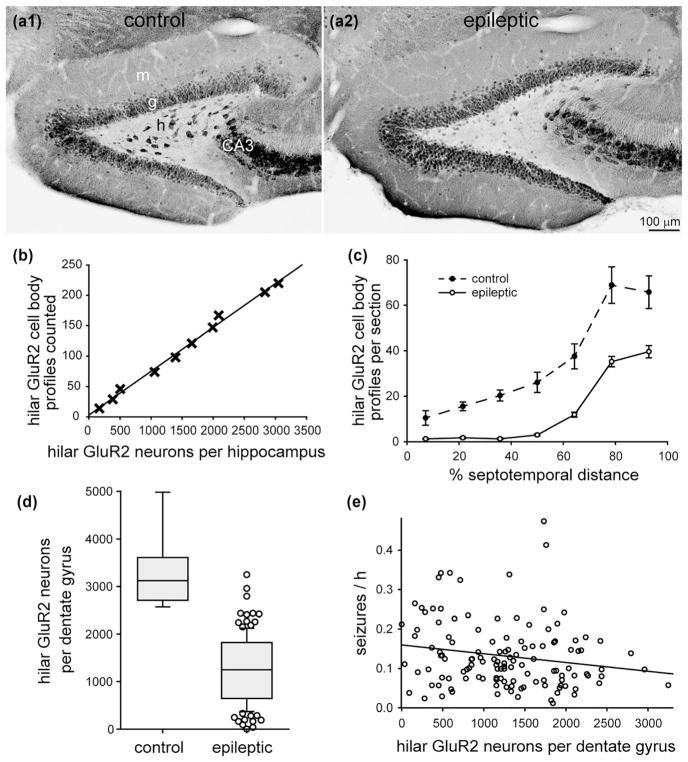
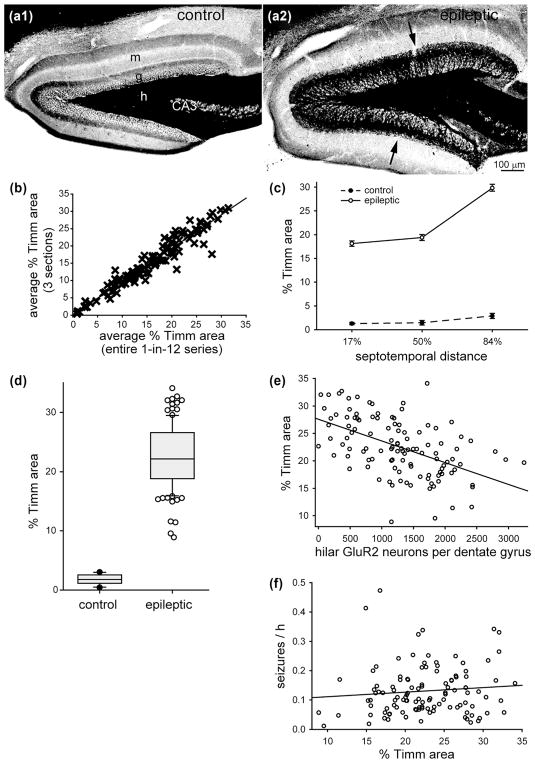
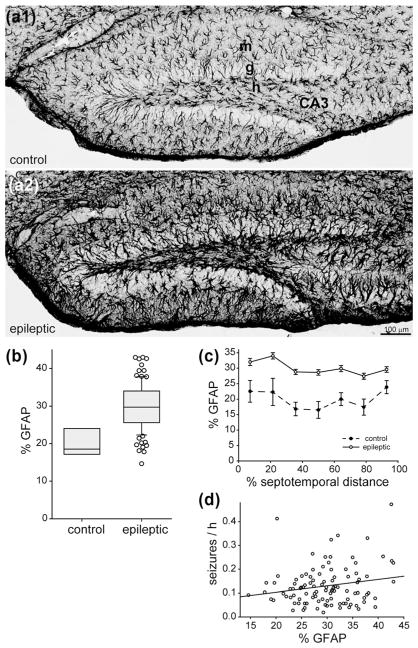
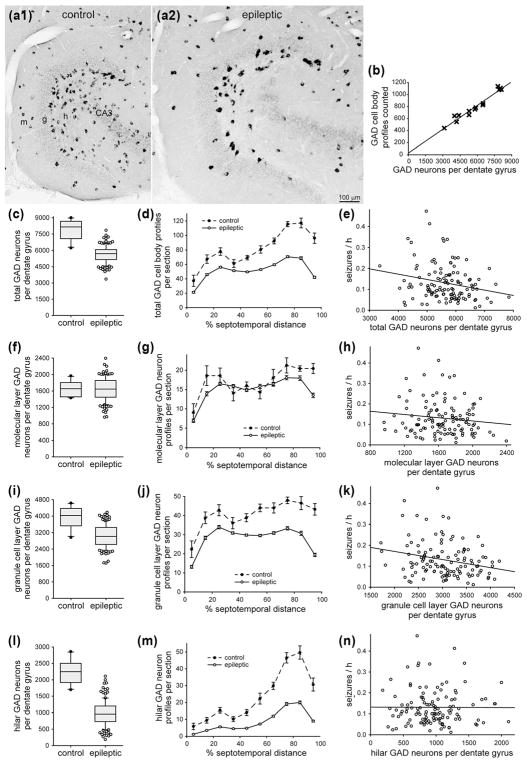
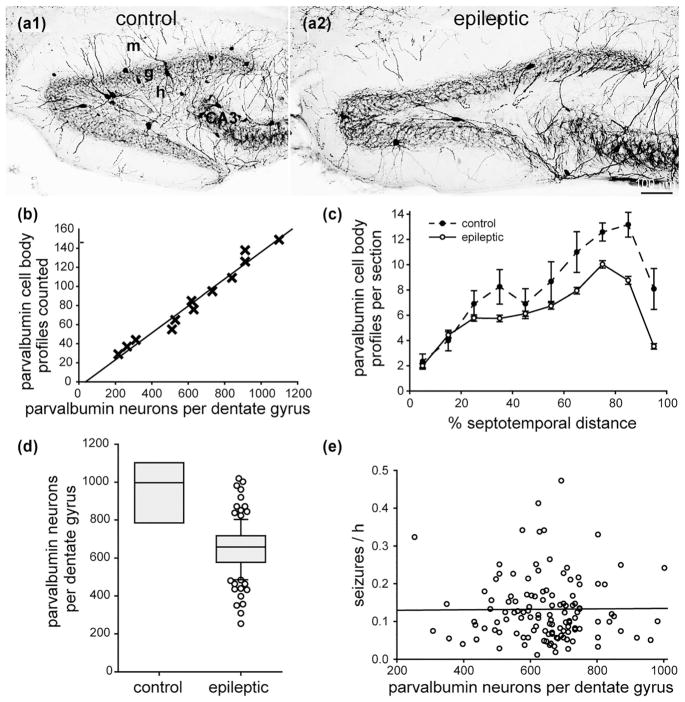
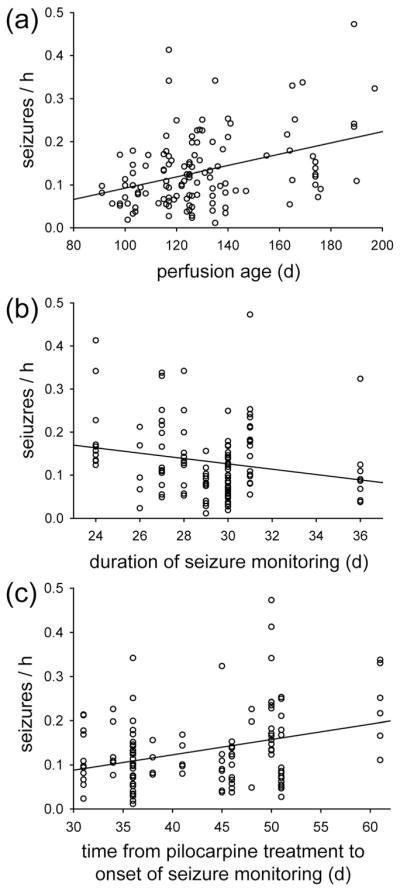
Epilepsy occurs in one of 26 people. Temporal lobe epilepsy is common and can be difficult to treat effectively. It can develop after brain injuries that damage the hippocampus. Multiple pathophysiological mechanisms involving the hippocampal dentate gyrus have been proposed. This study evaluated a mouse model of temporal lobe epilepsy to test which pathological changes in the dentate gyrus correlate with seizure frequency and help prioritize potential mechanisms for further study. FVB mice (n = 127) that had experienced status epilepticus after systemic treatment with pilocarpine 31-61 days earlier were video-monitored for spontaneous, convulsive seizures 9 hr/day every day for 24-36 days. Over 4,060 seizures were observed. Seizure frequency ranged from an average of one every 3.6 days to one every 2.1 hr. Hippocampal sections were processed for Nissl stain, Prox1-immunocytochemistry, GluR2-immunocytochemistry, Timm stain, glial fibrillary acidic protein-immunocytochemistry, glutamic acid decarboxylase in situ hybridization, and parvalbumin-immunocytochemistry. Stereological methods were used to measure hilar ectopic granule cells, mossy cells, mossy fiber sprouting, astrogliosis, and GABAergic interneurons. Seizure frequency was not significantly correlated with the generation of hilar ectopic granule cells, the number of mossy cells, the extent of mossy fiber sprouting, the extent of astrogliosis, or the number of GABAergic interneurons in the molecular layer or hilus. Seizure frequency significantly correlated with the loss of GABAergic interneurons in or adjacent to the granule cell layer, but not with the loss of parvalbumin-positive interneurons. These findings prioritize the loss of granule cell layer interneurons for further testing as a potential cause of temporal lobe epilepsy.

Keywords: GFAP; Prox1; RRID: AB_10000344; RRID: AB_10013382; RRID: AB_10064230; RRID: AB_2247874; Timm stain; hippocampus; mossy cell; pilocarpine.


Conflict of interest statement

CONFLICT OF INTEREST STATEMENT

The authors have no conflicts of interest.

Figures

FIGURE 1
FIGURE 1
Frequency of spontaneous, behavioral seizures in epileptic pilocarpine-treated mice. (a) Example of data from 10 mice. Mice were video-recorded 9 hr/day, every day for 1 month. Seizures of grade 3 or greater on the Racine (1972) scale were counted. (b) Histogram showing the distribution of seizure frequency for all the mice in this study. (c) Seizure frequency was not significantly different in female (n = 82) and male mice (n = 45, p = 0.327, Mann–Whitney rank sum test). In the box plots, the boundary of the box closest to zero indicates the 25th percentile, a line within the box marks the median, and the boundary of the box farthest from zero indicates the 75th percentile. Whiskers (error bars) above and below the box indicate the 90th and 10th percentiles. Markers indicate data points outside the 90th and 10th percentiles
FIGURE 2
FIGURE 2
No significant effect of obvious pyramidal cell loss on seizure frequency in epileptic pilocarpine-treated mice. Nissl staining of the hippocampus in a control mouse (a1), an epileptic mouse with obvious hilar neuron loss (a2), and an epileptic mouse with obvious loss of neurons in the hilus, CA1, and CA3 (a3). h = hilus. (b) Percentage of epileptic pilocarpine-treated mice with and without obvious pyramidal cell loss. (c) No significant difference in seizure frequency of mice with and without obvious pyramidal cell loss (p = 0.426, Mann–Whitney rank sum test)
FIGURE 3
FIGURE 3
No significant correlation between the number of hilar ectopic granule cells and seizure frequency in epileptic pilocarpine-treated mice. Prox1-immunostaining of the dentate gyrus in a control (a1) and epileptic mouse (a2). The dentate gyrus is larger and contains more Prox1-positive neurons in the granule cell layer and hilus of the epileptic mouse. Sections are 70% of the distance from the septal pole to the temporal pole of the hippocampus. Lines in (a1) indicate the border between the hilus (h) and CA3 field. g = granule cell layer; m = molecular layer. (b) High correlation between the number of hilar Prox1-positive cell body profiles counted and the number of hilar Prox1-positive neurons per dentate gyrus estimated by the optical fractionator method in a subset of mice from this study (R = 0.998, p <0.001, ANOVA). (c) Septotemporal distribution of hilar Prox1-positive cell body profiles per section. Values represent mean ± SEM. (d) More hilar Prox1-positive neurons per dentate gyrus in epileptic mice (n = 126) compared to controls (n = 10, p <0.001, Mann–Whitney rank sum test). (e) No significant correlation between the number of hilar Prox1-positive neurons per dentate gyrus and seizure frequency (R = 0.0763, p = 0.398, ANOVA)
FIGURE 4
FIGURE 4
No significant correlation between the number of mossy cells and seizure frequency in epileptic pilocarpine-treated mice. GluR2-immunostaining of the dentate gyrus from a control (a1) and epileptic mouse (a2). Sections are 50% of the distance from the septal pole to the temporal pole of the hippocampus. g = granule cell layer; h = hilus; m = molecular layer. (b) High correlation between the number of hilar GluR2-positive cell body profiles counted and the number of hilar GluR2-positive neurons per dentate gyrus estimated by the optical fractionator method in a subset of mice from this study (R = 0.997, p <0.001, ANOVA). Only hilar GluR2-positive cells with a soma diameter >12 μm were counted. (c) Septotemporal distribution of hilar GluR2-positive cell bodies. Values represent mean ± SEM. (d) Fewer hilar GluR2-positive neurons in epileptic mice (n = 127) compared to controls (n = 9, p ≤ 0.001, Mann–Whitney rank sum test). (e) No significant correlation between the number of hilar GluR2-positive neurons per dentate gyrus and seizure frequency (R = 0.156, p = 0.079, ANOVA)
FIGURE 5
FIGURE 5
No significant correlation between mossy fiber sprouting and seizure frequency in epileptic pilocarpine-treated mice. Timm staining of the dentate gyrus from a control (a1) and epileptic mouse (a2). Sections are 50% of the distance from the septal pole to the temporal pole of the hippocampus. g = granule cell layer; h = hilus; m = molecular layer. Mossy fiber sprouting is evident as black Timm staining in the granule cell layer and inner molecular layer in the epileptic mouse (arrows). (b) High correlation (slope = 1.049, R = 0.961, p <0.001, Spearman rank order correlation) between the percent area of the granule cell layer plus molecular layer with black Timm staining measured two ways: (1) as the average of three sections (17, 50, and 84% of the distance from the septal pole to the temporal pole) and (2) as the average of the entire 1-in-12 series of sections. Data from Buckmaster and Lew (2011), Lew and Buckmaster (2011), and Heng et al. (2013). (c) Septotemporal distribution of percent Timm-positive area. Values represent mean ± SEM. (d) Larger percent Timm-positive area in epileptic pilocarpine-treated mice (n = 114) compared to controls (n = 10, p ≤ 0.001, Mann–Whitney rank sum test). (e) Significant negative correlation between percent Timm-positive area and number of large (>12 μm soma diameter) hilar GluR2-positive neurons per dentate gyrus (R = 0.515, p <0.001, ANOVA). (f) No significant correlation between percent Timm-positive area and seizure frequency (R = 0.178, p = 0.058, ANOVA)
FIGURE 6
FIGURE 6
No significant correlation between astrogliosis and seizure frequency in epileptic pilocarpine-treated mice. GFAP-immunostaining of the dentate gyrus in a control (a1) and epileptic mouse (a2). The dentate gyrus is larger and GFAP-immunoreactivity is increased in the epileptic mouse. Sections are 38% of the distance from the septal pole to the temporal pole of the hippocampus. g = granule cell layer; h = hilus; m = molecular layer. (b) The percent area of the dentate gyrus that was GFAP-positive was larger in epileptic mice (n = 103) compared to controls (n = 7, p <0.001, t test). (c) Septotemporal distribution of percent area that was GFAP-positive. Values represent mean ± SEM. (d) No significant correlation between percent area that was GFAP-positive and seizure frequency (R = 0.116, p = 0.244, Spearman rank order correlation)
FIGURE 7
FIGURE 7
Significant negative correlation between the number of GABAergic neurons in the dentate gyrus and seizure frequency in epileptic pilocarpine-treated mice. GAD in situ hybridization in sections of the dentate gyrus in a control (a1) and epileptic mouse (a2). The dentate gyrus is larger in the epileptic mouse. There are fewer GAD-positive neurons, but they are labeled more intensely in the epileptic mouse. Sections are 75% of the distance from the septal pole to the temporal pole of the hippocampus. g = granule cell layer; h = hilus; m = molecular layer. (b) High correlation between the number of hilar GAD-positive cell body profiles counted and the number of GAD-positive neurons per dentate gyrus estimated by the optical fractionator method in a subset of mice in this study (R = 0.977, p <0.001, ANOVA). (c) Fewer total GAD-positive neurons per dentate gyrus in epileptic mice (n = 122) compared to controls (n = 10, p <0.001, t test). (d) Septotemporal distribution of GAD-positive cell body profiles per section. Values represent mean ± SEM. (e) Significant negative correlation between the total number of GAD-positive neurons per dentate gyrus and seizure frequency (R = 0.199, p = 0.029, ANOVA). (f) No significant difference in the number of GAD-positive neurons in the molecular layer per dentate gyrus in epileptic mice compared to controls (p = 0.999, t test). (g) Septotemporal distribution of molecular layer GAD-positive cell body profiles per section. (h) No significant correlation between the total number of molecular layer GAD-positive neurons per dentate gyrus and seizure frequency (R = 0.129, p = 0.160, ANOVA). (i) Fewer GAD-positive neurons in the granule cell layer per dentate gyrus in epileptic mice compared to controls (p <0.001, t test). (j) Septotemporal distribution of granule cell layer GAD-positive cell body profiles per section. (k) Significant negative correlation between the number of granule cell layer GAD-positive neurons per dentate gyrus and seizure frequency (R = 0.229, p = 0.012, ANOVA). (l) Fewer GAD-positive neurons in the hilus per dentate gyrus in epileptic mice compared to controls (p <0.001, Mann–Whitney rank sum test). (m) Septotemporal distribution of hilar GAD-positive cell body profiles per section. (n) No significant correlation between the number of hilar GAD-positive neurons per dentate gyrus and seizure frequency (R = 0.001, p = 0.996, ANOVA)
FIGURE 8
FIGURE 8
No significant correlation between the number of parvalbumin-positive interneurons in the dentate gyrus and seizure frequency in epileptic pilocarpine-treated mice. Parvalbumin-immunostaining of the dentate gyrus in a control (a1) and epileptic mouse (a2). The dentate gyrus is larger but contains fewer parvalbumin-positive neurons in the epileptic mouse. Sections are 45% of the distance from the septal pole to the temporal pole of the hippocampus. g = granule cell layer; h = hilus; m = molecular layer. (b) High correlation between the number of parvalbumin-positive cell body profiles counted and the number of parvalbumin-positive neurons per dentate gyrus estimated by the optical fractionator method in a subset of mice from this study (R = 0.985, p <0.001, ANOVA). (c) Septotemporal distribution of parvalbumin-positive cell body profiles per section. Values represent mean ± SEM. (d) Fewer parvalbumin-positive neurons per dentate gyrus in epileptic mice (n = 122) compared to controls (n = 8, p <0.001, t test). (e) No significant correlation between the number of parvalbumin-positive neurons per dentate gyrus and seizure frequency (R = 0.002, p = 0.979, ANOVA)
FIGURE 9
FIGURE 9
Significant correlation between perfusion age and seizure frequency in epileptic pilocarpine-treated mice (R = 0.302, p <0.001, ANOVA) (a). (b) No significant correlation between duration of seizure monitoring and seizure frequency (R = −0.169, p = 0.061, Spearman rank order correlation). (c) Significant correlation between seizure frequency and time from pilocarpine treatment to seizure monitoring (R = 0.274, p = 0.002, ANOVA)

References

    1. Andrioli A, Alonso-Nanclares L, Arellano JI, DeFilipe J. Quantitative analysis of parvalbumin-immunoreactive cells in the human epileptic hippocampus. Neuroscience. 2007;149:131–143. - PubMed
    1. Austin JE, Buckmaster PS. Recurrent excitation of granule cells with basal dendrites and low interneuron density and inhibitory postsynaptic current frequency in the dentate gyrus of macaque monkeys. The Journal of Comparative Neurology. 2004;476:205–218. - PubMed
    1. Babb TL, Brown WJ, Pretorius J, Davenport C, Lieb JP, Crandall PH. Temporal lobe volumetric cell densities in temporal lobe epilepsy. Epilepsia. 1984;25:729–740. - PubMed
    1. Babb TL, Kupfer WR, Pretorius JK, Crandall PH, Levesque MF. Synaptic reorganization by mossy fibers in human epileptic fascia dentata. Neuroscience. 1991;42:351–363. - PubMed
    1. Babb TL, Pretorius JK, Kupfer WR, Crandall PH. Glutamate decarboxylase-immunoreactive neurons are preserved in human epileptic hippocampus. The Journal of Neuroscience. 1989;9:2562–2574. - PMC - PubMed