. 2017 Apr 20:8:15031.
doi: 10.1038/ncomms15031.

FRET biosensor uncovers cAMP nano-domains at β-adrenergic targets that dictate precise tuning of cardiac contractility

Affiliations

FRET biosensor uncovers cAMP nano-domains at β-adrenergic targets that dictate precise tuning of cardiac contractility

Nicoletta C Surdo et al. Nat Commun. .

Abstract

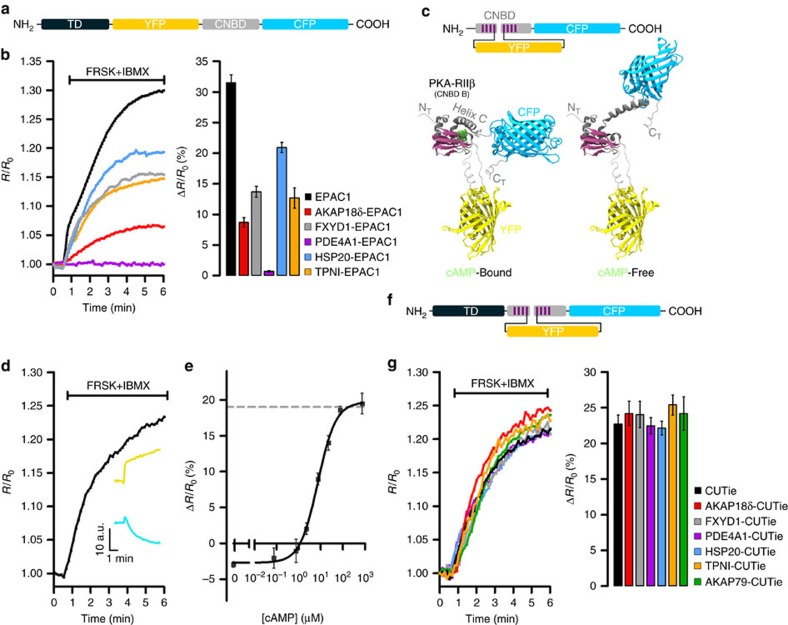
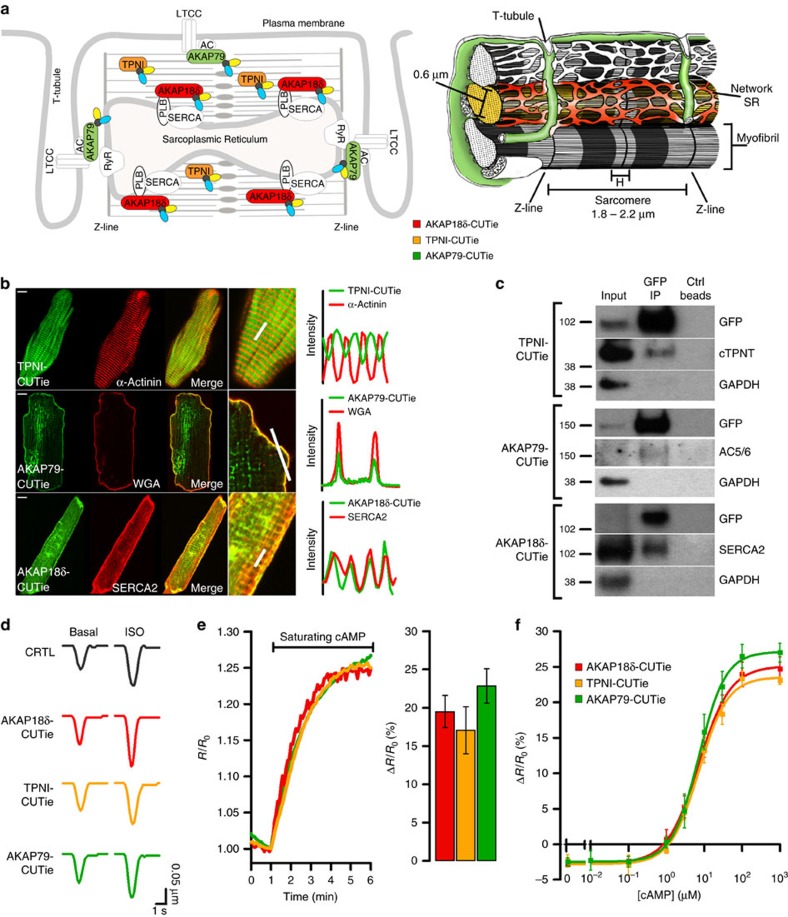
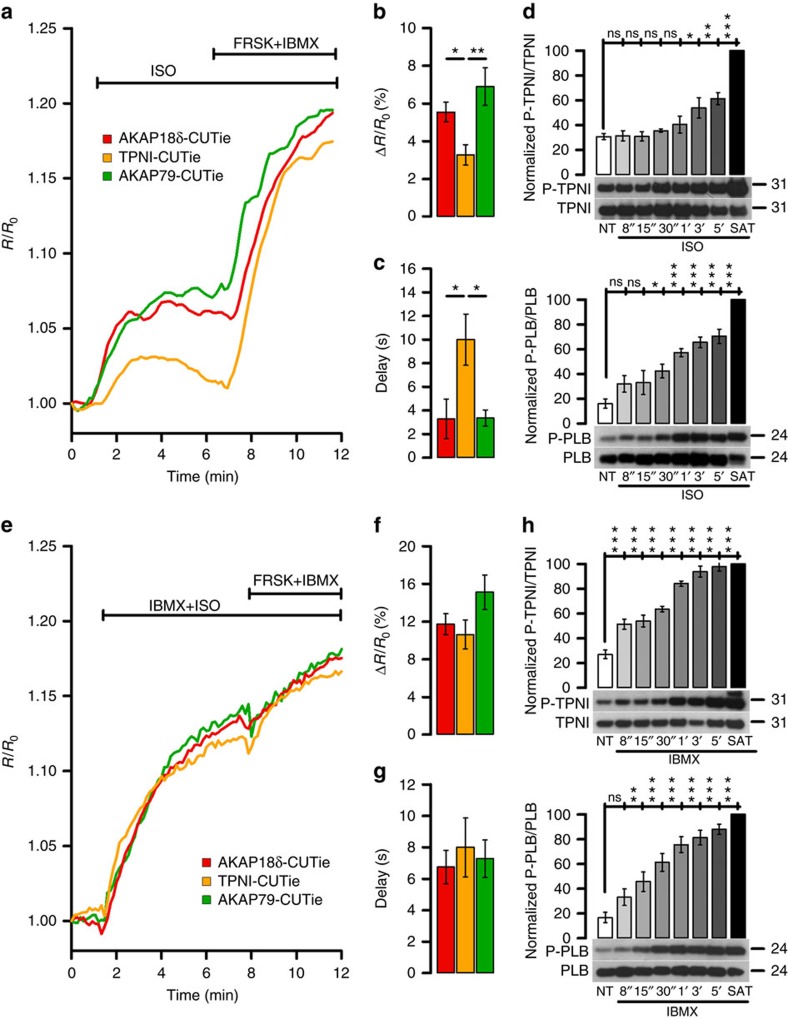
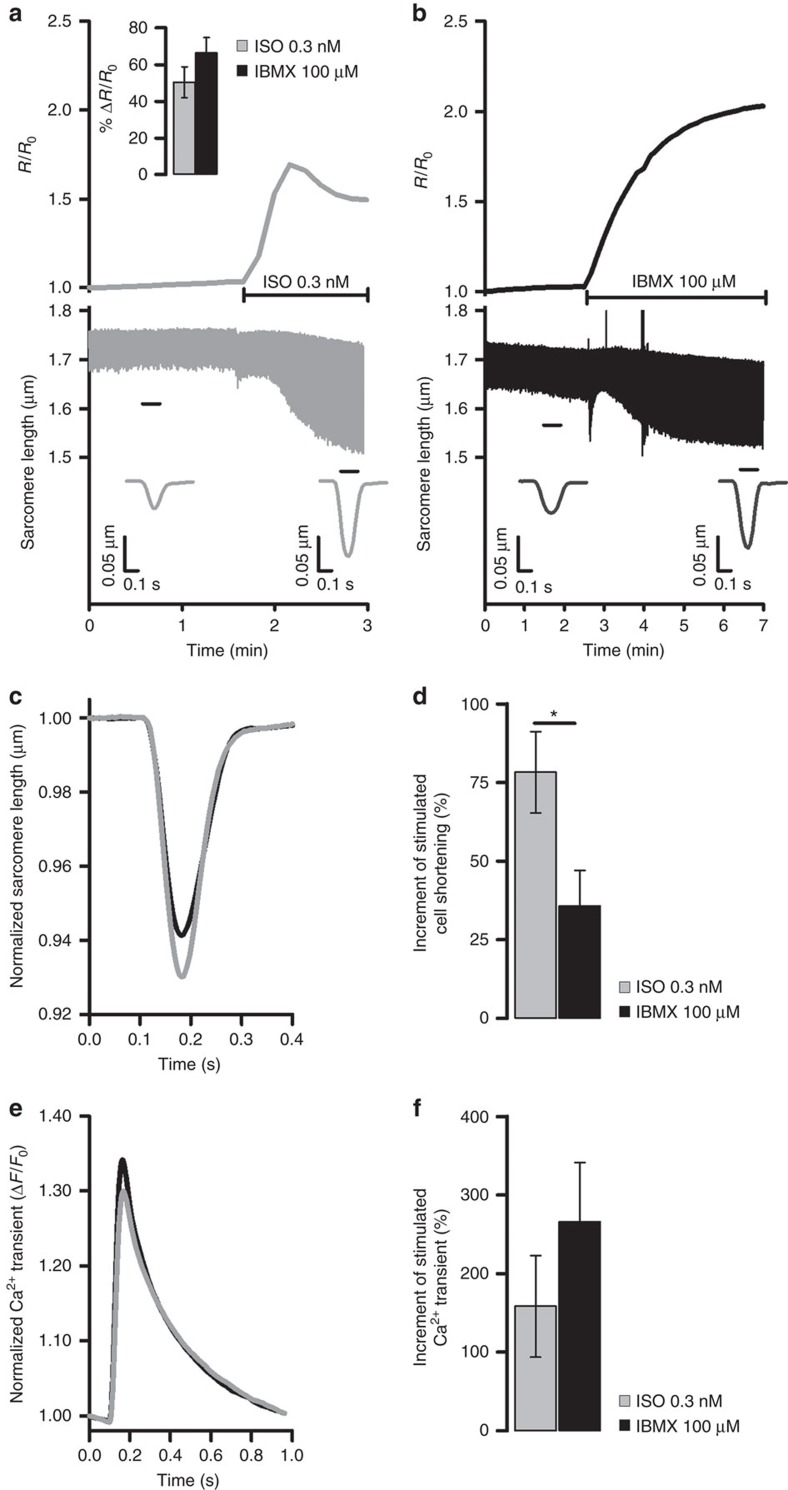
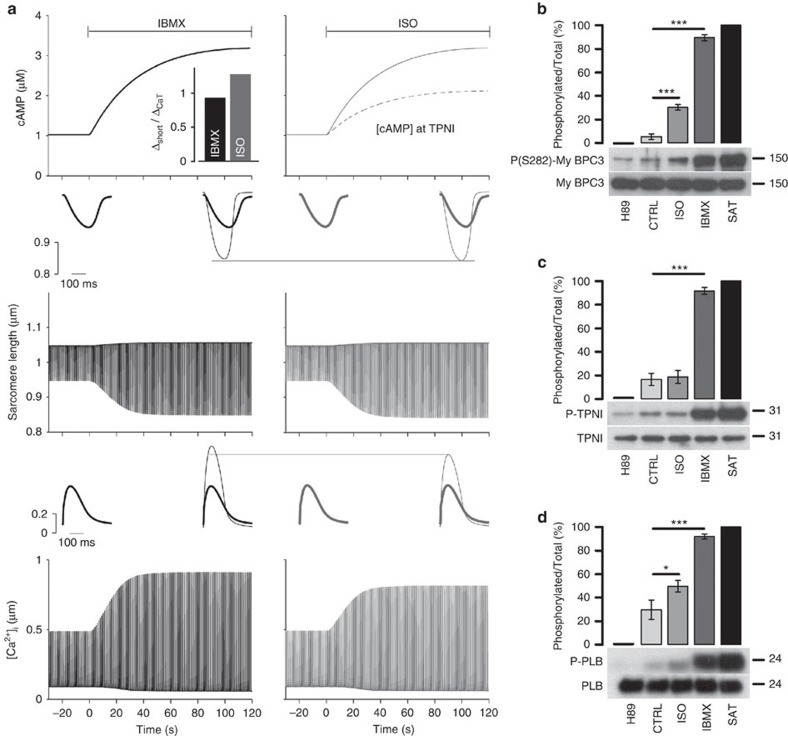
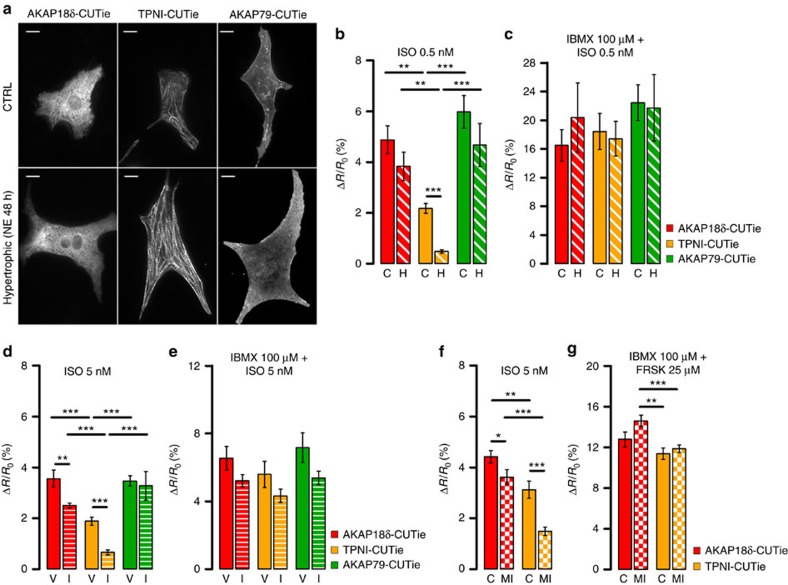
Compartmentalized cAMP/PKA signalling is now recognized as important for physiology and pathophysiology, yet a detailed understanding of the properties, regulation and function of local cAMP/PKA signals is lacking. Here we present a fluorescence resonance energy transfer (FRET)-based sensor, CUTie, which detects compartmentalized cAMP with unprecedented accuracy. CUTie, targeted to specific multiprotein complexes at discrete plasmalemmal, sarcoplasmic reticular and myofilament sites, reveals differential kinetics and amplitudes of localized cAMP signals. This nanoscopic heterogeneity of cAMP signals is necessary to optimize cardiac contractility upon adrenergic activation. At low adrenergic levels, and those mimicking heart failure, differential local cAMP responses are exacerbated, with near abolition of cAMP signalling at certain locations. This work provides tools and fundamental mechanistic insights into subcellular adrenergic signalling in normal and pathological cardiac function.


Conflict of interest statement

The authors declare no competing financial interests.

Figures

Figure 1
Figure 1. Generation of a universal FRET-tag for cAMP detection at specific macromolecular complexes.
(a) Schematic representation of the targeted Epac1-camps chimeras. CNBD, cyclic nucleotide binding domain; TD, targeting domain. (b) Representative kinetics of cAMP change (left panel) and summary of the experiments performed (right panel) in CHO cells expressing untargeted Epac1-camps (EPAC1) or its targeted versions upon application of the adenylyl cyclase activator forskolin (FRSK, 25 μM) and the phosphodiesterase inhibitor 3-isobutyl-1-methylxanthine (IBMX, 100 μM), a treatment that generates an intracellular amount of cAMP that saturates Epac1-cAMPs (ref. 27). AKAP18δ, A-kinase anchoring protein 18δ (ref. 17); FXYD1, phospholemman; HSP20, heat shock protein 20; TPNI, troponin I; PDE4A1, phosphodiesterase 4A1. Bars show FRET change at saturation. N≥5 from at least five independent experiments, all samples are significantly different from each other by one-way ANOVA and Bonferroni post hoc test, P≤0.05, except FXYD1-EPAC1 versus TPNI-EPAC1, which is not significant. (c) Top: schematic representation of CUTie. Bottom: ribbon representation of the predicted molecular structures of CUTie in its cAMP-bound or cAMP-free forms. cAMP is shown in green. (d) Representative kinetics of FRET change and corresponding CFP and YFP emission intensity curves (inset) recorded in a CHO cell expressing CUTie and treated with a saturating stimulus. (e) Concentration–response calibration curve generated using CHO cells expressing CUTie and microinfusion of known concentrations of cAMP via a patch pipette. EC50=7.4 μM, sensitivity range between 0.5 μM and 50 μM. Hill coefficient is 1.07. Broken line indicates maximal FRET change as predicted by MD simulations. (f) Schematic representation of CUTie chimeras. For each concentration point N≥5 from at least five independent experiments. (g) Representative kinetics of FRET change (left panel) and mean maximal FRET change (right panel) recorded at saturation. N≥10 from three independent experiments. One-way ANOVA analysis with Bonferroni's post hoc correction shows no significant difference between all samples. AKAP79, A-kinase anchoring protein 79. All values are means±s.e.m.
Figure 2
Figure 2. Targeting of CUTie to cardiac myocyte subcellular sites.
(a) Schematic representation of a portion of a cardiac myocyte in 2-D (left) and 3-D (right). In the panel on the right three myofibrils are shown, for two of which the sarcoplasmic reticulum (SR) surrounding individual myofibrils is depicted. The plasmalemma and its invaginations in T-tubules, which run along the Z-lines delimiting individual sarcomeres, are also shown. Colour shaded areas indicate the expected localization of targeted reporters. For clarity, only representative areas have been shaded. AKAP79-CUTie (green) is targeted to the surface of the plasmalemma facing the intracellular space; AKAP18δ (red) is targeted to the network SR surrounding individual myofibrils where SERCA also localize; TPNI-CUTie (yellow) localizes to the myofilaments constituting individual myofibrils, with exclusion of the Z-lines and the H zone. α-actinin localizes to the Z-line. Dimensions are from (ref. 54), 3-D schematic representation modified from (ref. 55). (b) Confocal images of ARVM expressing TPNI-CUTie, AKAP79-CUTie or AKAP18δ-CUTie showing the localization of the sensor relative to the localization of α-actinin, wheat germ agglutinine (WGA) and SERCA2, respectively. Scale bar: 10 μm. A merge of two images and a magnified detail for each cell are also shown. On the right, the fluorescence intensity profiles for the indicated targeted sensors (green) and the reference signal (red) are shown. Intensities were calculated along the line indicated in the zoomed-in images. (c) Western blotting analysis of proteins in complex with targeted CUTie. ARVM were infected with adenovirus carrying TPNI-CUTie, AKAP18δ-CUTie or AKAP79-CUTie. Targeted CUTie chimeras and their interacting proteins were pulled down using GFP beads. Membranes were probed with the antibodies indicated on the right of each panel. (d) Representative kinetics of sarcomere shortening recorded in ARVM expressing the targeted CUTie sensors in basal conditions (left) and on application of ISO 1 nM (right). Representative of at least four biological replicates. (e) Representative kinetics of cAMP change recorded in NRVM microinfused with 1 mM cAMP and 100 μM IBMX via a glass pipette (left panel) and mean maximal FRET change±s.e.m. at saturation for all measurements performed (right panel). N≥10 from three biological replicates. No significant difference by one-way ANOVA and Bonferroni's post hoc test. (f) Concentration–response calibration curves generated by microinfusion of known concentrations of cAMP in CHO cells stably expressing TPNI-CUTie, AKAP18δ-CUTie or AKAP79-CUTie. For each concentration point N≥5.
Figure 3
Figure 3. Differential regulation of the cAMP signal at different β-adrenergic targets.
(a) Representative kinetics and summary (b) of FRET change recorded in ARVM individually expressing AKAP18δ-CUTie, TPNI-CUTie or AKAP79-CUTie in response to bath application of 5 nM ISO. One-way ANOVA with Bonferroni's post-hoc correction. (c) Delay from application of 5 nM ISO to first time point at which a FRET change was detected for all experiments performed as in a. One-way ANOVA with Bonferroni's post hoc correction. (d) Time course of TPNI (top) and PLB (bottom) phosphorylation on application of 1 nM ISO to NRVMs. The level of phosphorylation on application of a saturating stimulus (SAT: 25 μM FRSK+100 μM IBMX) for 10 min is also shown. NT, no treatment. N=5 biological replicates. One-way ANOVA with Dunnett's post hoc correction (all columns versus NT column). (e) Representative kinetics and summary (f) of FRET change recorded in ARVM individually expressing AKAP18δ-CUTie, TPNI-CUTie or AKAP79-CUTie in response to bath application of 1 nM ISO in combination with 100 μM IBMX. One-way ANOVA with Bonferroni's post hoc correction. (g) Delay from application of 1 nM ISO+100 μM IBMX to first time point at which a FRET change was detected for all experiments performed as in e. (h) Time course of TPNI (top) and PLB (bottom) phosphorylation on application of 100 μM IBMX to NRVM. N=5 biological replicates. One-way ANOVA with Dunnett's post hoc correction (all columns versus NT column). Bars indicate means±s.e.m. For (b,c,f,g) N≥7 from at least N=5 biological replicates. *P≤0.05, **P≤0.01, ***P≤0.001.
Figure 4
Figure 4. Differential local regulation of cAMP signals is necessary for maximal stimulated inotropy.
(a) Representative time course of global cytosolic cAMP change (top) and sarcomere shortening (bottom) recorded simultaneously in the same ARVM expressing the cytosolic FRET reporter EPAC-SH187 on application of 0.3 nM ISO or (b) 100 μM IBMX. Inset at the top of a shows mean FRET change measured in ARVM expressing the cytosolic FRET reporter EPAC-SH187 on application of 0.3 nM ISO or 100 μM IBMX. Bars are means±s.e.m., no significant difference by unpaired t-test. In a,b cells were paced at 1 Hz. Inserts at the bottom of a,b indicate sarcomere shortening kinetics averaged over the time interval indicated by the black bar. (c) Normalized mean sarcomere shortening kinetics measured at steady state after the application of ISO (0.3 nM) or IBMX (100 μM), as indicated. (d) Effect of 0.3 nM ISO or 100 μM IBMX on sarcomere shortening measured in all experiments as shown in a,b. Shortening is expressed as percent increment over control (before the stimulus) calculated as (Δ shortening/shorteningcontrol) × 100, where Δ shortening=(shorteningstimulated–shorteningcontrol). Unpaired t-test. (e) Averaged normalized Ca2+ transient recorded on application of 0.3 nM ISO or 100 μM IBMX. N≥6. (f) Effect of 0.3 nM ISO or 100 μM IBMX on the amplitude of the Ca2+ transient expressed as percent increase over control (before the stimulus). Unpaired t-test shows no significant difference. Bars are means±s.e.m. *P≤0.05. For all experiments N≥6 from at least three biological replicates.
Figure 5
Figure 5. Mathematical model of compartmentalized cAMP signalling.
(a) Simulated cAMP rise (top), myocyte shortening (middle) and Ca2+ transient (bottom) upon administration of IBMX or ISO at time=0 s. Inset at the left shows baseline condition, and inset at right shows overlapping baseline condition (grey) and steady-state response to cAMP increase. Bar graph in a shows the ratio of the increase in maximal shortening to increase in Ca2+ transient amplitude induced by IBMX and ISO. (b) Western blotting analysis of cell lysates obtained from ARVM treated with H89 (30 μM), vehicle (CTRL), ISO (0.3 nM), IBMX (100 μM) or 25 μM FRSK+100 μM IBMX (SAT) for 10 min. Membranes were probed for total and phosphorylated MyBPC (b), TPNI (c) and PLB (d). Graphs show densitometric analysis and present the ratio value of phosphorylated to total protein expressed as percentage after normalization to H89 treatment (taken as zero) and to maximal phosphorylation at saturation (taken as 100%). Values are means±s.e.m. *P≤0.05, ***P≤0.001. N≥8 independent experiments from at least five biological replicates. One-way ANOVA with Dunnett's post hoc correction.
Figure 6
Figure 6. Compartmentalized cAMP signalling in hypertrophic cells.
(a) Localization of the targeted CUTie reporters in control (top) and hypertrophic (bottom) NRVM. Scale bar: 10 μm. Average cell size for control myocytes was 351.8±7.3 μm2 and for hypertrophic myocytes 674.9±14.8 μm2 (N≥216 cells from five biological replicates, P≤0.001). (b) Mean FRET change measured with targeted CUTie reporters in control (C) and hypertrophic (H) NRVM on application of 0.5 nM ISO and (c) 0.5 nM ISO in the presence of 100 μM IBMX. N≥6 from five biological replicates. (d) Mean FRET change measured with targeted CUTie reporters in isolated ARVM from minipump vehicle- (V) and ISO-infused (I) rats, on application of 5 nM ISO and (e) 5 nM ISO in the presence of 100 μM IBMX. N≥8 from at least six biological replicates. Bars indicate means±s.e.m. Unpaired t-test. (f) Mean FRET change measured with targeted CUTie reporters in isolated ARVM from age-matched control (C) and rats subjected to myocardial infarction (MI) at 16 weeks after coronary artery ligation, on application of 5 nM ISO and (e) saturating stimulus. N≥16 from at least seven biological replicates. In all graphs bars indicate means±s.e.m. Unpaired t-test applied for comparison between treatment groups, one-way ANOVA and Bonferroni's post hoc test for comparison among sensors. *P≤0.05, **P≤0.01, ***P≤0.001.

Similar articles

Cited by

References

    1. Bers D. M. Cardiac excitation-contraction coupling. Nature 415, 198–205 (2002). - PubMed
    1. Zaccolo M. cAMP signal transduction in the heart: understanding spatial control for the development of novel therapeutic strategies. Br. J. Pharmacol. 158, 50–60 (2009). - PMC - PubMed
    1. Cheepala S. et al.. Cyclic nucleotide compartmentalization: contributions of phosphodiesterases and ATP-binding cassette transporters. Ann. Rev. Pharmacol. Toxicol. 53, 231–253 (2013). - PMC - PubMed
    1. Zaccolo M. & Pozzan T. Discrete microdomains with high concentration of cAMP in stimulated rat neonatal cardiac myocytes. Science 295, 1711–1715 (2002). - PubMed
    1. Di Benedetto G. et al.. Protein kinase A type I and type II define distinct intracellular signaling compartments. Circ. Res. 103, 836–844 (2008). - PubMed

Publication types

MeSH terms