. 2017 Apr 20:7:46575.
doi: 10.1038/srep46575.

Oncogenic activity of SOX1 in glioblastoma

Affiliations

Oncogenic activity of SOX1 in glioblastoma

Idoia Garcia et al. Sci Rep. .

Abstract

Glioblastoma remains the most common and deadliest type of brain tumor and contains a population of self-renewing, highly tumorigenic glioma stem cells (GSCs), which contributes to tumor initiation and treatment resistance. Developmental programs participating in tissue development and homeostasis re-emerge in GSCs, supporting the development and progression of glioblastoma. SOX1 plays an important role in neural development and neural progenitor pool maintenance. Its impact on glioblastoma remains largely unknown. In this study, we have found that high levels of SOX1 observed in a subset of patients correlate with lower overall survival. At the cellular level, SOX1 expression is elevated in patient-derived GSCs and it is also higher in oncosphere culture compared to differentiation conditions in conventional glioblastoma cell lines. Moreover, genetic inhibition of SOX1 in patient-derived GSCs and conventional cell lines decreases self-renewal and proliferative capacity in vitro and tumor initiation and growth in vivo. Contrarily, SOX1 over-expression moderately promotes self-renewal and proliferation in GSCs. These functions seem to be independent of its activity as Wnt/β-catenin signaling regulator. In summary, these results identify a functional role for SOX1 in regulating glioma cell heterogeneity and plasticity, and suggest SOX1 as a potential target in the GSC population in glioblastoma.


Conflict of interest statement

The authors declare no competing financial interests.

Figures
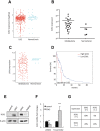
Figure 1
Figure 1. High levels of SOX1 are associated to poor clinical outcome and correlate with SOX2.
(A) Boxplot of the log2 of the FPKM of LGG (low grade glioma) vs normal brain samples in TGCA. Wilcoxon test, p value = 0.17. (B) SOX1 mRNA expression levels in GBM samples from Hospital Donostia and normal brain samples. (C) Boxplot of the log2 of the FPKM of glioblastoma vs normal brain samples in TGCA. The number of available RNAseq samples for glioblastoma is smaller than for LGG. Wilcoxon test, p value = 0.068. (D) Kaplan–Meier curves for the TCGA patient overall survival rates based on SOX1 expression obtained from cbioportal. LogRank Test p = 0.02. (E) SOX2 protein expression in U87 cells transduced with ectopic SOX2 and U251 cells infected with shSOX2 and (F) SOX1 mRNA levels in the indicated cells. qRT-PCR data are normalized to GAPDH expression and are expressed relative to the control condition (n ≥ 3). (G) Analysis of the correlation of SOX2 and SOX1 expression in human glioblastoma samples. Fisher exact test p < 0.05.
Figure 2
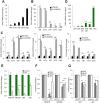
Figure 2. SOX1 enrichment in glioma stem cell populations.
(A) SOX1 mRNA levels in the indicated glioma cell lines showing different expression levels among them (n ≥ 3). (B) SOX1 levels in each cell line grown in stem cell medium (oncospheres) relative to in serum (adherent) (n ≥ 2). (C) mRNA levels of the indicated stem cell markers grown in serum and stem cell medium (n ≥ 2). (D) SOX1 expression levels in U87 and U251 conventional cell lines and 4 patient derived GSC lines, the expression is relative to U87 cell line (n ≥ 3). (E) SOX1 levels in four GSC lines grown in stem cell medium (control) compared to differentiation conditions (diff) (n ≥ 2). (F,G) mRNA levels of the indicated stem cell markers grown in stem cell medium (control) compared to differentiation conditions (diff) in GNS and GB cells respectively (n ≥ 2). qRT-PCR data are normalized to GAPDH expression.
Figure 3
Figure 3. SOX1 knockdown impairs self-renewal and tumor growth in GSCs.
(A) SOX1 mRNA expression in control (pLKO) and shSOX1 (sh1 and sh5) GNS166 (n ≥ 2). (B) Cell growth at day 5 comparing pLKO and shSOX1 GNS166 cells (n = 3). (C) MTT studies measuring cell viability in shSOX1 relative to control GNS166 cells (n = 3). (D) Representative image and quantification of number of p-H3 positive cells in pLKO and shSOX1 transduced GNS166 cells (n = 3). (E) mRNA levels of the indicated stem cell markers in sh1 and sh5 GNS166 cells relative to control expression (n ≥ 2). (F) GFAP and p27Kip mRNA levels in the indicated cell conditions (n ≥ 2). (G) Kaplan-Meier curve representing the survival of NOD-SCID mice that were xenotransplantated with control (n = 9) and sh1 (n = 4) GNS 166 cells.
Figure 4
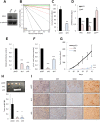
Figure 4. SOX1 knockdown in the U251 glioma cell line decreases tumor initiation and progression.
(A) Representative western blotting of SOX1 protein expression in U251 cells infected with pLKO or sh1 (n = 3). (B) Frequency of tumor initiation after subcutaneous injection in nude mice of 5 × 105 and 5 × 104 U251 cells transduced with pLKO, sh1 or sh5. The incidence of tumor initiation was measured using the ELDA platform. (C) Quantification of the number of spheres formed from the indicated conditions (n = 3). (D) mRNA levels of the indicated genes in sh1 U251 cells relative to empty vector (n = 3). (E) Cell growth of U251 cells transduced with sh1 and sh5 relative to pLKO cells (n = 3). (F) Quantification of the number of p-H3 positive cells in the same conditions (n = 3). (G) Volume of tumors generated after subcutaneous injection of U251 pLKO, sh1 or sh5 cells (n = 12) at the indicated time-points. (H) Picture and average weight of the tumors generated in (G). (I) Representative images of the immunohistochemical staining of KI67, SOX1, SOX2 and PML in tumors from G (n = 4).
Figure 5
Figure 5. SOX1 is not regulating the WNT signaling pathway in glioblastoma.
(A) Representative images of CTNNB1 (β-catenin) immunofluorescence staining in U251 plko and sh1 cells (n = 4). (B) Representative images of CTNNB1 immunohistochemical staining in U251 pLKO, sh1 and sh5 derived tumors (n = 4). (C) mRNA levels of CTNNB1, CCND1 (CYCLIN D1) and MYC in GNS166 pLKO and sh1 cells. qRT-PCR data are normalized to GAPDH expression (n ≥ 2). (D) Scatter plot of log2 of the FPKM of CTNNB1, MYC and CCND1 vs SOX1 expression. In the x-axis, the correlation and its statistical significance are included. Only CCND1 has a significant correlation with SOX1.
Figure 6
Figure 6. SOX1 overexpression contributes to the malignant phenotype in GSCs.
(A) SOX1 and SOX2 protein expression in GNS166 cells transduced with ectopic SOX1 (n = 3). (B) mRNA levels of the indicated stem cell markers in GNS166 cells transduced with SOX1 relative to control (GFP) expression (n ≥ 3). (C) mRNA levels of the indicated differentiation markers in the same cells (n ≥ 3). (D) Cell growth at day 5 comparing control (GFP) and SOX1 overexpressing GNS166 cells (n = 6). (E) Representative image and quantification of the number of p-H3 positive cells in SOX1 transduced GNS166 cells compared to control (GFP) condition (n = 6).

References

    1. Ostrom Q. T. et al.. The epidemiology of glioma in adults: a “state of the science” review. Neuro Oncol 16, 896–913 (2014). - PMC - PubMed
    1. Phillips H. S. et al.. Molecular subclasses of high-grade glioma predict prognosis, delineate a pattern of disease progression, and resemble stages in neurogenesis. Cancer Cell 9, 157–173 (2006). - PubMed
    1. Verhaak R. G. et al.. Integrated genomic analysis identifies clinically relevant subtypes of glioblastoma characterized by abnormalities in PDGFRA, IDH1, EGFR, and NF1. Cancer Cell 17, 98–110 (2010). - PMC - PubMed
    1. Patel A. P. et al.. Single-cell RNA-seq highlights intratumoral heterogeneity in primary glioblastoma. Science 344, 1396–1401 (2014). - PMC - PubMed
    1. Suva M. L., Riggi N. & Bernstein B. E. Epigenetic reprogramming in cancer. Science 339, 1567–1570 (2013). - PMC - PubMed

Publication types

MeSH terms

Substances