. 2017 Apr 3;6(2):134-140.
doi: 10.1080/21623945.2017.1287639. Epub 2017 Jan 27.

Adipocyte hypertrophy-hyperplasia balance contributes to weight loss after bariatric surgery

Affiliations

Adipocyte hypertrophy-hyperplasia balance contributes to weight loss after bariatric surgery

Lindsey A Muir et al. Adipocyte. .

Abstract

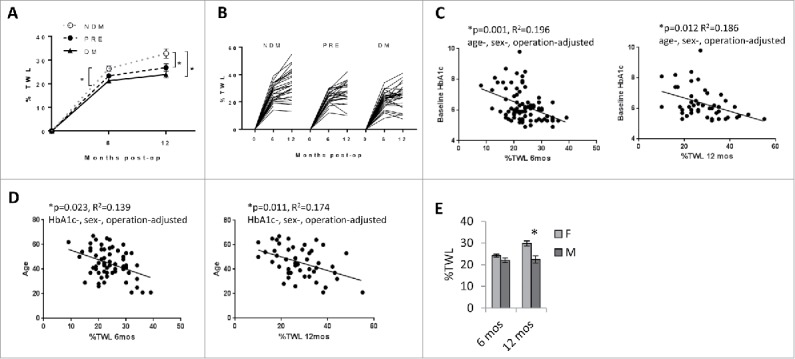
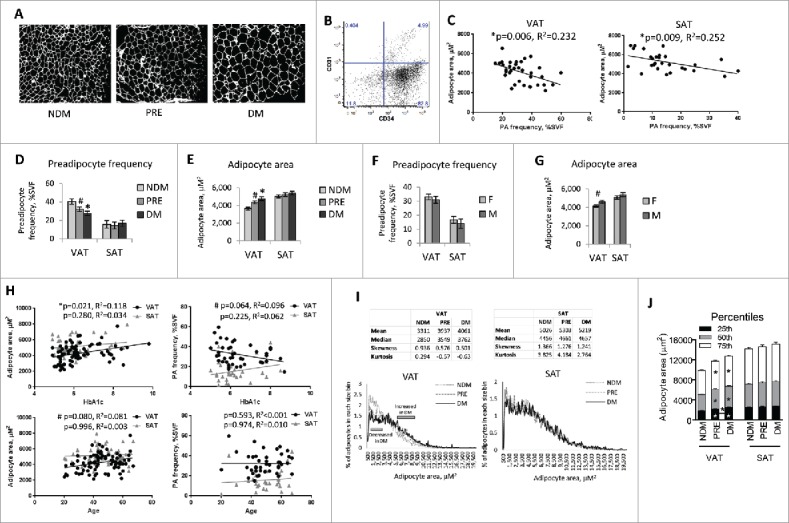
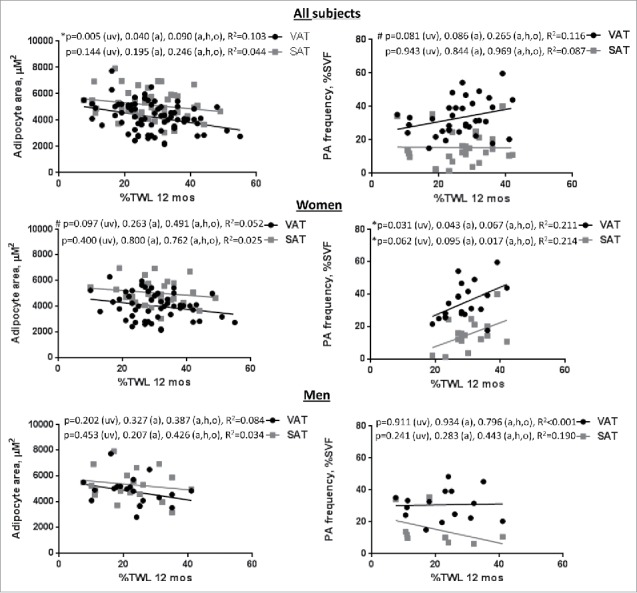
Predictors of weight loss responses are not well-defined. We hypothesized that adipose tissue phenotypic features related to remodeling would be associated with bariatric surgery weight loss responses. Visceral and subcutaneous adipose tissues collected from patients during bariatric surgery were studied with flow cytometry, immunohistochemistry, and QRTPCR, and results correlated with weight loss outcomes. Age, male sex, and a diagnosis of type 2 diabetes were associated with less weight loss. Adipocyte size was increased and preadipocyte frequency was decreased in visceral adipose tissue from diabetic subjects. Decreased adipose tissue preadipocyte frequency was associated with less weight loss in women but not men. These data suggest that phenotypic features of adipose tissue remodeling may predict responses to weight loss interventions.

Keywords: adipose tissue; bariatric surgery; diabetes; hypertrophy; preadipocyte; weight loss.


Figures

Figure 1.
Figure 1.
Clinical correlates of surgery-induced weight loss: A. Weight loss is less in DM subjects: %TWL stratified by DM status; *p<0.05 comparing indicated data points at 12 months (PRE or DM) to NDM arm, age-, sex-, operation-adjusted. n = 87 and 83 subjects for 6-month and 12-month %TWL respectively. Error bars represent standard error of mean. B. Range of surgery-induced weight loss in the entire cohort: %TWL 6 and 12 months after bariatric surgery in NDM, PRE, and DM subjects. C. Weight loss correlates inversely with HbA1c: Correlations in all subjects of %TWL with serum HbA1c levels; p-values shown are age-, sex-, operation-adjusted. D. Weight loss correlates inversely with age: Correlations in all subjects of %TWL with age; p-values shown are HbA1c-, sex-, operation-adjusted. E. Weight loss is less in men: %TWL in all subjects stratified by sex; *p = 0.013, age-, HbA1c-, operation-adjusted. n = 25, 24 men and 62, 59 women for 6-month and 12-month %TWL respectively. Error bars represent standard error of mean.
Figure 2.
Figure 2.
Adipose tissue-based correlates of DM: A. Histologic assessment of adipocyte hypertrophy: Representative fluorescence images in Texas Red channel (595–605 nM) of fixed H&E-stained sectioned adipose tissue used for Image-J reconstruction from NDM, PRE, and DM subjects; adipocyte area measured in 200–500 cells from multiple slides per subject. B. Preadipocyte flow cytometry scatterplot: CD34/CD31 staining within the parent CD45 gate. Preadipocytes are defined as CD45CD34+CD31 using fluorescence-minus-one controls, quantified as % of all SVF cells after exclusion of doublets and non-viable cells. Antibodies: CD45-FITC, CD31-APC-Cy7, CD34-PerCP-Cy5.5, anti-rabbit-IgG secondary antibody-PE (Biolegend Inc., San Diego, CA, USA). C. Adipocyte hypertrophy and preadipocyte frequency are reciprocally related: Correlations in all subjects of adipocyte area (μM2) with preadipocyte frequency (% all SVF cells); p-values shown are age-, sex-adjusted. D. Preadipocyte frequency is decreased in VAT from DM subjects: Ordinate: preadipocyte frequency as % SVF cells; *: p = 0.004, #:p = 0.051, comparing indicated data point (PRE or DM) to NDM arm, age-, sex-adjusted; n = 11 NDM, 14 PRE, 17 DM subjects for VAT, n = 9 NDM, 9 PRE, 12 DM subjects for SAT. Error bars represent standard error of mean. E. Adipocyte hypertrophy is increased in VAT from DM subjects: Ordinate: adipocyte area (μM2); *: p = 0.002, #: p = 0.102, comparing indicated data point (PRE or DM) to NDM arm, age-, sex-adjusted; n = 31 NDM, 24 PRE, 34 DM subjects for VAT, n = 22 NDM, 17 PRE, 17 DM subjects for SAT. Error bars represent standard error of mean. F. Preadipocyte frequency is similar in men and women: Ordinate: preadipocyte frequency as % SVF cells; no differences observed between men (M) and women (F) with age-, HbA1c-adjustment; n = 17 male, 25 female subjects for VAT, 11 men, 19 women for SAT. Error bars represent standard error of mean. G. Adipocyte hypertrophy is increased in VAT from male subjects: Ordinate; adipocyte area (μM2); #: p = 0.066, comparing men (M) and women (F), age-, HbA1c-adjusted; n = 26 men, 60 women for VAT, 22 men, 33 women for SAT. Error bars represent standard error of mean. H. Correlations of adipocyte size and preadipocyte frequency with HbA1c and age: Correlations in all subjects of adipocyte size (μM2) and preadipocyte frequency (% all SVF cells) with HbA1c and age; p-values shown are adjusted for age and sex when analyzing HbA1c as the dependent variable, and for HbA1c and sex when analyzing age as the dependent variable. I. Adipocyte size distribution: Top: Tables show average mean, median, skewness, and kurtosis for each patient group for adipocyte size data. Bottom: Each line/curve represents counts of adipocyte areas of 200–500 cells for an individual subject; abscissas: adipocyte area (μM2), ordinates: mean % adipocytes in each 100 μM2 increment of all patients in each group (NDM, PRE, DM); gray bars on VAT graph show approximate ranges of adipocytes sizes for which differences in % adipocytes at each 100μM2 increment between DM and NDM subjects. J. Percentile analysis of adipocyte sizes: Stacked graph showing adipocyte size for each patient group at 25th, 50th, and 75th percentiles. Asterisks on bars indicate significant differences for that percentile and group compared with NDM; the single asterisk between bars (VAT, PRE vs. DM) indicates a significant difference between the 2 patient groups at the indicated percentile. Error bars represent standard error of mean.
Figure 3.
Figure 3.
Adipose tissue-based correlates of surgery-induced weight loss: Correlations in all subjects of adipocyte area (μM2) and preadipocyte (PA) frequency (% all SVF cells) with %TWL at 12 months in all subjects and in female and male subgroups; p-values shown are univariate (uv), age-adjusted (a), and age-, HbA1c-, operation-adjusted (a,h,o).

References

    1. Brethauer SA, Aminian A, Romero-Talamas H, Batayyah E, Mackey J, Kennedy L, Kashyap SR, Kirwan JP, Rogula T, Kroh M, et al.. Can diabetes be surgically cured? Long-term metabolic effects of bariatric surgery in obese patients with type 2 diabetes mellitus. Ann Surg. 2013; 258(4):628-36; PMID: 24018646 - PMC - PubMed
    1. Courcoulas AP, Christian NJ, Belle SH, Berk PD, Flum DR, Garcia L, Horlick M, Kalarchian MA, King WC, Mitchell JE, et al.. Weight change and health outcomes at 3 years after bariatric surgery among individuals with severe obesity. JAMA 2013; 310(22):2416-2425; PMID: 24189773 - PMC - PubMed
    1. Agüera Z, García-Ruiz-de-Gordejuela A, Vilarrasa N, Sanchez I, Baño M, Camacho L, Granero R, Jiménez-Murcia S, Virgili N, Lopez-Urdiales R, et al.. Psychological and personality predictors of weight loss and comorbid metabolic changes after bariatric surgery. Eur Eat Disord Rev 2015; 23(6):509-16; PMID: 26377595; https://doi.org/10.1002/erv.2404 - DOI - PubMed
    1. Jurowich C, Thalheimer A, Hartmann D, Bender G, Seyfried F, Germer CT, Wichelmann C. Improvement of type 2 diabetes mellitus (T2DM) after bariatric surgery–who fails in the early postoperative course? Obes Surg 2012; 22(10):1521-6; PMID: 22588846; https://doi.org/10.1007/s11695-012-0676-2 - DOI - PubMed
    1. Ma Y, Pagoto SL, Olendzki BC, Hafner AR, Perugini RA, Mason R, Kelly JJ. Predictors of weight status following laparoscopic gastric bypass. Obes Surg 2006; 16(9):1227-31; PMID: 16989709; https://doi.org/10.1381/096089206778392284 - DOI - PubMed

Publication types

LinkOut - more resources