. 2017 May 3;16(9):879-893.
doi: 10.1080/15384101.2017.1310345. Epub 2017 Apr 20.

Transient exposure to androgens induces a remarkable self-sustained quiescent state in dispersed prostate cancer cells

Affiliations

Transient exposure to androgens induces a remarkable self-sustained quiescent state in dispersed prostate cancer cells

Anh Thu Bui et al. Cell Cycle. .

Abstract

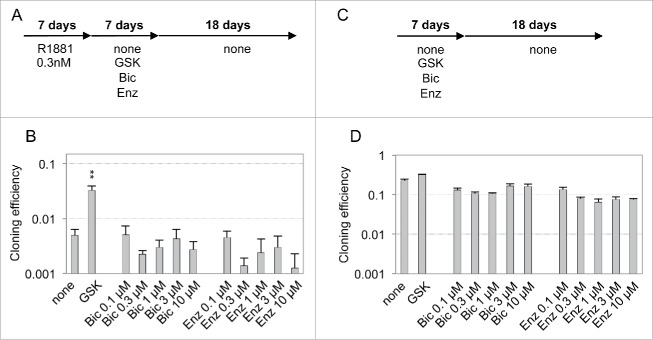
Cellular quiescence is a reversible cell growth arrest that is often assumed to require a persistence of non-permissive external growth conditions for its maintenance. In this work, we showed that androgen could induce a quiescent state that is self-sustained in a cell-autonomous manner through a "hit and run" mechanism in androgen receptor-expressing prostate cancer cells. This phenomenon required the set-up of a sustained redox imbalance and TGFβ/BMP signaling that were dependent on culturing cells at low density. At medium cell density, androgens failed to induce such a self-sustained quiescent state, which correlated with a lesser induction of cell redox imbalance and oxidative stress markers like CDKN1A. These effects of androgens could be mimicked by transient overexpression of CDKN1A that triggered its own expression and a sustained SMAD phosphorylation in cells cultured at low cell density. Overall, our data suggest that self-sustained but fully reversible quiescent states might constitute a general response of dispersed cancer cells to stress conditions.

Keywords: Androgen; BMP; CDKN1A; cellular quiescence; feedback loops; oxidative stress; prostate cancer.


Figures

Figure 1.
Figure 1.
Strong inhibitory effect of androgens on the cloning efficiency of AR-expressing prostate cancer cells and its suppression by AR antagonists. (A, B, C, and D) Cloning efficiency of LNCaP*, VCaP and Du145 prostate cancer cells in the presence of the indicated concentration of androgen and/or AR antagonist. Reported values are the mean ± sd derived from at least 2 independent experiments with duplicates. Asterisks indicate statistical significance of the growth-inhibitory effects of androgens as compared with non-treated cells (black asterisks) and of its suppression by AR antagonists as compared with cells treated only with androgen (red asterisks). (E and F) Cell cycle analysis of LNCaP* and VCaP cells cultured for 7 d under LD-hypo conditions in the presence of none or 0.5 nM R1881. Cells were analyzed by flow cytometry after propidium iodide staining. A 2-step gating procedure using Side SCattering-Height versus Forward SCattering-Height (data not shown) followed by pulse Area vs. pulse Width FLuorescence (FL2-A vs. FL2-W) was performed to eliminate cell doublets. Gated region is indicated on the FL2-A vs. FL2-W dot plot representation. Insets show fluorescence histograms. The percentage of cells in the G0/G1 phase of cell cycle is indicated. One representative experiment about 3 is shown.
Figure 2.
Figure 2.
Transient exposure of cells cultured at low density to androgens induced a self-sustained but reversible growth arrest in the G0/G1 phase of cell cycle. (A) Scheme of experimental design for transitory R1881 treatments. Cells were cultured for 7 d under LD-hypo conditions in the presence R1881 at the indicated concentration, then washed 3 times and further cultured in the presence of the indicated compounds (LD-hypo + R1881 → LD-hypo ± none or GSK or NSK). GSK: 8 mM GSH, 0.2 µM SB505124 and 0.2 µM K02288; NSK: 8 mM NAC, 0.2 µM SB505124 and 0.2 µM K02288. For cloning efficiency measurement, cell colonies were counted at day 27. RT-qPCR and flow cytometry analysis were performed at day 7 (LD-hypo and LD-hypo + R1881) and day 14 (LD-hypo + R1881 → LD-hypo). (B and C) RT-qPCR analysis of the variations in the expression of the dormancy signature genes according to the indicated cell culture conditions in LNCaP* and VCaP cells. R1881 was used at a 0.5 nM concentration. Values are the mean ± sd of 2 independent experiments. Asterisks indicated statistical significance for the differences in mRNA levels between cells cultured under LD-hypo and LD-hypo + R1881 (red asterisks) or LD-hypo + R1881 → LD-hypo (black asterisks) conditions. (D and E) Inhibition of the cloning of LNCaP* and VCaP cells by R1881 and its subsequent reversal by the GSK or NSK mix. Data are averaged from 2 and 3 independent experiments for LNCap and VCaP cells respectively. Statistical significance of the effect of R1881 compared with non-treated cells (red asterisks) and of the effects of the GSK or NSK mix compared with cells treated with R1881 only (blue asterisks) are indicated. (F and G) Cell cycle analysis of LNCaP* and VCaP cells after a 7-days culture in the presence 0.5 nM R1881 followed by a 7-days culture without R1881 under LD-hypo conditions. Data are from the same experiment as those displayed in Fig. 1E and F.
Figure 3.
Figure 3.
Ineffectiveness of AR antagonists to reverse dormancy established after a transient exposure to R1881. (A and C) Schemes of the experimental design for AR antagonist treatments. (B and D) Cloning efficiencies of the cells cultured as indicated. Values are the mean ± sd of 2 independent experiments. Only GSK (8 mM GSH, 0.2 µM SB50512 and 0.2 µM K02288) treatment displayed a significant effect on the reversal of androgen-induced dormancy (black asterisks).
Figure 4.
Figure 4.
Implication of SMAD signaling and redox imbalance in the maintenance of the dormant state induced by transient exposure to the R1881 androgen. (A) Western blot analysis of the levels of SMAD phosphorylation and SMAD1, HMOX1 and CDKN1A expression in LNCaP* and VCaP cells under the indicated culture conditions (see also Fig. 2). Numbers indicate the relative levels of GADPH or the relative amounts of the indicated proteins normalized by GAPDH levels. (B) Western blot analysis of the oxidation of the GRX1-roGFP2 sensor in LNCaP* cells under the indicated culture conditions. “red” and “ox” indicate reduced and oxidized forms of GRX1-roGFP2. Values in the lower panel indicate the ratio of oxidized to reduced GRX1-roGFP2 (ox/red). R1881 was used at a 0.6 nM concentration. The positive control, MD-hypo + H2O2, was cells cultured at medium cell density and treated with 100 mM H2O2 for 10 min before cell lysis. Values are mean ± sd derived from 3 independent transduced cell populations. Asterisks indicate the statistical significance of the variation of the ox/red ratio between MD-hypo and other cell culture conditions. (C and D) GSH supplementation blunted the gene expression signature of dormancy. Cells were cultured for 7 d in the presence of 0.2 nM R1881or 0.2 nM R1881 plus 8 mM GSH under LD-hypo conditions. Variations in the expression of the dormancy signature genes were measured by RT-qPCR as in Fig. 2B) and C). Values are mean ± sd of 2 independent cell culture experiments. Statistical significance of the differences between dormant and GSH-treated cells is indicated. (E) Partial suppression of androgen-induced dormancy by depletion of endogenous SMAD4 or by GSH supplementation. Cloning efficiency of shLuc (control) and shSMAD4-transduced cell populations were measured in non-treated cells (Ø) or in cells treated for 7 d with 0.3 nM R1881 followed by a culture for 20 additional days in growth medium with none (Ø) or with 8 mM GSH. Values are the mean ± sd derived from 2 experiments with 2 control- and 2 shSMAD4-transduced cell populations. Statistical significance of the variation between shSMAD4 and shLuc cells and of the effect of GSH is indicated by asterisks. (F and G) Reversal of R1881-induced dormancy in LNCaP* et VCaP cells by GSH, inhibitors of TGFβ (S) and BMP (K) receptors, or their combinations (KS and GSK). Cloning efficiency were measured in non-treated cells (Ø) or in cells treated for 7 d with 0.2 nM R1881 followed by a culture for additional 20 d in growth medium with the indicated compounds. Values are the mean ± sd of 2 independent experiments. Asterisks indicate the statistical significance of the difference in cloning efficiency between cells treated only with R1881 and cells under other culture conditions.
Figure 5.
Figure 5.
Blunted induction of dormancy by androgens in cells cultured at medium cell density. (A and B) Cumulated cell population doublings of VCaP and LNCaP* cells, respectively, grown under MD-hypo condition in the presence of none or R1881 as indicated. Data are derived from 2 independent experiments. (C and D) Differential effects of R1881 (0.2 nM) on the expression of the dormancy signature genes depending on density of cultured VCaP and LNCaP* cells, respectively. Values are the mean ± sd of 2 independent RT-qPCR experiments with value measured under MD-hypo condition being set at 1. Asterisks indicated statistical significance for the differences in mRNA levels between cells cultured at low (LD-hypo + R1881 for 7 days) and medium (MD-hypo + R1881 for 11 days) density. (E) Pearson correlation coefficients between the expression profile of the dormancy signature genes induced by a R1881 treatment of LNCaP* cultured at medium cell density for 11 d (MD-hypo + 0.2 nM R1881) and those induced by other indicated cell culture conditions. Values are from data used in Fig. S1, 4C and 5D. (F) Western blot analysis of SMAD phosphorylation and SMAD1 and CDKN1A expression in LNCaP* and VCaP cells according to the indicated culture conditions. Numbers indicate the relative levels of GADPH or the relative amount of the indicated proteins normalized by GAPDH levels. (G) Oxidation level of the GRX1-roGFP2 sensor in LNCaP* cells treated by 0.2 nM of R1881 for 11 d at medium cell density. The lower panel indicates the ox/red ratio of GRX1-roGFP2 under the indicated cell culture conditions. Values (mean ± sd) were derived from 3 independently transduced cell populations. (H) Cumulated cell population doubling of LNCaP* cells grown at medium cell density (MD-hypo) in the presence of none, 0.2 nM R1881, 0.2 µM K02288 (K), 0.2 µM SB505124 (S) and 8 mM glutathione (G) or their combination as indicated. Data are averaged from 2 independent experiments.
Figure 6.
Figure 6.
Regulation of androgen-induced dormancy by CDKN1A depletion. (A) Scheme of the experimental design for CDKN1A depletion. Cells were cultured under LD-hypo conditions in the presence of doxycycline (dox) and/or 0.2 nM R1881 for 7 days, washed, and then further cultured for additional 20 d in the presence of dox. (B) Western blot analysis of CDKN1A expression in control and pTRIP-shp21 transduced LNCaP* cells cultured under LD-hypo + dox for 7 d. (C) Relieving of androgen-mediated inhibition of cell cloning by early depletion of CDKN1A. Values are the mean ± sd derived from 2 independently transduced cell populations with control and pTRIP-shp21 lentiviral vectors. Statistical significance of the cloning efficiency difference between control and pTRIP-shp21 transduced LNCaP* cells is indicated (black asterisks).
Figure 7.
Figure 7.
Induction of a dormant state related to androgen-induced dormancy through transient overexpression of CDKN1A. (A) Scheme of the experimental design for transient CDKN1A overexpression. Transduced cell populations were cultured under LD-hypo conditions in the presence of none or doxycycline (dox) to induce CDKN1A expression for 7 d and then cultured in the presence of GSH and/or inhibitors of TGFβ/BMP receptors as described in Fig. 4 (LD-hypo + dox → LD-hypo ± none (Ø) or GSH or KS or GSK). RT-qPCR and Western blot analysis were performed at day 7 (LD-hypo, LD-hypo + dox) or at day 14 (LD-hypo + dox → LD-hypo). (B) Cloning efficiencies of control and pTRIP-p21-transduced LNCaP* cells following transient dox treatment and subsequent reversal in the presence of GSH, inhibitors of TGFβ/BMP receptors (KS) or combination of GSH and inhibitors of TGFβ/BMP receptors (GSK). Statistical significance of the difference in cloning efficiency between control and pTRIP-p21 transduced cells treated only by dox (large asterisk) and of the effects of GSH, KS and GSK (compared with the same cell populations not treated by these compounds; small asterisks) are indicated. (C) Western blot analysis of SMAD phosphorylation or SMAD1, HMOX1 and CDKN1A expression. Cells were cultured as indicated. Numbers indicate the relative levels of GADPH or the relative amount of the indicated proteins normalized by GAPDH levels. Similar data were obtained with another independent couple of control and pTRIP-p21 transduced cell populations. (D) RT-qPCR analysis of exogenous p21 mRNA level transcribed from transduced pTRIP-p21 vector under the indicated cell culture conditions. The couple of primers targeted the 5’ part of the UbqC promoter just downstream of CDKN1A ORF in the pTRIP-p21 expression vector. Control is non-transduced LNCaP* cells. Data were normalized as in Fig. 2B. Variations between any couple of different cell culture conditions were significant (p < 0.05). (E) RT-qPCR analysis of the expression of the dormancy signatures genes induced by transient overexpression of CDKN1A. mRNA levels were normalized as in Fig. 2B). Asterisks indicated statistical significance for the differences in mRNA levels between control cell populations cultured under LD-hypo and pTRIP-p21-transduced cells cultured for 7 d in the presence of dox followed by an additional 7 d under LD-hypo conditions (LD-hypo + dox → LD-hypo). (F) Comparison between the expression profiles of dormancy signature genes from dormant cells induced by exposure to R1881 or overexpression of CDKN1A. Data are derived from those used in Fig. 2B and 7E. (G) Reversal of CDKN1A overexpression-induced dormancy through a delayed treatment with GSH (G) or inhibitors of BMP and TGFβ receptors (KS). These compounds were added only at day 14 and cells were thereafter cultured for additional 18 d for cloning efficiency measurements. Statistical significance of the cloning efficiency difference relative to the cells treated with dox alone is indicated. All data from this figure are derived from experiments with 2 independently transduced cell populations with control and pTRIP-p21 lentiviral vectors.

Comment in

Similar articles

Cited by

References

    1. Havard M, Dautry F, Tchenio T. A dormant state modulated by osmotic pressure controls clonogenicity of prostate cancer cells. J Biol Chem 2011; 286:44177-86; PMID:22039055; http://dx.doi.org/10.1074/jbc.M111.262709 - DOI - PMC - PubMed
    1. Bui AT, Laurent F, Havard M, Dautry F, Tchenio T. SMAD signaling and redox imbalance cooperate to induce prostate cancer cell dormancy. Cell Cycle 2015; 14:1218-31; PMID:25706341; http://dx.doi.org/10.1080/15384101.2015.1014145 - DOI - PMC - PubMed
    1. Wang ZA, Shen MM. Revisiting the concept of cancer stem cells in prostate cancer. Oncogene 2011; 30:1261-71; PMID:21119602; http://dx.doi.org/10.1038/onc.2010.530 - DOI - PubMed
    1. Choi N, Zhang B, Zhang L, Ittmann M, Xin L. Adult murine prostate basal and luminal cells are self-sustained lineages that can both serve as targets for prostate cancer initiation. Cancer Cell 2012; 21:253-65; PMID:22340597; http://dx.doi.org/10.1016/j.ccr.2012.01.005 - DOI - PMC - PubMed
    1. Wadosky KM, Koochekpour S. Molecular mechanisms underlying resistance to androgen deprivation therapy in prostate cancer. Oncotarget 2016; 7:64447-70; PMID:27487144; http://dx.doi.org/10.18632/oncotarget.10901 - DOI - PMC - PubMed

MeSH terms