. 2017 Apr 20;13(4):e1005499.
doi: 10.1371/journal.pcbi.1005499. eCollection 2017 Apr.

Exhaustive search of linear information encoding protein-peptide recognition

Affiliations

Exhaustive search of linear information encoding protein-peptide recognition

Abdellali Kelil et al. PLoS Comput Biol. .

Abstract

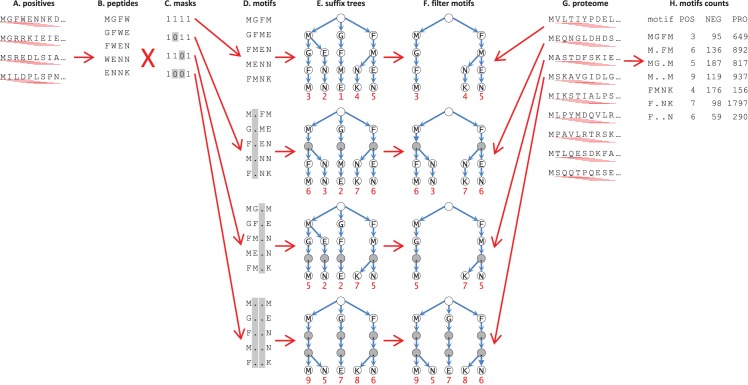
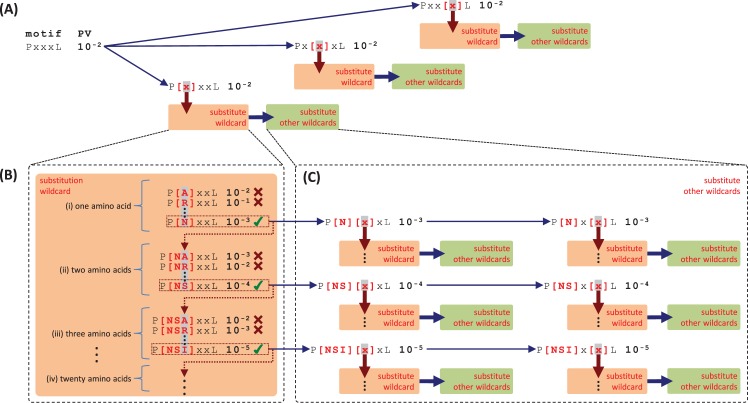
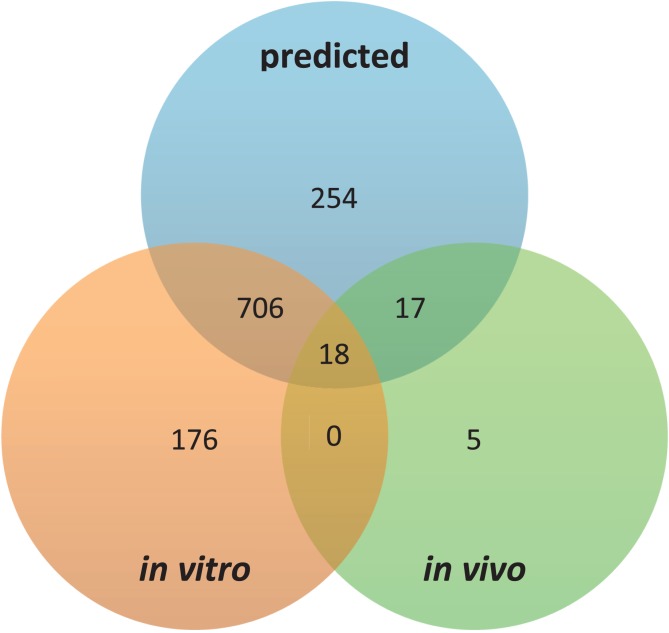
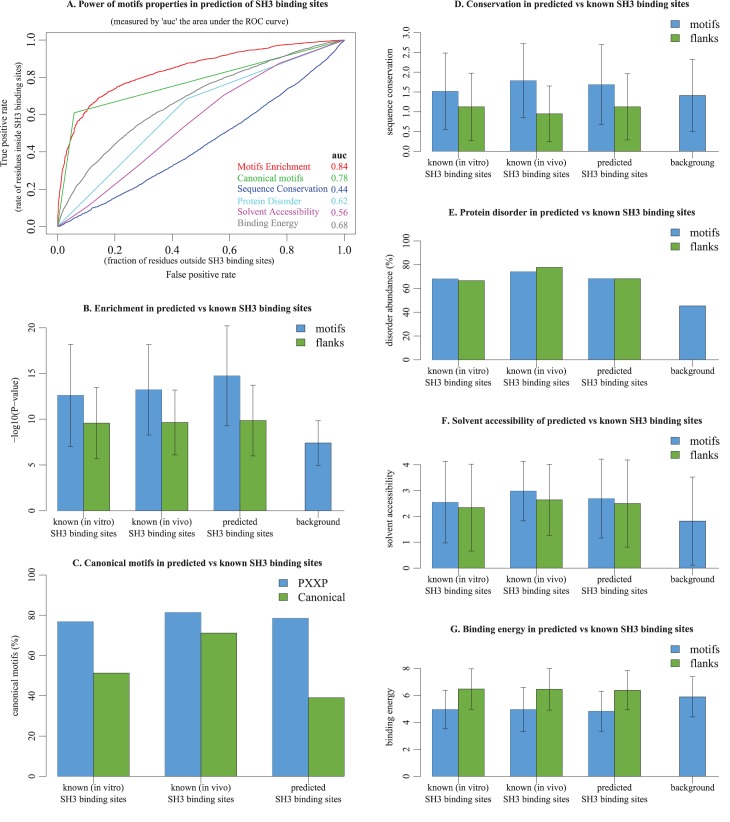
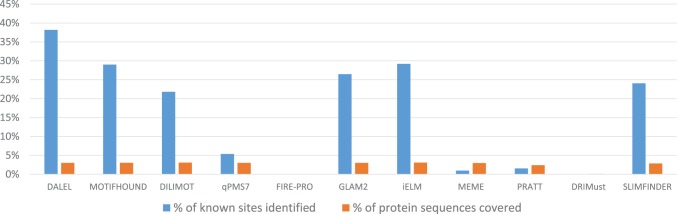
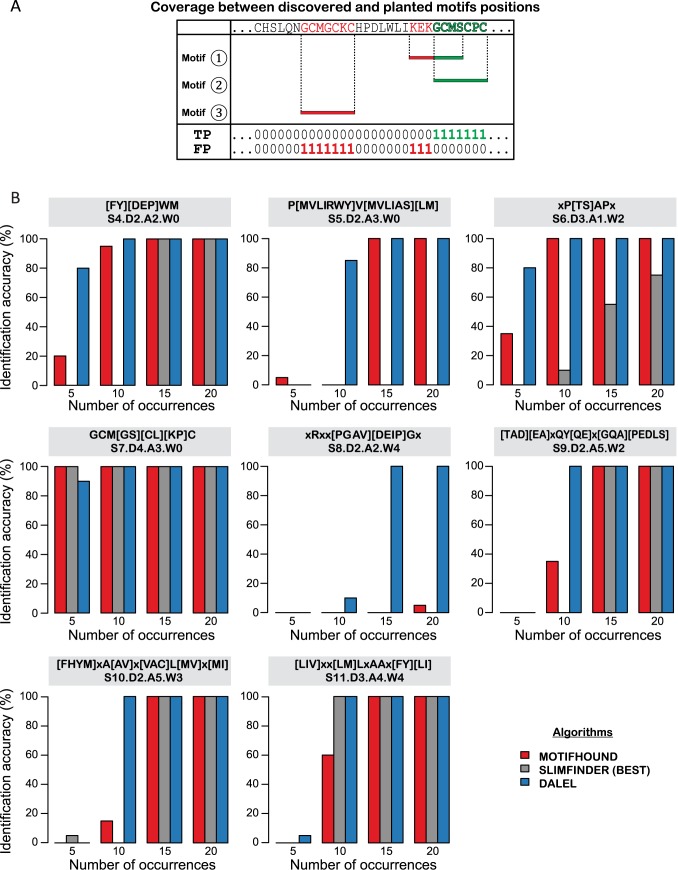
High-throughput in vitro methods have been extensively applied to identify linear information that encodes peptide recognition. However, these methods are limited in number of peptides, sequence variation, and length of peptides that can be explored, and often produce solutions that are not found in the cell. Despite the large number of methods developed to attempt addressing these issues, the exhaustive search of linear information encoding protein-peptide recognition has been so far physically unfeasible. Here, we describe a strategy, called DALEL, for the exhaustive search of linear sequence information encoded in proteins that bind to a common partner. We applied DALEL to explore binding specificity of SH3 domains in the budding yeast Saccharomyces cerevisiae. Using only the polypeptide sequences of SH3 domain binding proteins, we succeeded in identifying the majority of known SH3 binding sites previously discovered either in vitro or in vivo. Moreover, we discovered a number of sites with both non-canonical sequences and distinct properties that may serve ancillary roles in peptide recognition. We compared DALEL to a variety of state-of-the-art algorithms in the blind identification of known binding sites of the human Grb2 SH3 domain. We also benchmarked DALEL on curated biological motifs derived from the ELM database to evaluate the effect of increasing/decreasing the enrichment of the motifs. Our strategy can be applied in conjunction with experimental data of proteins interacting with a common partner to identify binding sites among them. Yet, our strategy can also be applied to any group of proteins of interest to identify enriched linear motifs or to exhaustively explore the space of linear information encoded in a polypeptide sequence. Finally, we have developed a webserver located at http://michnick.bcm.umontreal.ca/dalel, offering user-friendly interface and providing different scenarios utilizing DALEL.


Conflict of interest statement

The authors have declared that no competing interests exist.

Figures

Fig 1
Fig 1. Parallel strategy for exhaustive search of linear motifs in protein sequences.
(A) A sliding window is used to enumerate sequence motifs among proteins that bind to a protein or protein domain (positives); (B), the scan is performed for all linear peptides of a specified sequence length. (C) Sequences obtained are passed through a set of masks, each representing one of the possible combinations of wildcard (variable amino acid) positions. (D) Each mask is used to find all possible motifs present in the positives and matching wildcard configuration defined by the masks. (E) A suffix tree is constructed for each set of motifs. (F) The size of each tree is reduced by removing branches corresponding to motifs that occur among the positives less than a specified number of times. (G) Finally, a sliding window is used to scan each protein in the proteome for peptides of the desired length. (H) Peptides are matched to each suffix tree to obtain the number of occurrences of each motif among the negatives (proteins that do not bind to a specified protein or protein domain but bind to one or more members of same family) and the background (all other proteins in the proteome).
Fig 2
Fig 2. A strategy to exhaustively search for variable residues in linear motifs.
The algorithm first exhaustively searches for variants of a motif by substituting each wildcard by all combinations from 1 to 20 amino acids iteratively and test for improvement of p-values. (A) Given the motif “PxxxL”, the strategy substitutes all combinations of amino acids at each wildcard (orange boxes). When a substitution at a given wildcard improves the p-value, the algorithm switches to substitutions of the other wildcards (green boxes). (B) The wildcard is iteratively substituted by all combinations from 1 to 20 amino acids until there is no further improvement of the p-value. (i) At the first step, the wildcard is substituted by each of 20 individual amino acids. Substitutions that improve the p-value are retained, i.e. “P[N]..L”; (ii) for each substitution retained we add, one by one, each of the other amino acids and new substitutions that improve the p-values are retained, i.e. “P[NS]..L”; (iii) step (ii) is repeated for remaining amino acids, i.e. “P[NSI]..L”. (C) The process described in (B) is simultaneously performed at all other wildcard positions in the motif.
Fig 3
Fig 3. Overlap between discovered motifs and experimentally determined SH3 binding sites.
For each SH3 domain, the overlap between discovered motifs and known SH3 binding sites was measured by the distribution of their distances in numbers of amino acid residues (nbr of aa) from the nearest known SH3 domain binding site. The Y-axis represents the frequency of amino acids (aa) that belong to discovered motifs. Along the X-axis, at each position (0, 10, 20, …, 120), each point represents the average frequency of amino acids obtained for a different SH3 domain.
Fig 4
Fig 4. Prediction of non-standard peptides recognized by Fus1 SH3 domain.
We compared the motifs we discovered to standard motifs (i.e. curated from the literature) in the prediction of non-standard binding sites of Fus1 SH3 domain. To this end, we found in the 22 target proteins of Fus1 SH3 domain the peptides belonging to each motif (i.e. predicted binding sites), then we calculated the overlap with the 25 known binding sites of Fus1 SH3 domain. We found that on average, 70% of the amino acid sequences covered by the motifs we discovered were found within known SH3 binding sites.
Fig 5
Fig 5. Discovered motifs versus experimentally determined SH3 binding sites both in vitro and in vivo.
Fig 6
Fig 6. Properties of predicted vs. known SH3 binding sites in contrast with background.
A comparison of the different properties of predicted and known (i.e. experimentally determined) SH3 binding sites, and assessment of the power of each property in the identification of SH3 binding sites among their background. The background is defined as the full length sequences of proteins in which SH3 domain binding sites were discovered. (A). Properties generally observed in SH3 binding sites are used separately as discriminative features for the identification of known SH3 binding sites. The quality of the prediction of each property is evaluated according to the area under the ROC curve (auc). (B). The P-value average and standard deviation of the peptides we discovered in known SH3 binding sites in comparison to peptides that we predicted to be SH3 binding sites, compared to peptides we discovered versus the background. (C). The abundance of PXXP and canonical peptides (i.e. [RK]XXPXXP and PXXPX[RK]) in predicted and known SH3 binding sites, compared to the background. (D). The average and standard deviation of sequence conservation in predicted and known SH3 binding sites in contrast to their flanking regions, and compared to their background. (E). The content of protein disorder among predicted and known SH3 binding sites in contrast with their flanking regions and compared to their background. (F). The average and standard deviation of solvent accessibility in predicted and known SH3 binding sites in contrast to their flanking regions and compared to their background. (G). The average and standard deviation of binding energy in predicted and known SH3 binding sites in contrast to their flanking regions and compared to their background. Throughout this figure, the statistics obtained on predicted peptides are calculated based on their occurrences in the proteins.
Fig 7
Fig 7. Identification of known binding sites of Grb2 SH3 N-terminal domain.
The GRB2 SH3 N-terminal domain is known to bind to 61 proteins, through 72 binding sites that cover 2.45% of their total sequence lengths. We blindly submitted the 61 protein sequences to several algorithms to evaluate their ability to identify these binding sites. We considered the top predicted sites returned for each algorithm, such that they covered at most 3.00% of sequence’s length. For each algorithm, we plot the coverage of the sites identified (red bars), as well as the corresponding coverage of known SH3 binding sites identified (blue bars).
Fig 8
Fig 8. Comparative analysis of three algorithms in the discovery of linear motifs with ambiguous positions.
A. For all amino acids covered by a top-ranked motif, we assigned one of the possible prediction outcomes (TP True Positive, FP False Positive) depending on whether the positions matched the positions at which we planted the motifs: TP (number of positions correctly detected), FP (number of positions incorrectly detected). Top-ranked motifs were considered and matched until their sequence coverage (number of TP+FP) reached the number of positions to be discovered. B. The benchmark results for three state-of-the-art algorithms (MotifHound in red, SLiMFinder in grey, DALEL in blue) in the blind discovery of each ELM motif were represented by bar charts. The y-axis reports the global “discovery accuracy” for each number of occurrence (x-axis). The global accuracy is obtained by calculating the fraction of sets in which the planted motif was identified with a precision (TP / (TP+FP)) above 0.7, i.e. an overlap of at least 70% between the positions covered by the top-ranked motifs with respect to the positions of the planted motif. The regular expression of the consensus ELM motif with their key parameters (size S, defined positions D, ambiguous positions A, wildcard positions W) are displayed above each graph.
Fig 9
Fig 9. Design of the benchmark datasets.
The benchmark is composed of 640 sets of 50 sequences, each set containing a specific planted motif. The planted motifs vary in their size (S4 to S11), number of ambiguous positions (A1 to A6) and number of occurrences (5, 10, 15, 20). We created 20 replicates varying in the motif being planted. Altogether, 160 motifs were created for the benchmark (20 replicates × 8 ELM motifs), resulting in 640 sets of 50 sequences (160 motifs x 4 number of occurrences). A. We first selected 8 motifs from the ELM database with fixed-size of from 4 to 11 residues and with several ambiguous positions. The amino acids within brackets indicate ambiguous positions and x corresponds to wildcard positions with unrestricted amino acid identity. B. In the second step, we derived all N possible combinations of amino acids at ambiguous positions for each motif. In this example, N = 8 unique motifs are generated from a motif containing A = 3 ambiguous positions. C. Finally, each unique motif so obtained is planted in a set of 50 protein sequences selected randomly. In this example, the motif has been inserted 5, 10, 15 or 20 times in the same dataset of 50 sequences. We minimized the level of homology between sequences so that pairwise identity is below 50% for any aligned region of at least 50 residues in length. The white rectangles symbolize the motifs planted, and the blue lines represent protein sequences.

References

    1. Tong AH, Drees B, Nardelli G, Bader GD, Brannetti B, Castagnoli L, et al. A combined experimental and computational strategy to define protein interaction networks for peptide recognition modules. Science. 2002;295(5553):321–4. doi: 10.1126/science.1064987 - DOI - PubMed
    1. Dinkel H, Van Roey K, Michael S, Davey NE, Weatheritt RJ, Born D, et al. The eukaryotic linear motif resource ELM: 10 years and counting. Nucleic Acids Res. 2014;42(Database issue):D259–66. PubMed Central PMCID: PMCPMC3964949. doi: 10.1093/nar/gkt1047 - DOI - PMC - PubMed
    1. Finn RD, Bateman A, Clements J, Coggill P, Eberhardt RY, Eddy SR, et al. Pfam: the protein families database. Nucleic Acids Res. 2014;42(Database issue):D222–30. PubMed Central PMCID: PMC3965110. doi: 10.1093/nar/gkt1223 - DOI - PMC - PubMed
    1. Tonikian R, Xin X, Toret CP, Gfeller D, Landgraf C, Panni S, et al. Bayesian modeling of the yeast SH3 domain interactome predicts spatiotemporal dynamics of endocytosis proteins. PLoS Biol. 2009;7(10):e1000218 PubMed Central PMCID: PMC2756588. doi: 10.1371/journal.pbio.1000218 - DOI - PMC - PubMed
    1. Watterson S, Ghazal P. Use of logic theory in understanding regulatory pathway signaling in response to infection. Future Microbiol. 2010;5(2):163–76. doi: 10.2217/fmb.10.8 - DOI - PubMed

Publication types