. 2017 Apr 20;13(4):e1006744.
doi: 10.1371/journal.pgen.1006744. eCollection 2017 Apr.

Bioenergetic status modulates motor neuron vulnerability and pathogenesis in a zebrafish model of spinal muscular atrophy

Affiliations

Bioenergetic status modulates motor neuron vulnerability and pathogenesis in a zebrafish model of spinal muscular atrophy

Penelope J Boyd et al. PLoS Genet. .

Abstract

Degeneration and loss of lower motor neurons is the major pathological hallmark of spinal muscular atrophy (SMA), resulting from low levels of ubiquitously-expressed survival motor neuron (SMN) protein. One remarkable, yet unresolved, feature of SMA is that not all motor neurons are equally affected, with some populations displaying a robust resistance to the disease. Here, we demonstrate that selective vulnerability of distinct motor neuron pools arises from fundamental modifications to their basal molecular profiles. Comparative gene expression profiling of motor neurons innervating the extensor digitorum longus (disease-resistant), gastrocnemius (intermediate vulnerability), and tibialis anterior (vulnerable) muscles in mice revealed that disease susceptibility correlates strongly with a modified bioenergetic profile. Targeting of identified bioenergetic pathways by enhancing mitochondrial biogenesis rescued motor axon defects in SMA zebrafish. Moreover, targeting of a single bioenergetic protein, phosphoglycerate kinase 1 (Pgk1), was found to modulate motor neuron vulnerability in vivo. Knockdown of pgk1 alone was sufficient to partially mimic the SMA phenotype in wild-type zebrafish. Conversely, Pgk1 overexpression, or treatment with terazosin (an FDA-approved small molecule that binds and activates Pgk1), rescued motor axon phenotypes in SMA zebrafish. We conclude that global bioenergetics pathways can be therapeutically manipulated to ameliorate SMA motor neuron phenotypes in vivo.


Conflict of interest statement

THG is Chair of the Scientific and Clinical Advisory Group of the SMA Trust, and sits on advisory boards for the Association Française contre les Myopathies (AFM) and SMA Europe.

Figures
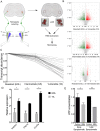
Fig 1
Fig 1. Microarray analysis of differentially vulnerable motor neuron pools reveals fundamental differences in their basal molecular composition.
(A) Schematic illustration of experimental design (TA, tibialis anterior; EDL, extensor digitorum longus; GS, gastrocnemius; Vul, vulnerable MNs, Res, resistant MNs; Int, intermediate phenotype MNs). (B) Volcano plots of differentially expressed transcripts in resistant compared to vulnerable MN pools, intermediate compared to vulnerable MN pools, and resistant compared to intermediate MN pools. (C) Ratio trending analysis: transcripts that were significantly changed (p<0.05) between resistant (EDL) and vulnerable (TA) groups with a differential trending value in the intermediate (GS) group were first identified after which the data set underwent enrichment analysis to reveal enriched biological pathways. Graph shows an example of genes in one enriched biological pathway (mitochondrial electron transport chain genes). Note that transcripts showed highest expression levels in resistant (EDL) neurons, with a decreasing level of expression as the vulnerability status of the groups increased (GS through to TA). (D) qPCR validation for 3 distinct mitochondrial genes confirming up-regulation in disease-resistant MN pools (N = 3), Unpaired two tailed student t-test (* P<0.05). (E) Bar chart (mean & s.e.m.) showing a reduction in ATP in the spinal cord of early and late-symptomatic SMA mice compared to littermate controls using an ATP assay (N = 3 spinal cords per genotype).
Fig 2
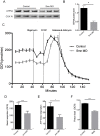
Fig 2. Mitochondrial dysfunction occurs in smn morphant zebrafish.
(A) Levels of ATP5A protein, a subunit of mitochondrial membrane ATP synthase, were significantly reduced in smn morphant zebrafish. (B) Levels were quantified using fluorescent Western blotting and normalized to COXIV loading control (N = 3 per group, batches of 30 pooled zebrafish embryos per lane). (C) Mitochondrial oxygen consumption rates (OCR) of control and smn morphant 24 hpf zebrafish analyzed using the Seahorse XF24 analyser showed mitochondrial bioenergetic defects (D) Basal respiration was significantly reduced in smn morphants compared to controls. (E) ATP linked respiration was significantly reduced in smn morphants compared to controls. (F) Mitochondrial proton leak was also reduced in smn morphants compared to controls. N = 14 per group) Unpaired two-tailed student t-test * P<0.05, ** p<0.01 *** p<0.001.
Fig 3
Fig 3. Overexpression of necdin ameliorates the motor axon outgrowth phenotype in smn morphant zebrafish.
(A) Western blotting of cytochrome C, an electron transport chain protein showed an increase in NDN overexpressing embryos suggesting an increase in mitochondrial biogenesis. (B) Cyt C protein levels were quantified relative to a loading control. (C) Representative confocal micrographs of motor neuron axons exiting the spinal cord in control (top), smn morphant (middle) and smn morphant over-expressing Ndn (bottom) Tg(hb9:GFP) zebrafish embryos. Note the presence of the axonal outgrowth phenotype associated with smn knockdown (arrow heads) is reduced in the Ndn expressing animals. Scale bars = 50 μM. (D) Bar chart (mean & s.e.m.) showing a significant increase in the number of normal MNs, and a concomitant significant decrease in the number of severely affected MNs, in co-injected smn MO and Ndn mRNA embryos compared to single smn MO injected embryos at 30 hpf. Unpaired two-tailed student t-tests; * p<0.05, ** p<0.01 *** p<0.001. N = 20 embryos per experimental group.
Fig 4
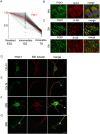
Fig 4. PGK1 is enriched in disease-resistant motor neuron pools, expressed in neuronal cells cellular and axonal compartments in vivo and in vitro.
(A) Gene expression profile graph showing transcripts trending across differentially vulnerable motor neuron pools, with PGK1 highlighted. Note that Pgk1 was 5-fold higher expressed in the EDL disease-resistant motor neuron pool compared to the TA vulnerable motor neuron pool, with expression levels trending through the GS intermediate pool. (B) Representative confocal micrographs showing expression of PGK1 in the cytoplasm of motor neurons (MN) in mouse spinal cord. Scale bars = 20 μM. (C) Expression of PGK1 was also detected in the majority of axons in the sciatic nerve (SN), being localised alongside neurofilament (H-NF; upper panels) but not co-localising with glial S100 label (lower panels). Scale bars = 5 μM (D) In vitro analysis showed expression of PGK1 in the cell body and axonal processes of mouse cortical neurons (CtxN). Scale bars = 30 μM. (E) Expression of pgk1 was detected in the axonal nerve terminals of mouse cortical neurons (CtxN). Scale bars = 15 μM. (F) Expression of PGK1 was also found in mouse primary motor neuron (MN) cell bodies and axonal compartments (arrow). Scale bars = 30 μM. (G) Expression of Pgk1 in the axonal terminals/growth cones (arrow) of mouse primary motor neurons (MN). Scale bars = 15 μM.
Fig 5
Fig 5. Pgk1 expression is pathologically relevant in mouse and zebrafish models of SMA.
(A) Expression of PGK1 protein in the spinal cord, skeletal muscle, sciatic nerve and heart of late-symptomatic P8 SMA mice. Protein levels were quantified and normalized to an appropriate loading control. (B) Bar chart (mean & s.e.m.) showing a significant reduction in PGK1 protein levels in SMA mouse spinal cord and sciatic nerve. N = 6 SPC per genotype. N = 3 muscle per genotype. N = 7 sciatic nerves per genotype. N = 3 hearts per genotype (C) Knockdown of Pgk1 in zebrafish induced an axonal outgrowth phenotype (middle panel arrow) similar to smn knockdown (arrow bottom panel) and also produced swellings in the tips of outgrowing axons indicative of axonal transport deficiencies. Scale bars = 50 μM (D) Quantification of axonal outgrowths showed a significant increase in truncated motor axons in pgk1 and smn morphants compared to controls. (E) Efficiency of pgk1 knockdown in embryos was shown by western blot embryos normalized to an appropriate loading control (N = 3 per group, batches of 30 pooled zebrafish embryos per lane). N = 20 embryos per group. Unpaired two-tailed students t-test * p<0.05, ** p<0.01 *** p<0.001 **** p<0.0001.
Fig 6
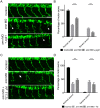
Fig 6. Overexpression or pharmacological activation of pgk1 rescues motor neuron phenotypes in smn morphant zebrafish.
(A) Representative confocal micrographs of primary motor neuron axons exiting the spinal cord in control (top), smn morphant (middle) and smn morphant over-expressing pgk1 (bottom) Tg(hb9:GFP) zebrafish embryos. Note the presence of an axonal outgrowth/branching phenotype associated with smn knockdown (arrow heads) that is reduced in the pgk1 over-expressing animals. Scale bars = 50 μM. (B) Overexpression of Pgk1 in smn morphant zebrafish at 30 hpf led to a significant increase in normal motor axons and significant decrease in severe axonal outgrowth phenotypes compared to single smn MO injected embryos. (C) Representative confocal micrographs of motor neuron axons exiting the spinal cord in control (top), smn morphant (middle) and smn morphant treated with 2.5 μM terazosin (bottom) Tg(hb9:GFP) zebrafish embryos. Note how the presence of the axonal outgrowth/branching phenotype associated with smn knockdown (arrow heads) is reduced in the terazosin-treated animals. (D) Bar chart (mean & s.e.m) showing activation of Pgk1 by treatment with 2.5 μM terazosin in smn morphant zebrafish at 30 hpf led to a significant increase in normal motor axons and significant decrease in severe axonal outgrowth phenotypes compared to untreated smn MO injected embryos. Unpaired two-tailed student t-tests * p<0.05, ** p<0.01 *** p<0.001. n = 20 embryos per group.
Fig 7
Fig 7. Summary model showing ATP-generating pathways likely to influence the vulnerability status of MNs in SMA.
Efficient ATP generation through different processes maintains levels in energy demanding MNs, critical for their function and survival during disease. Certain motor neuron pools possess inherently higher bioenergetic capacities that provide protection during cellular insult both at the cell body and at the NMJ. Efficient ATP generated from mitochondria allows cellular homeostasis to be maintained. During hypoxia, glycolytic pathways are employed to meet acute ATP demand, particularly at the NMJ, critical for vesicular recycling and synaptic transmission. Mitochondrial transport along the axon provides local ATP to maintain axonal integrity. Glycolytic machinery present along the axon allows for fast vesicular transport down to the NMJ to deliver packaged proteins for pre-synaptic function.

References

    1. Mercuri E, Bertini E, Iannaccone ST. Childhood spinal muscular atrophy: controversies and challenges. Lancet Neurol. 2012;11(5):443–52. 10.1016/S1474-4422(12)70061-3 - DOI - PubMed
    1. Lefebvre S, Burglen L, Reboullet S, Clermont O, Burlet P, Viollet L, et al. Identification and characterization of a spinal muscular atrophy-determining gene. Cell. 1995;80(1):155–65. - PubMed
    1. Schrank B, Gotz R, Gunnersen JM, Ure JM, Toyka KV, Smith AG, et al. Inactivation of the survival motor neuron gene, a candidate gene for human spinal muscular atrophy, leads to massive cell death in early mouse embryos. Proc Natl Acad Sci U S A. 1997;94(18):9920–5. - PMC - PubMed
    1. Lorson CL, Hahnen E, Androphy EJ, Wirth B. A single nucleotide in the SMN gene regulates splicing and is responsible for spinal muscular atrophy. Proc Natl Acad Sci U S A. 1999;96(11):6307–11. - PMC - PubMed
    1. Monani UR, Lorson CL, Parsons DW, Prior TW, Androphy EJ, Burghes AH, et al. A single nucleotide difference that alters splicing patterns distinguishes the SMA gene SMN1 from the copy gene SMN2. Hum Mol Genet. 1999;8(7):1177–83. - PubMed

Publication types

MeSH terms