

Change in iron metabolism in rats after renal ischemia/reperfusion injury
- PMID: 28426710
- PMCID: PMC5398610
- DOI: 10.1371/journal.pone.0175945
Change in iron metabolism in rats after renal ischemia/reperfusion injury
Abstract
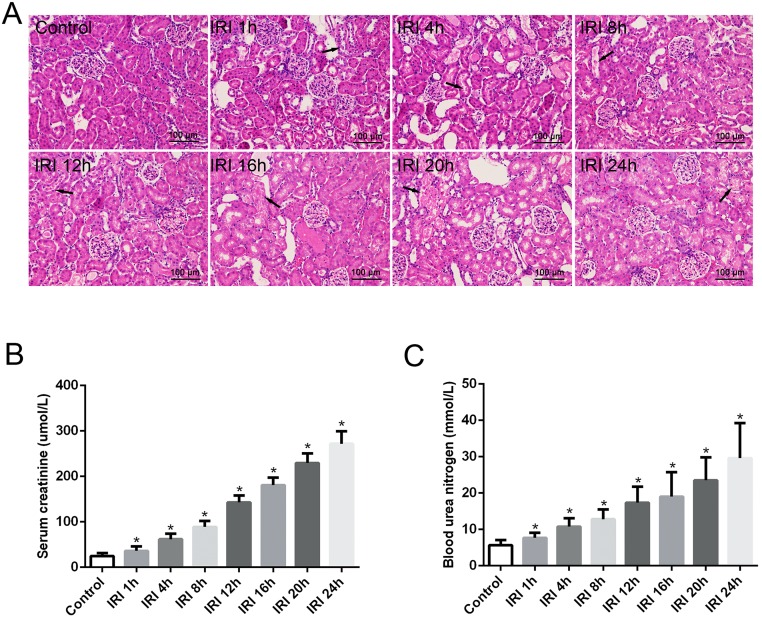
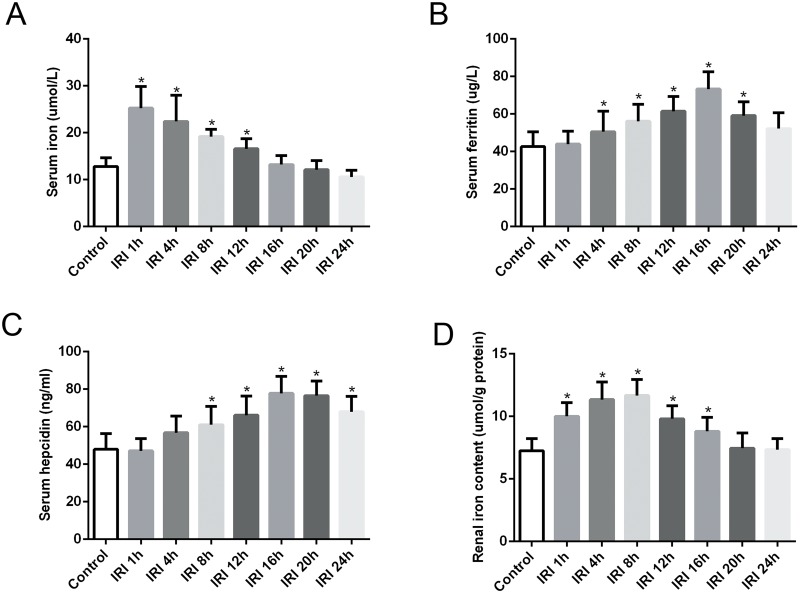
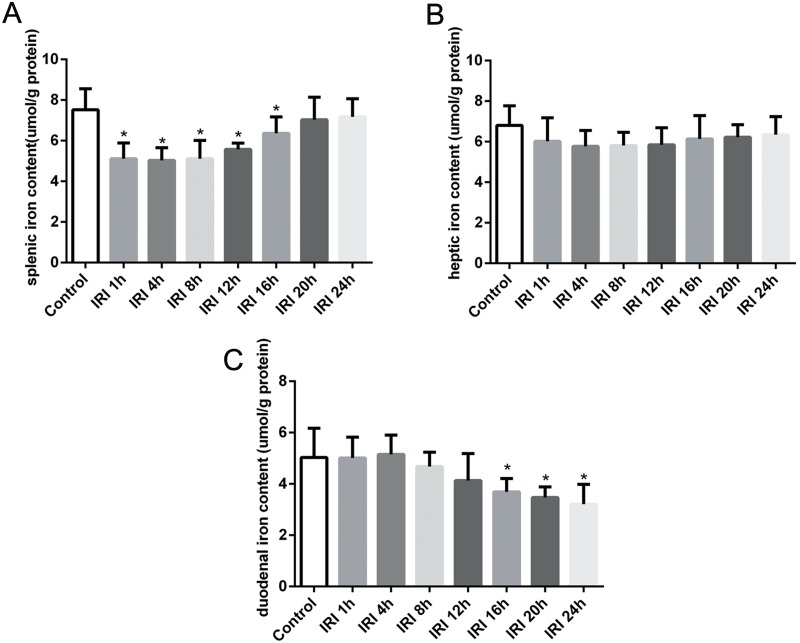
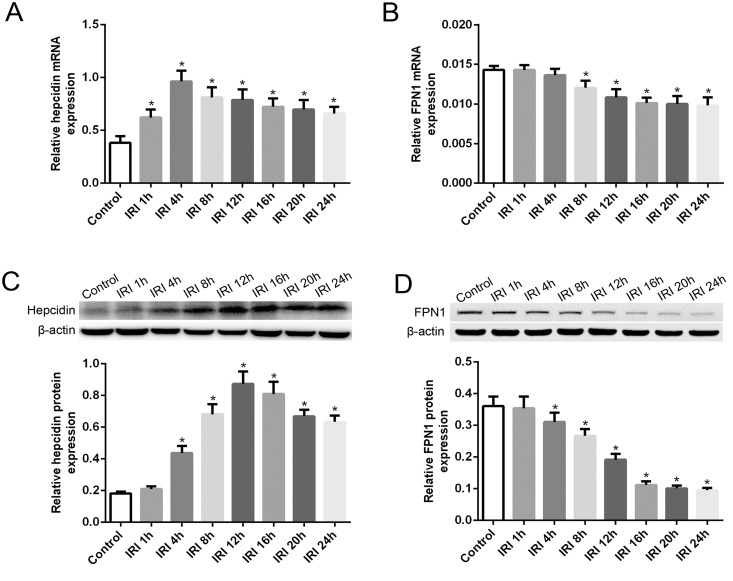
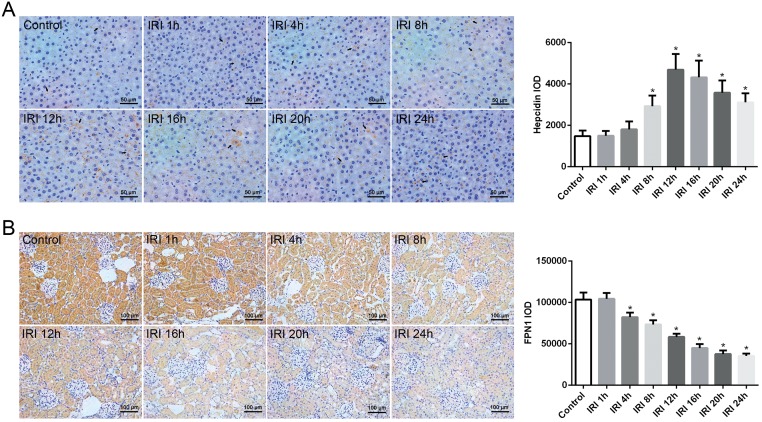
Previous studies have indicated that hepcidin, which can regulate iron efflux by binding to ferroportin-1 (FPN1) and inducing its internalization and degradation, acts as the critical factor in the regulation of iron metabolism. However, it is unknown whether hepcidin is involved in acute renal ischemia/reperfusion injury (IRI). In this study, an IRI rat model was established via right renal excision and blood interruption for 45 min in the left kidney, and iron metabolism indexes were examined to investigate the change in iron metabolism and to analyze the role of hepcidin during IRI. From 1 to 24 h after renal reperfusion, serum creatinine and blood urea nitrogen were found to be time-dependently increased with different degrees of kidney injury. Regular variations in iron metabolism indexes in the blood and kidneys were observed in renal IRI. Renal iron content, serum iron and serum ferritin increased early after reperfusion and then declined. Hepcidin expression in the liver significantly increased early after reperfusion, and its serum concentration increased beginning at 8 h after reperfusion. The splenic iron content decreased significantly in the early stage after reperfusion and then increased time-dependently with increasing reperfusion time, and the hepatic iron content showed a decrease in the early stage after reperfusion. The early decrease of the splenic iron content and hepatic iron content might indicate their contribution to the increase in serum iron in renal IRI. In addition, the duodenal iron content showed time-dependently decreased since 12 h after reperfusion in the IRI groups compared to the control group. Along with the spleen, the duodenum might contribute to the decrease in serum iron in the later stage after reperfusion. The changes in iron metabolism indexes observed in our study demonstrate an iron metabolism disorder in renal IRI, and hepcidin might be involved in maintaining iron homeostasis in renal IRI. These findings might suggest a self-protection mechanism regulating iron homeostasis in IRI and provide a new perspective on iron metabolism in attenuating renal IRI.
Conflict of interest statement
Figures
Similar articles
-
The effect of hepcidin in rats with renal ischemia/reperfusion injury.Am J Transl Res. 2020 Jul 15;12(7):3402-3411. eCollection 2020. Am J Transl Res. 2020. PMID: 32774708 Free PMC article.
-
Hepcidin Mitigates Renal Ischemia-Reperfusion Injury by Modulating Systemic Iron Homeostasis.J Am Soc Nephrol. 2015 Nov;26(11):2800-14. doi: 10.1681/ASN.2014101037. Epub 2015 Mar 18. J Am Soc Nephrol. 2015. PMID: 25788528 Free PMC article.
-
Sex differences in iron status and hepcidin expression in rats.Biol Trace Elem Res. 2014 Aug;160(2):258-67. doi: 10.1007/s12011-014-0051-3. Epub 2014 Jun 26. Biol Trace Elem Res. 2014. PMID: 24962641
-
Iron Homeostasis in Healthy Kidney and its Role in Acute Kidney Injury.Semin Nephrol. 2019 Jan;39(1):76-84. doi: 10.1016/j.semnephrol.2018.10.006. Semin Nephrol. 2019. PMID: 30606409 Review.
-
Targeting ferroptosis in ischemia/reperfusion renal injury.Naunyn Schmiedebergs Arch Pharmacol. 2022 Nov;395(11):1331-1341. doi: 10.1007/s00210-022-02277-5. Epub 2022 Aug 3. Naunyn Schmiedebergs Arch Pharmacol. 2022. PMID: 35920897 Review.
Cited by
-
The multifaceted role of iron in renal health and disease.Nat Rev Nephrol. 2020 Feb;16(2):77-98. doi: 10.1038/s41581-019-0197-5. Epub 2019 Sep 25. Nat Rev Nephrol. 2020. PMID: 31554933 Review.
-
Hydrogen Gas Alleviates Chronic Intermittent Hypoxia-Induced Renal Injury through Reducing Iron Overload.Molecules. 2019 Mar 26;24(6):1184. doi: 10.3390/molecules24061184. Molecules. 2019. PMID: 30917568 Free PMC article.
-
The effect of hepcidin in rats with renal ischemia/reperfusion injury.Am J Transl Res. 2020 Jul 15;12(7):3402-3411. eCollection 2020. Am J Transl Res. 2020. PMID: 32774708 Free PMC article.
-
Elevated serum iron level is a predictor of prognosis in ICU patients with acute kidney injury.BMC Nephrol. 2020 Jul 25;21(1):303. doi: 10.1186/s12882-020-01965-9. BMC Nephrol. 2020. PMID: 32711469 Free PMC article.
-
The efficiency of oxerutin on apoptosis and kidney function in rats with renal ischemia reperfusion injury.Ulus Travma Acil Cerrahi Derg. 2022 Mar;28(3):344-351. doi: 10.14744/tjtes.2021.15740. Ulus Travma Acil Cerrahi Derg. 2022. PMID: 35485553 Free PMC article.
References
MeSH terms
Substances
LinkOut - more resources
Full Text Sources
Other Literature Sources
Medical
