. 2017 Apr 20;12(4):e0175876.
doi: 10.1371/journal.pone.0175876. eCollection 2017.

Properties of healthcare teaming networks as a function of network construction algorithms

Affiliations

Properties of healthcare teaming networks as a function of network construction algorithms

Martin S Zand et al. PLoS One. .

Abstract

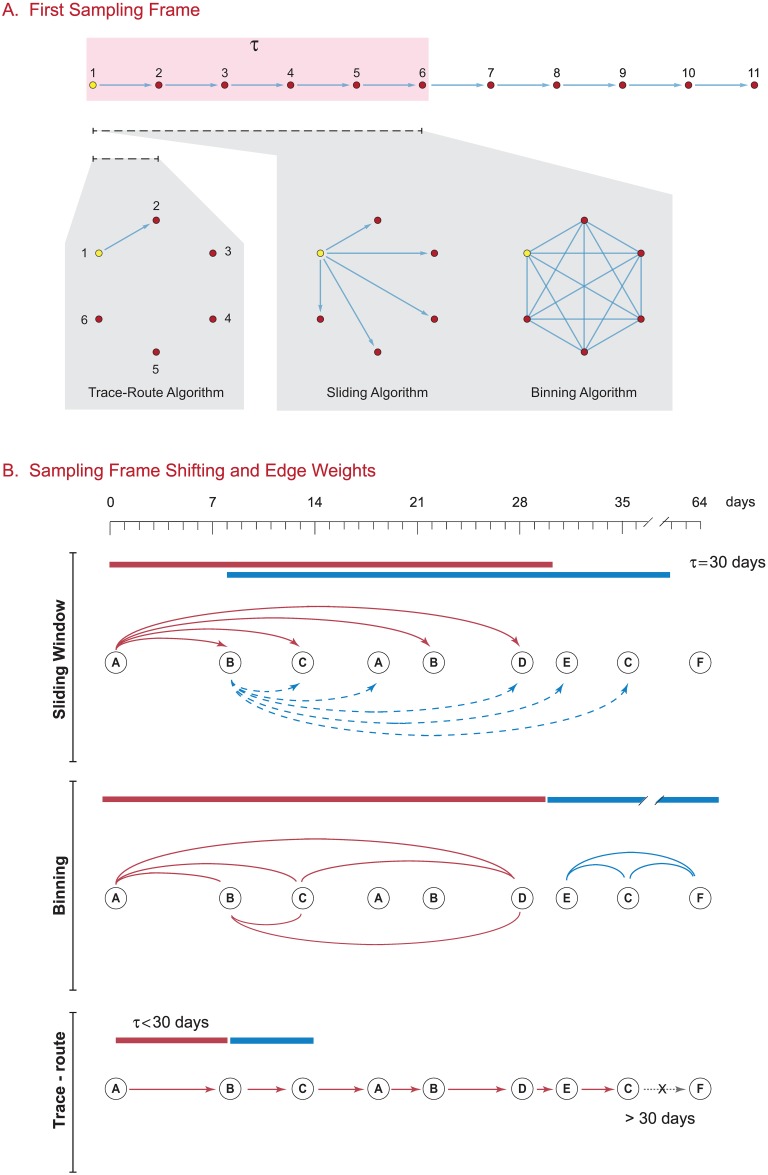
Network models of healthcare systems can be used to examine how providers collaborate, communicate, refer patients to each other, and to map how patients traverse the network of providers. Most healthcare service network models have been constructed from patient claims data, using billing claims to link a patient with a specific provider in time. The data sets can be quite large (106-108 individual claims per year), making standard methods for network construction computationally challenging and thus requiring the use of alternate construction algorithms. While these alternate methods have seen increasing use in generating healthcare networks, there is little to no literature comparing the differences in the structural properties of the generated networks, which as we demonstrate, can be dramatically different. To address this issue, we compared the properties of healthcare networks constructed using different algorithms from 2013 Medicare Part B outpatient claims data. Three different algorithms were compared: binning, sliding frame, and trace-route. Unipartite networks linking either providers or healthcare organizations by shared patients were built using each method. We find that each algorithm produced networks with substantially different topological properties, as reflected by numbers of edges, network density, assortativity, clustering coefficients and other structural measures. Provider networks adhered to a power law, while organization networks were best fit by a power law with exponential cutoff. Censoring networks to exclude edges with less than 11 shared patients, a common de-identification practice for healthcare network data, markedly reduced edge numbers and network density, and greatly altered measures of vertex prominence such as the betweenness centrality. Data analysis identified patterns in the distance patients travel between network providers, and a striking set of teaming relationships between providers in the Northeast United States and Florida, likely due to seasonal residence patterns of Medicare beneficiaries. We conclude that the choice of network construction algorithm is critical for healthcare network analysis, and discuss the implications of our findings for selecting the algorithm best suited to the type of analysis to be performed.


Conflict of interest statement

Competing Interests: We have the following interests: Timothy Boudreau and Hassan Chafi are employed by Oracle Labs. There are no patents, products in development or marketed products resulting from this manuscript to declare. This does not alter our adherence to all the PLOS ONE policies on sharing data and materials, as detailed online in the guide for authors.

Figures

Fig 1
Fig 1. Edge construction algorithms for healthcare teaming networks.
Each vertex represents a provider, with the index provider vertex in yellow. The collection of providers is for a single patient. (A) The brackets show how the time frame τ = 30 days is applied to a series of temporally ordered provider visits. The corresponding graphs show the edges that would be constructed between the provider vertices by each algorithm for that first iteration: a single directed edge for the trace-route algorithm, a set of directed edges (e.g. a star graph) for the sliding algorithm, and a complete graph with each vertex connected to all other vertices for the binning method. This process is repeated for each patient by shifting the sampling frame through the ordered visits for each patient. (B) Sampling frame shifting and edge weight construction. How each algorithm shifts the sampling frame τ through the series of provider visits is shown here, and the degree of shift for the next interval is shown by the new brackets. Please refer to the text for a discussion of edge weight calculations.
Fig 2
Fig 2. Network stability with different sampling frames.
To assess network stability at various τ, we plotted normalized vertex degree (k/kmax(τ)) versus P(k). Very small variations in the plots at τ = 30, 60, 90, 180 and 365 days indicate that network properties as a function of k/kmax(τ) do not vary substantially.
Fig 3
Fig 3. Geographic visualization of healthcare networks.
Provider-provider (A-E) and Organization-Organization (F-J) healthcare networks for the Medicare Part B 2013 Limited data set created using the trace-route algorithm with a temporal frame τ = 365 days, and plotted using a geographic layout tied to provider location. The graphs are censored by removing weighted edges with a value of 1 (only a single shared patient) and excluding them from the visualization giving edge counts of 9,267,241 for PPN and 808,358 for the OON. Each PPN image contains ∼ 1–9 million edges, and each OON image contains ∼ 0.2-2 million edges. Images are binned by distance between providers: ≤ 1 mile (A,F), 20-40 miles (B,G), 100-200 miles (C,F), 800-1000 miles (D,G), 2000-4000 miles (E,H).
Fig 4
Fig 4. Network vertex degree distribution by algorithm for τ = 365 days.
Fig 5
Fig 5. Healthcare networks power law with cutoff properties.
We analyzed PPN and OON for adherence to power a law distribution starting from a minimum vertex degree, (xmin), using the method of Clauset, et al [60] with τ = 365 days. The orange points are the CDF of the vertex degree, and the blue dashed line is the power law fit of the CDF given xmin and α.
Fig 6
Fig 6. Betweenness centrality Cβ of healthcare networks by algorithm for τ = 365 days betweenness centrality was calculated for all networks using the Oracle PGX algorithm.
Results are displayed with algorithmic binning of Cβ = Cβ / (N − 1)(N − 2) for directed graphs produced by the sliding frame and trace-route algorithms, and Cβ = 2Cβ / (N − 1)(N − 2) for undirected networks produced by the binning algorithm. All plots are scaled in the y-axis to frequency, allowing direct comparison of centralities. Note that edge-weight censoring (excluding edges with Ωvjvk ≤ 11) markedly changes the centrality distribution of all networks.
Fig 7
Fig 7. Network vertex counts, edge counts and density as a function of the sampling frame interval τ.
Vertex counts, edge counts and network density plotted for provider and organization networks for the binning (red), trace-route (orange) and sliding frame (blue) algorithms for τ = 30, 60, 90, 180, and 365 days. Solid lines represent networks where vertices were included if the minimum edge weight > = 1, while dashed lines represent censoring where only edges with a minimum edge weight > = 11 are included. The latter is the current standard for aggregate provider network data release by the Center for Medicare Services so that individual patients cannot be identified by a unique combination of providers sharing only a single patient.
Fig 8
Fig 8. Variation in provider community identification.
We analyzed undirected Provider-Provider networks constructed with the trace-route, sliding frame and binning algorithms for τ = 365 days, and censored for edge weights ≤ 11. Provider-Provider community teams identified for providers within NY State from each network using the Girvan-Newman modularity community finding algorithm [26] implemented in Mathematica. Each provider was assigned to only one community. (A) Provider densities. Hexagonal bins show the counts of providers that were members of any community within each geographic region color coded by range. Note the different geographic density patterns for each method. (B) Histogram of number of providers per community. Note the large number of communities (n) in each histogram, with the majority having only 2 providers. Community sizes, compositions and number differed between all 3 methods. (C) Shows the five largest communities identified in each network.

References

    1. Almansoori W, Gao S, Jarada TN, Elsheikh AM, Murshed AN, Jida J, et al. Link prediction and classification in social networks and its application in healthcare and systems biology. Network Modeling Analysis in Health Informatics and Bioinformatics. 2012;1(1):27–36. Available from: http://link.springer.com/article/10.1007/s13721-012-0005-7. 10.1007/s13721-012-0005-7 - DOI - DOI
    1. Cunningham FC, Ranmuthugala G, Plumb J, Georgiou A, Westbrook JI, Braithwaite J. Health professional networks as a vector for improving healthcare quality and safety: a systematic review. Quality and Safety in Health Care. 2012;21(3):239–249. Available from: http://qualitysafety.bmj.com/content/21/3/239. 10.1136/bmjqs-2011-000187 - DOI - PMC - PubMed
    1. Gray JE, Davis DA, Pursley DM, Smallcomb JE, Geva A, Chawla NV. Network analysis of team structure in the neonatal intensive care unit. Pediatrics. 2010;125(6):e1460–e1467. Available from: http://pediatrics.aappublications.org/content/125/6/e1460.full-text.pdf. 10.1542/peds.2009-2621 - DOI - PubMed
    1. Gundlapalli A, Ma X, Benuzillo J, Pettey W, Greenberg R, Hales J, et al. Social network analyses of patient-healthcare worker interactions: implications for disease transmission. In: AMIA Annual Symposium Proceedings. American Medical Informatics Association; 2009. p. 213. Available from: http://pubmedcentralcanada.ca/pmcc/articles/PMC2815400/pdf/amia-f2009-21.... - PMC - PubMed
    1. Jang HL, Lee YS, An JY. Application of social network analysis to health care sectors. Healthcare informatics research. 2012;18(1):44–56. Available from: 10.4258/hir.2012.18.1.44. - DOI - PMC - PubMed

LinkOut - more resources