. 2017 Apr 20;13(4):e1006693.
doi: 10.1371/journal.pgen.1006693. eCollection 2017 Apr.

Joint genetic analysis using variant sets reveals polygenic gene-context interactions

Affiliations

Joint genetic analysis using variant sets reveals polygenic gene-context interactions

Francesco Paolo Casale et al. PLoS Genet. .

Abstract

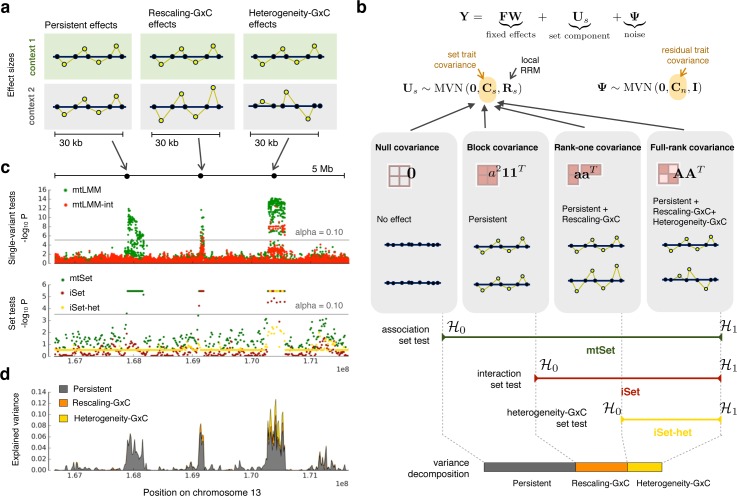
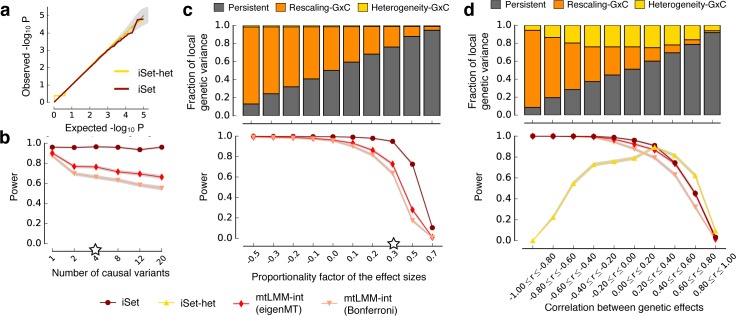
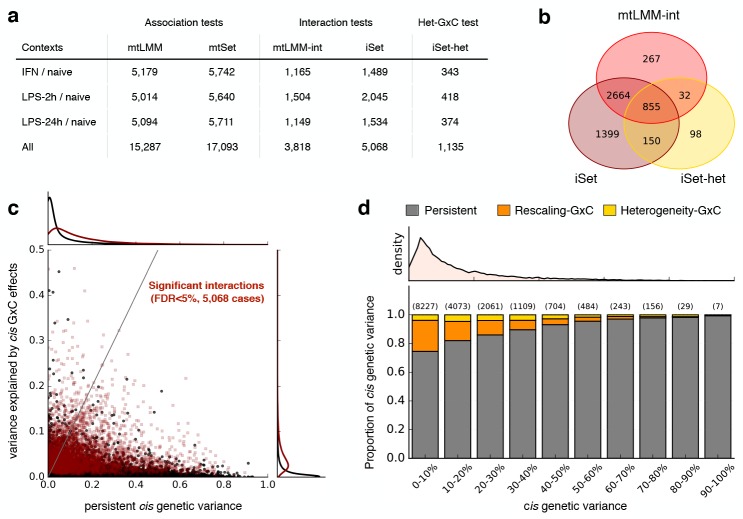
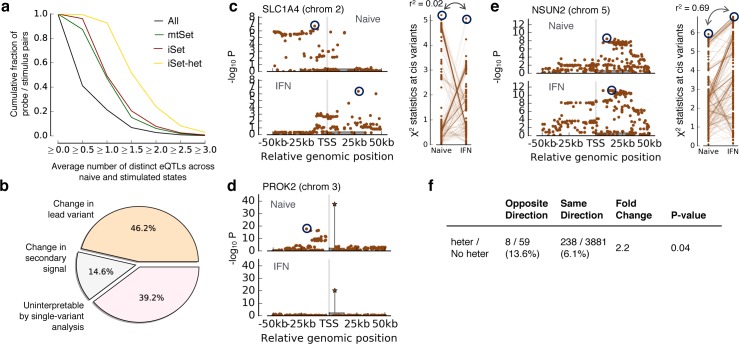
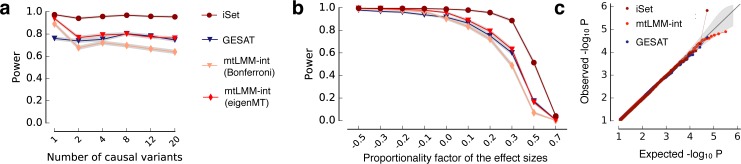
Joint genetic models for multiple traits have helped to enhance association analyses. Most existing multi-trait models have been designed to increase power for detecting associations, whereas the analysis of interactions has received considerably less attention. Here, we propose iSet, a method based on linear mixed models to test for interactions between sets of variants and environmental states or other contexts. Our model generalizes previous interaction tests and in particular provides a test for local differences in the genetic architecture between contexts. We first use simulations to validate iSet before applying the model to the analysis of genotype-environment interactions in an eQTL study. Our model retrieves a larger number of interactions than alternative methods and reveals that up to 20% of cases show context-specific configurations of causal variants. Finally, we apply iSet to test for sub-group specific genetic effects in human lipid levels in a large human cohort, where we identify a gene-sex interaction for C-reactive protein that is missed by alternative methods.


Conflict of interest statement

The authors have declared that no competing interests exist.

Figures

Fig 1
Fig 1. Illustration of the iSet model and different architectures of genotype-context interactions.
(a) Alternative genetic architectures that are explicitly modeled in iSet: persistent effects, where causal variants have identical effects across contexts (left panel), rescaling-GxC effects, where the effects of causal variants in one context are proportional to those in a second contexts (middle), and heterogeneity-GxC effects, with changes of causal variants or their relative effect sizes between contexts (right). (b) Illustration of the multivariate linear mixed model (LMM) that underlies iSet. Model comparisons of LMMs with different trait-context covariance of the set component Cs are used to define tests for general associations (mtSet), interactions (iSet) and heterogeneity-GxC effects (iSet-het). Additionally, the model can be used to estimate the proportion of variance that can be attributed to the corresponding genetic architectures (Methods). (c,d) Applications of iSet to a small simulated region. The total genetic effect was simulated as the sum of contributions from three loci with a persistent (left), rescaling-GxC (middle) and heterogeneity-GxC effects (right). (c) Manhattan plots of P values from a single-variant LMM [10] to test for associations (mtLMM) or interactions (mtLMM-int). Lower panel: Corresponding Manhattan plots for P values from set tests, considering a test for associations (mtSet), interactions (iSet) or heterogeneity-GxC (iSet-het), using consecutive regions (30 kb regions; step size 15 kb). Horizontal lines correspond to the α = 0.10 significance threshold (Bonferroni adjusted). P values of set tests are bounded (>10−6) by the number null model simulations to estimate significance levels (Methods). (d) Proportion of variance attributable to persistent effects, rescaling-GxC and heterogeneity-GxC, considering the same regions as in c.
Fig 2
Fig 2. Simulated data to assess statistical calibration and power of iSet.
(a) QQ plot for the P values obtained from iSet and iSet-het when only persistent genetic effects were simulated. The step in the QQ-plot for large p-values is observed because the trait-context covariances are required to be positive-semidefinite. (b) Power comparison of alternative models for detecting simulated interactions, considering rescaling-GxC effects (without heterogeneity-GxC) for increasing numbers of simulated causal variants at constant total genetic variance. Compared were iSet and a single-variant interaction test (mtLMM-int) [10], using two alternative approaches to adjust for multiple testing of single variant methods (Bonferroni or eigenMT). (c) Lower panel: analogous power comparison as in b, when varying the proportionality factor of effect sizes between contexts. A proportionality factor of zero corresponds to genetic effects that act only in one of the contexts. See S3 Table for the relationship of the proportionality factor and fold differences. iSet-het was not considered, because all simulated rescaling-GxC are consistent with the null model of iSet-het. Top panel: average fraction of genetic variance attributable to persistent, rescaling-GxC and heterogeneity-GxC effects for the corresponding simulations. (d) Analogous comparison as in c but for simulated heterogeneity-GxC effects, when varying the correlation of the total genetic effect between contexts. Additionally, we also considered iSet-het to test for heterogeneity-GxC, which was best powered for heterogeneity-GxC effects that were uncorrelated between contexts. White stars denote default parameter values that were kept constant when varying other parameters (S2 Table). Statistical power was assessed at 5% FDR across 1,000 repeat experiments.
Fig 3
Fig 3. Analysis of stimulus-specific eQTLs in monocytes.
(a) Number of probes with at least one significant cis association (Association test) or genotype-stimulus interaction (Interaction test) for alternative methods and stimulus contexts. Considered were the proposed set tests (mtSet, iSet, iSet-het) as well as single-variant multi-trait LMMs (mtLMM, mtLMM-int [10]), testing for genetic effects in cis (100kb region centered on the transcription start site; FDR < 5%). Additionally, iSet-het was used to test for heterogeneity-GxC effects. Individual rows correspond to different stimulus contexts with “All” denoting the total number of significant effects across all stimulus contexts. (b) Venn diagram of probes and stimuli with significant interactions identified by alternative methods and tests (across all stimuli). (c) Bivariate plot of the variance attributed to persistent genetic effects versus genotype-stimulus interactions for all probes and stimuli. Significant interactions are shown in red. Density plots along the axes indicate the marginal distributions of persistent genetic variance (top) and variance due to interaction effects (right), either considering all (black) or probe/stimulus pairs with significant interactions (iSet in a, dark red). (d) Average proportions of cis genetic variance attributable to persistent effects, rescaling effects and heterogeneity-GxC, considering probe/stimulus pairs with significant cis effects (5% FDR, mtSet), stratified by increasing fractions of the total cis genetic variance. Shown on top of each bar is the number of instances in each variance bin. The top panel shows the density of probes as a function of the total cis genetic variance.
Fig 4
Fig 4. Characterization of genes with significant heterogeneity GxC for stimulus eQTLs in monocytes.
(a) Cumulative fraction of probe/stimulus pairs with increasing numbers of distinct univariate eQTLs (average of the naïve and the stimulated state using step-wise selection) for different gene sets (Methods). Shown are cumulative fractions of all probe/stimulus pairs (All), those with significant cis associations (mtSet), pairs with significant GxC (iSet) and instances with significant heterogeneity GxC (iSet-het). (b) Breakdown of 1,281 probe/stimulus pairs with significant heterogeneity GxC into distinct classes defined using the results of a single-variant step-wise LMM (Methods). (c-e) Manhattan plots for representative probes with significant heterogeneity GxC effects. Grey boxes indicate the gene body. (c) Manhattan plot (left) and χ2 statistics for variants in both contexts (right) for the gene SLC1A4. Dark circles indicate distinct lead variants in both contexts (r2<0.2). (d) Manhattan plot after conditioning on the lead variant (secondary associations in the stepwise LMM) for the gene PROK2. The star symbol indicates the shared lead variant in both contexts. The conditional analysis reveals a secondary association that is specific to the naïve state. (e) Analogous plot as in c for the gene NSUN2, for which the single-variant model did not provide an interpretation of heterogeneity-GxC. (f) Breakdown of probe / stimulus pairs with shared lead variants, stratified by concordance of the effect direction (opposite-direction versus same-direction eQTLs) and significance of the heterogeneity-GxC test (heter vs No heter; FDR 5%). eQTLs with opposite effects were enriched for significant heterogeneity-GxC (2.2 fold enrichment, P<4e-2).
Fig 5
Fig 5. Application of iSet to stratified designs.
(a,b) Power comparison of iSet and alternative methods using simulated data where each individual is phenotyped in one of two contexts. Shown is a comparison of power for alternative methods. (a) Power to detect interactions when simulating rescaling-GxC for increasing numbers of causal variants. (b) Power when varying the factor of proportionality of the variant effect sizes between contexts. Considered were iSet, a single-variant interaction test (mtLMM-int, [10]) as well as the interaction sequence kernel association test (GESAT, [13]), a set test designed for stratified populations. For single-variant models, two alternative approaches to adjust for multiple testing were considered (Bonferroni, eigenMT). (c) QQ-plot of P values from genotype-sex interaction tests for C-reactive protein levels using individuals from the Northern Finland Birth Cohort [20], considering the same methods.

Similar articles

Cited by

References

    1. Kang HM, Sul JH, Service SK, Zaitlen NA, Kong SY, Freimer NB, et al. Variance component model to account for sample structure in genome-wide association studies. Nature genetics. 2010;42(4):348–54. PubMed Central PMCID: PMC3092069. doi: 10.1038/ng.548 - DOI - PMC - PubMed
    1. Yang J, Zaitlen NA, Goddard ME, Visscher PM, Price AL. Advantages and pitfalls in the application of mixed-model association methods. Nature genetics. 2014;46(2):100–6. PubMed Central PMCID: PMC3989144. doi: 10.1038/ng.2876 - DOI - PMC - PubMed
    1. Rakitsch B, Stegle O. Modelling local gene networks increases power to detect trans-acting genetic effects on gene expression. Genome biology. 2016;17(1):33. PubMed Central PMCID: PMC4765046. - PMC - PubMed
    1. Fusi N, Stegle O, Lawrence ND. Joint modelling of confounding factors and prominent genetic regulators provides increased accuracy in genetical genomics studies. PLoS computational biology. 2012;8(1):e1002330 PubMed Central PMCID: PMC3252274. doi: 10.1371/journal.pcbi.1002330 - DOI - PMC - PubMed
    1. Listgarten J, Kadie C, Schadt EE, Heckerman D. Correction for hidden confounders in the genetic analysis of gene expression. Proceedings of the National Academy of Sciences of the United States of America. 2010;107(38):16465–70. PubMed Central PMCID: PMC2944732. doi: 10.1073/pnas.1002425107 - DOI - PMC - PubMed

Publication types

Substances