. 2017 Apr 19;94(2):278-293.e9.
doi: 10.1016/j.neuron.2017.03.042.

iPSC-Derived Human Microglia-like Cells to Study Neurological Diseases

Affiliations

iPSC-Derived Human Microglia-like Cells to Study Neurological Diseases

Edsel M Abud et al. Neuron. .

Abstract

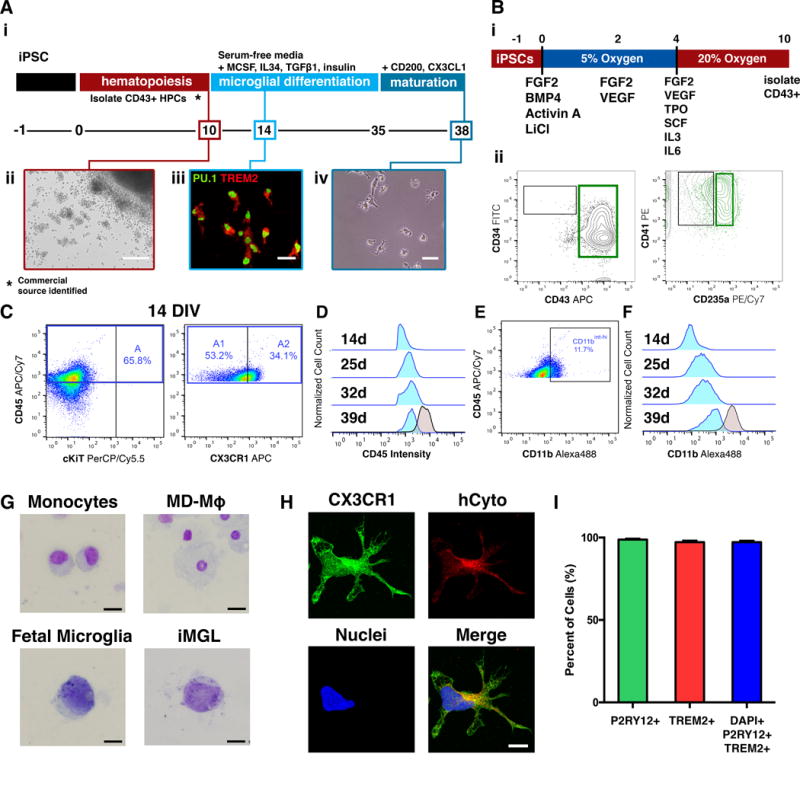
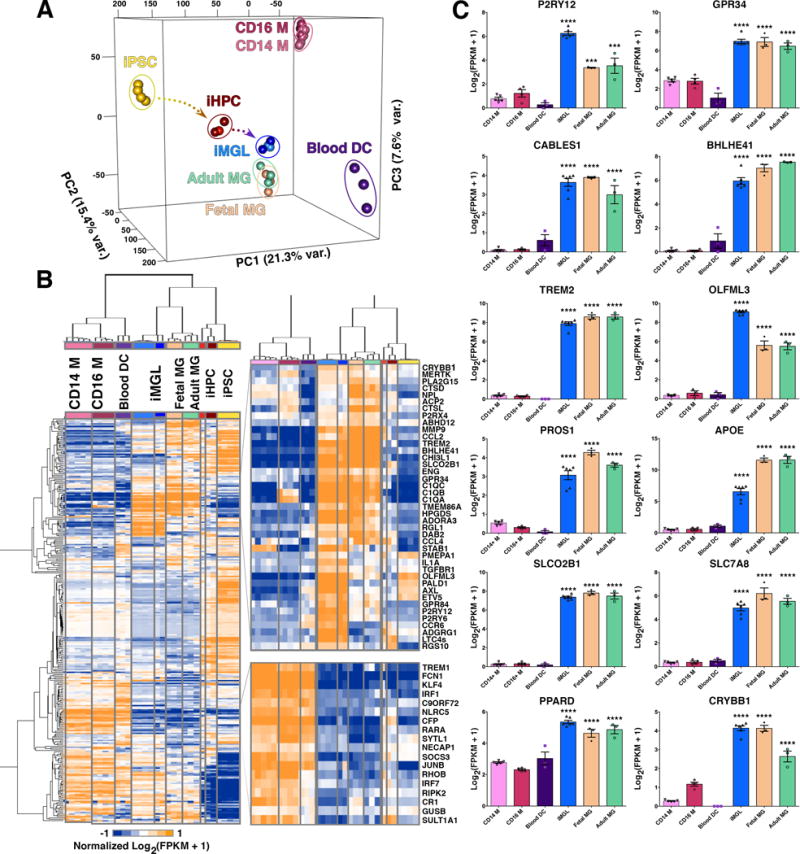
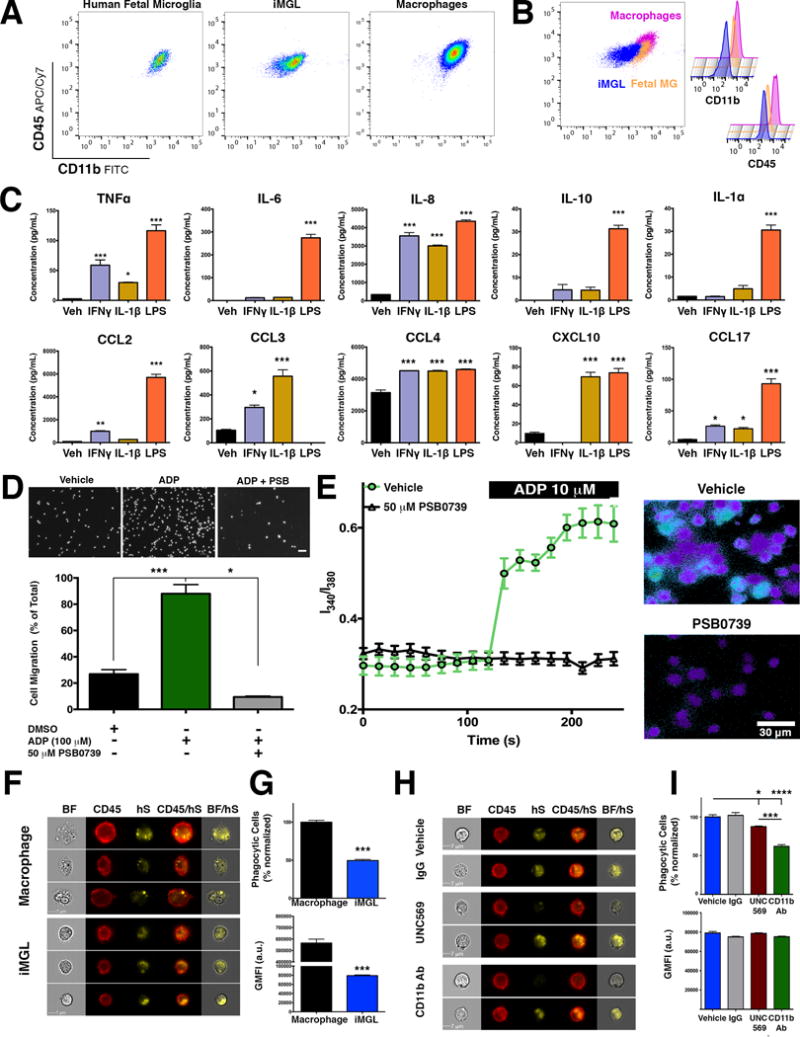
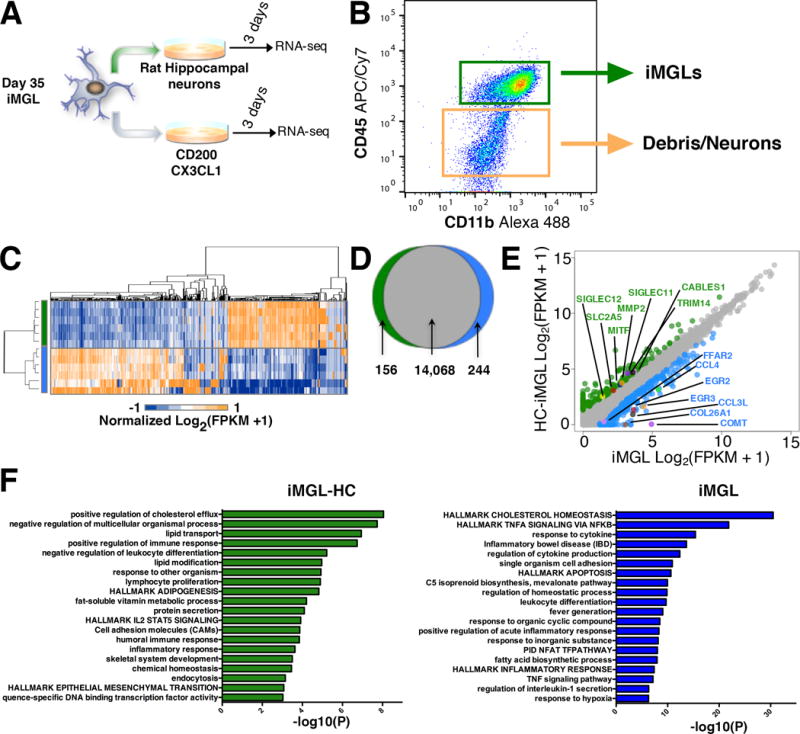
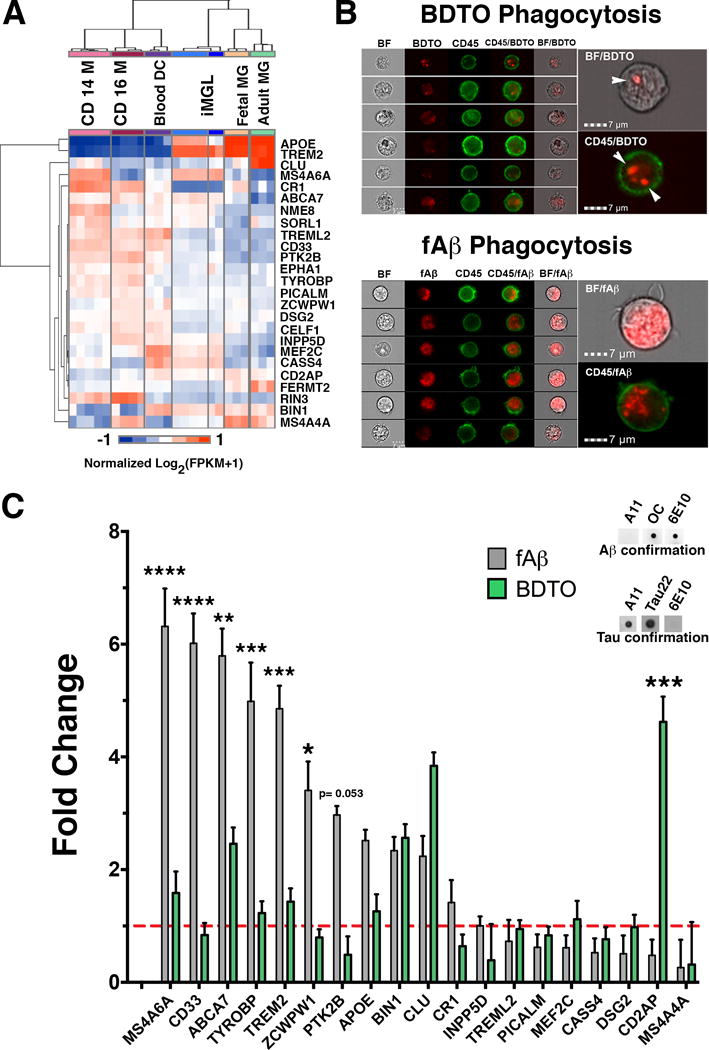
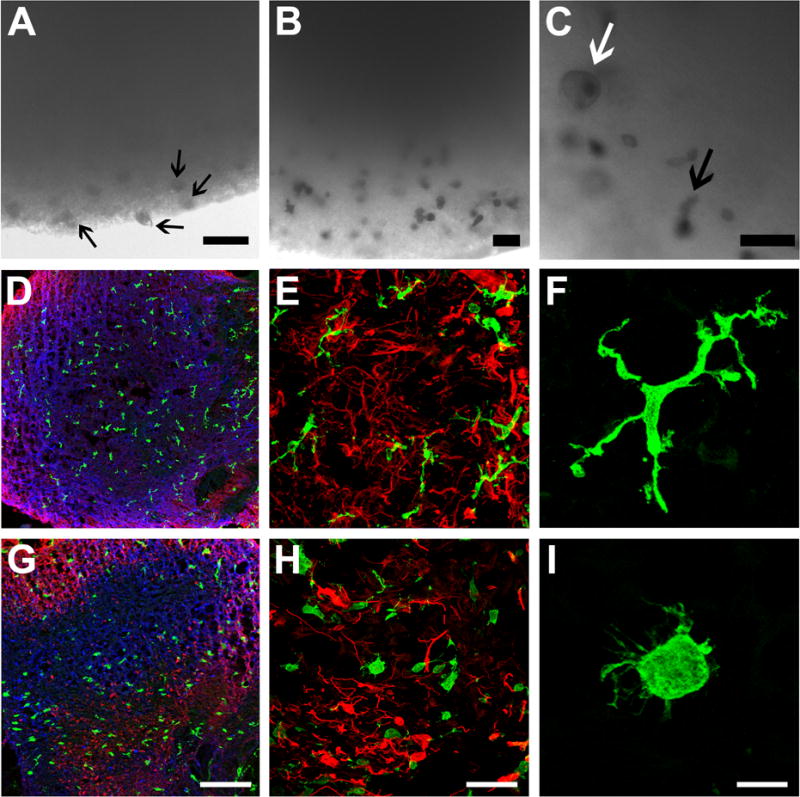
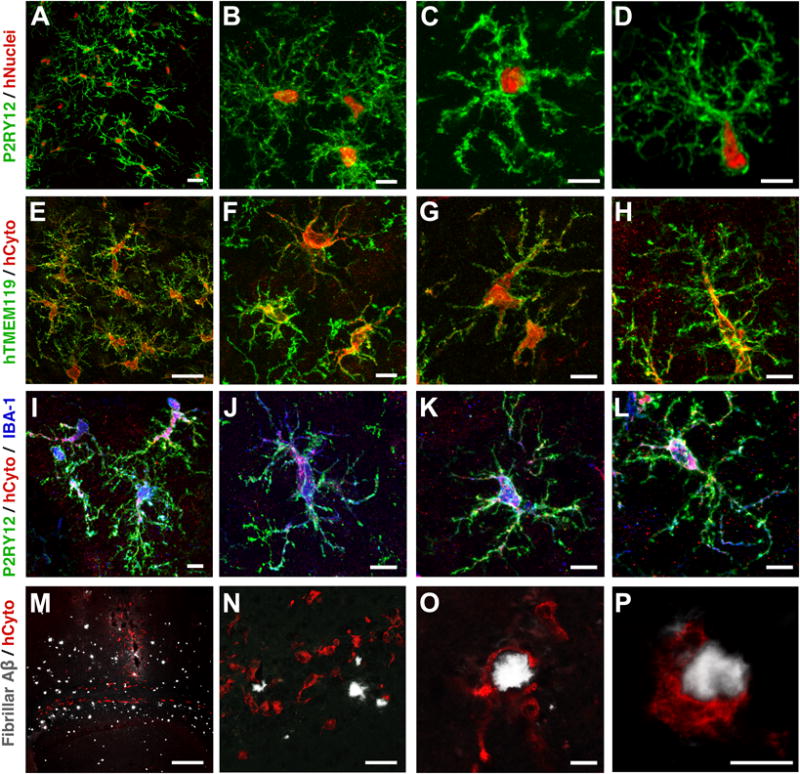
Microglia play critical roles in brain development, homeostasis, and neurological disorders. Here, we report that human microglial-like cells (iMGLs) can be differentiated from iPSCs to study their function in neurological diseases, like Alzheimer's disease (AD). We find that iMGLs develop in vitro similarly to microglia in vivo, and whole-transcriptome analysis demonstrates that they are highly similar to cultured adult and fetal human microglia. Functional assessment of iMGLs reveals that they secrete cytokines in response to inflammatory stimuli, migrate and undergo calcium transients, and robustly phagocytose CNS substrates. iMGLs were used to examine the effects of Aβ fibrils and brain-derived tau oligomers on AD-related gene expression and to interrogate mechanisms involved in synaptic pruning. Furthermore, iMGLs transplanted into transgenic mice and human brain organoids resemble microglia in vivo. Together, these findings demonstrate that iMGLs can be used to study microglial function, providing important new insight into human neurological disease.

Keywords: 3D organoids; AD-GWAS; Alzheimer’s disease; Beta-amyloid; Tau; cell models of disease; induced pluripotent stem cells; microglia; mouse transplantation; neurodegenerative diseases.


Conflict of interest statement

Conflict of Interests

The authors declare no conflict of interests.

Figures

Figure 1
Figure 1. Differentiation of human iPSC derived microglia like cells (iMGLs)
(A) Schematic of fully-defined iMGL differentiation protocol. (i) Human iPSCs are differentiated to CD43+ iHPCs for 10 days and then cultured in serum-free microglia differentiation media containing human recombinant MCSF, IL-34, and TGFβ-1. Differentiation is carried out for an additional 25 days after which iMGLs are exposed to human recombinant CD200 and CX3CL1 for 3 days. (ii) Representative image of iHPCs in cell culture at day 10. Scale bar = 100 μm. (iii) By day 14, iMGLs express PU.1 (green) and TREM2 (red). Scale bar = 50 μm. (iv) Representative phase contrast image of iMGL at day 38. (B) Schematic of differentiation of iPSCs to iHPCs. (i) Single-cell iPSCs are differentiated in a chemically defined media supplemented with hematopoietic differentiation factors and using 5% O2 (4 days) and 20% O2 (6 days). (ii) After 10 days, CD43+ iHPCs are CD235a+/CD41a+(C) iMGLs develop from CD45+/CX3CR1 (A1) and CD45+/CX3CR1+ (A2) progenitors. (D) CD45 fluorescence intensity shows that iMGLs (blue) maintain their CD45lo-int profile when compared to monocyte-derived macrophages (MD-Mφ). (E) iMGL progenitors are CD11blo and increase their CD11b expression as they mature. At 14 DIV, a small population (~11%) cells with CD11bint-hi are detected. (F) CD11b fluorescence intensity demonstrates that CD11b expression increases as iMGLs age, resembling murine microglial progenitors identified by Kierdorf, et al 2013. (G) Mary-Grunwald Giemsa stain of monocytes, MD-Mφ, fetal microglia, and iMGLs. Both fetal microglia and iMGL exhibit a high nucleus to cytoplasm morphology compared to monocytes and MD-Mφ. Scale bars = 16 μm. (H) iMGLs also exhibit extended processes and express CX3CR1 (green) together with the human cytoplasmic marker (hCyto, SC121; red). (I) Differentiation yields >97.2% purity as assessed by co-localization of microglial-enriched protein P2RY12 (green), microglial-enriched TREM2 (red) and nuclei (blue (n=5 representative lines). See also Figures S1 and S2.
Figure 2
Figure 2. iMGL transcriptome profile is highly similar to human adult and fetal microglia
(A) 3D Principal Component Analysis (PCA) of iMGLs (blue), human adult microglia (Adult MG; green), human fetal microglia (Fetal MG; beige), CD14+/CD16 monocytes (CD14 M; pink), CD14+/16+ monocytes (CD16 M; maroon), blood dendritic cells (Blood DC; purple), iHPCs (red), and iPSCs (yellow) (FPKM ≥ 1, n=23,580 genes). PCA analysis reveals that iMGL cluster with Adult and Fetal MG and not with other myeloid cells. PC1 (21.3% var) reflects the time-series of iPSC differentiation to iHPC (yellow arrow) and then to iMGLs (blue arrow). PC2 (15.4% var) reflects the trajectory to Blood DCs. PC3 (7.6% var) reflects the trajectory to monocytes (B) Heatmap and biclustering (Euclidean-distance) on 300 microglia, myeloid, and other immune related genes (Butovsky et al., 2014; Hickman et al., 2013; Zhang et al., 2014). A pseudo-count was used for FPKM values (FPKM +1), log2-transformed and each gene was normalized in their respective row (n=300). Representative profiles are shown for genes up and down regulated in both human microglia (fetal/adult) and iMGLs. (C) Bar graphs of microglial-specific or –enriched genes measured in iMGL, Fetal and Adult MG, Blood DC, CD14 M, and CD16 M as [Log2 (FPKM +1)] presented as mean ± SEM. Data was analyzed using one-way ANOVA followed by Tukey’s corrected multiple comparison post hoc test. Statistical annotation represents greatest p-value for iMGL, Fetal MG, and Adult MG to other myeloid cells. CD14 M (n=5, CD16 M (n=4), Blood DC (n=3), iMGL (n=6), Fetal MG (n=3), and Adult MG (n=3). *p<0.05, **p<0.01, ***p<0.001, ****p<0.0001. Complete statistical comparisons are provided in Table S1. See also Figures S2 and S3.
Figure 3
Figure 3. iMGLs are physiologically functional and can secrete cytokines, respond to ADP, and phagocytose human synpatosomes
(AB) By flow cytometry analysis, iMGL (blue) are CD45lo-int similar to fetal MG (orange) but different from CD45hi MD-Mφ (fuchsia). (B) Histogram of CD11b intensity (left) reveals that Fetal MG express slightly more CD11b than iMGL but less than MD-Mφ. (C) iMGLs secrete cytokines and chemokines when stimulated for 24 hours with either IFNγ (20 ng/ml), IL-1β (20 ng/ml), or LPS (100 ng/ml) by ELISA multiplex. (D) ADP (100 μM) induces iMGL migration in a trans-well chamber (5 μm). Pre-exposure to the P2ry12 antagonist, PSB0739 (50 μM, 1 hr) completely abrogates ADP-induced iMGL migration (***p<0.0001). (E) ADP induces calcium flux in iMGLs via P2ry12 receptors. (Left) Exposure to ADP leads to elevated calcium influx (I340/I380 ratio) in vehicle group (green trace) but not in PSB0739-treated group (black trace). (Right) Representative images of ADP-induced calcium flux at 240 s in vehicle (top) and PSB0739 (bottom). (F) iMGLs phagocytose human brain-derived synaptosomes (hS). Representative images captured on Amnis Imagestream display phagocytosis of hS by MD-Mφ and iMGLs. (G) Quantification of phagocytosis shows that iMGLs internalize hS at 50% of macrophage capacity (p<0.0001). (H) Representative images of iMGL phagocytosis of hS in the presence of either a Mertk inhibitor UNC569 (top) or anti-CD11b antibody (bottom). (I; top) iMGL phagocytosis of hS phagocytosis is reduced byby approximately 12% (burgundy bar, p<0.05) by blocking Mertk, but 40% (p<0.0001, green bar) by inhibiting CR3 via CD11b blockade. (I; bottom) Sub-analysis of iMGLs exhibiting a phagocytic event reveals similar average amounts of internalization across treatment groups (p=0.1165). All histograms reported as mean ± SEM. Cytokine and migration assays one-way ANOVA, followed by Dunnett’s multiple-comparison post-hoc test, ***p<0.0001, **p<0.001, *p<0.05; Cytokine assay: n=3 wells/group. Migration Assay: n=5 fields/condition. Calcium assay: vehicle (n=37 cells), PSB0739-treated (n=17 cells), I340/I380 represented as mean ± SEM at each time point. Phagocytosis assay: MD-Mφ vs iMGL: Unpaired t-test, **p<0.001, n=3 wells/group. MERTK and CR3 assay, one-way ANOVA, followed by Tukey’s multiple-comparison post-hoc test, ***p<0.0001; n= 6 for vehicle, n=3 wells/group. See also Figure S4.
Figure 4
Figure 4. Alzheimer Disease risk factor GWAS genes can be investigated using iMGLs and high throughput genomic and functional assays
(A). Heatmap of 25 immune genes with variants associated with LOAD reveals that major risk factors APOE and TREM2 are highly expressed in iMGLs, Adult MG, and Fetal MG. (B) iMGLs internalize fluorescent-labeled fAβ and pHrodo-dye BDTO. Representative images captured on Amnis Image StreamX Mark II. (C) iMGLs were exposed to unlabeled fAβ (5 μg-ml−1) and BDTOs (5 μg/ml) for 24 h and mRNA expression of 19 GWAS genes was assessed via qPCR array. fAβ treatment elevated the expression of 10 genes above 2-fold compared to vehicle, including MS4A6A (6.3 fold), CD33 (6.1 fold), ABCA7 (5.8 fold), TYROBP (4.98) and TREM2 (4.85 fold). Whereas, BDTO exposure elevated the expression of 4 genes above two-fold compared to vehicle. Six genes were differentially expressed in fAβ compared to BDTO. Both fAβ and BDTO preparations were confirmed via dot-blot analysis with conformation structural specific antibodies for oligomers (A11), fibrils (OC) and non-structural-specific antibodies for human Aβ (6E10) and tau oligomers (Tau22). Target genes were normalized to GAPDH and compared to vehicle expression by ΔΔCt. Bars show expression fold mean ± SEM. Red hash bar is ΔΔCt = 1Two. Two-Way ANOVA, followed by Sidak’s multiple-comparison post-hoc test, ***p<0.0001, **p<0.001, *p<0.05; n=6 wells/group. Data represented as mean ± SEM. See also Figures S5 and S6.
Figure 5
Figure 5. iMGLs gene profiles are responsive to neuronal environment
(A) Schematic of iMGL co-culture with or without rat hippocampal neurons. (B) iMGLs co-cultured with neurons were collected, isolated by flow cytometry and transcriptomes evaluated via RNA-sequencing. (C) Heat map of iMGLs and iMGL-HC gene expression highlights uniquely enriched genes. (D) Differential gene expression analysis highlights 156 upregulated and 244 downregulated genes in iMGL-HCs. (E) Scatter plot of differentially expressed genes [> 2 Log2(FPKM+1)] highlight TRIM14, CABLES1, MMP2, SIGLEC 11 and 12, MITF, and SLC2A5 being enriched in iMGL-HCs, suggesting that iMGLs respond appropriately to a neuronal environment. Cells cultured alone are enriched for COMT, EGR2, EGR3, and FFAR2 suggesting a primed microglia phenotype. (F) GO and pathway terms from differential gene expression analysis of iMGLs cultured with hippocampal neurons. Genes upregulated in iMGL-HC are associated with 20 statistically significant pathway modules (green histogram) including positive cholesterol efflux, lipid transport, positive regulation of immune response, negative regulation of leukocyte differentiation and cell adhesion molecules. Cells cultured in absence of neurons had a complimentary gene profile with 20 statistically significant biological modules (blue histogram) including hallmark cholesterol homeostasis, hallmark TNFα signaling via NF-κB, leukocyte differentiation, and regulation of IL-1β secretion.
Figure 6
Figure 6. iMGLs respond to the neuronal environment in 3D brain organoid co-cultures (BORGS)
iMGLs (5 × 10⁵ cells) were added to media containing a single BORG for 7 days. (A) Representative bright-field image of iMGLs detected in and near BORG after 3 days. iMGLs were found in and attached to the BORG-media interface (arrows), but not free floating in the media, suggesting complete chemotaxis of iMGLs. (B) Representative image of iMGLs in outer and inner radius of BORG. (C) Embedded iMGLs exhibit macrophage-like morphology (white arrow) and extend processes (arrow) signifying ECM remodeling and surveillance respectively. Simultaneous assessment of embedded iMGL morphology in uninjured (D–F) and injured (G–I) BORGs. (D) Immunohistochemical analysis of BORGs reveals iMGLs begin tiling evenly throughout the BORG and project ramified processes for surveillance of the environment. BORGs are representative of developing brains in vitro and contain neurons (β3-tubulin, blue) and astrocytes (GFAP, red), which self-organize into a cortical-like distribution, but lack microglia. iMGLs (IBA1, green). (E–F) Representative immunofluorescent images of iMGLs with extended processes within the 3D CNS environment at higher magnification. (G–I) Representative images of iMGL morphology observed in injured BORG. (H–I) Round-bodied iMGLs reminiscent of amoeboid microglia are distributed in injured BORGs and closely resemble activated microglia, demonstrating that iMGLs respond appropriately to neuronal injury. Scale Bar (A–C) =50 μm in A-C, (D,G)= 200 μm (E–H)= 80 μm and (F,I) =15 μm.
Figure 7
Figure 7. iMGLs transplanted into the brains of either wild-type or AD transplant competent mice are like brain microglia
Within the brains of xenotransplantation compatible mice, transplanted iMGLs are ramified and interact with the neuronal environment. (A–L) After two months in vivo, iMGLs transplanted into mice display long-term viability with highly arborized processes resembling endogenous microglia found in the brain. (A) Transplanted iMGLs, labeled with P2ry12 (green; HPA HPA014518, Sigma) and human nuclei (ku80, red), exhibit long-term viability in mice. (B–D) At higher magnification, P2ry12 is highly expressed in iMGL arborized processes, both suggestive of homeostatic microglia surveying the brain environment. (E–H) Ramified iMGLs also express microglia-enriched Tmem119 recognized by a human-specific Tmem119 antibody (green; ab185333, Abcam, identified and validated in [Bennet et al, PNAS 2016], and human cytoplasm maker SC121 (hCyto, red). (I–L) At higher magnification, representative iMGLs express P2ry12 (green), hCyto (red), and Iba1 (blue; ab5076, Abcam). (M–P) Human iMGLs (hCyto,red) transplanted into AD-immune-deficient mice (Marsh et al, PNAS 2016) interact with and phagocytose amyloid plaques (white). (I–J) Transplanted iMGLs extend projections and migrate to plaques. iMGLs fully encompass amyloid plaques (O) and begin to phagocytose amyloid (P). Scale bars; (A,E,N) = 30 μm, (B–D, F–H, I–L, O,P) = 10 μm, (M) = 300 μm. n=3 animals per study. See also Figure S7.

References

    1. Abbas N, Bednar I, Mix E, Marie S, Paterson D, Ljungberg A, Morris C, Winblad B, Nordberg A, Zhu J. Up-regulation of the inflammatory cytokines IFN-gamma and IL-12 and down-regulation of IL-4 in cerebral cortex regions of APP(SWE) transgenic mice. J Neuroimmunol. 2002;126:50–57. - PubMed
    1. Abdollahi A, Lord KA, Hoffman-Liebermann B, Liebermann DA. Interferon regulatory factor 1 is a myeloid differentiation primary response gene induced by interleukin 6 and leukemia inhibitory factor: role in growth inhibition. Cell Growth Differ. 1991;2:401–407. - PubMed
    1. Abutbul S, Shapiro J, Szaingurten-Solodkin I, Levy N, Carmy Y, Baron R, Jung S, Monsonego A. TGF-beta signaling through SMAD2/3 induces the quiescent microglial phenotype within the CNS environment. Glia. 2012;60:1160–1171. - PubMed
    1. Aguzzi A, Barres BA, Bennett ML. Microglia: scapegoat, saboteur, or something else? Science. 2013;339:156–161. - PMC - PubMed
    1. Andreasson KI, Bachstetter AD, Colonna M, Ginhoux F, Holmes C, Lamb B, Landreth G, Lee DC, Low D, Lynch MA, et al. Targeting innate immunity for neurodegenerative disorders of the central nervous system. J Neurochem. 2016;138:653–693. - PMC - PubMed