. 2017 Apr 19;94(2):312-321.e3.
doi: 10.1016/j.neuron.2017.03.047.

Assembly of Excitatory Synapses in the Absence of Glutamatergic Neurotransmission

Affiliations

Assembly of Excitatory Synapses in the Absence of Glutamatergic Neurotransmission

Richard Sando et al. Neuron. .

Abstract

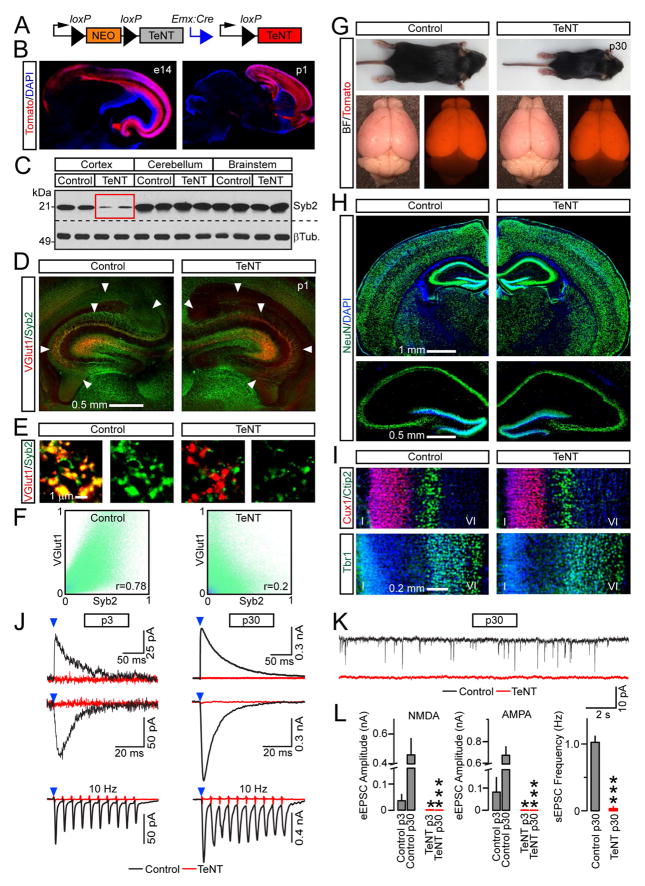
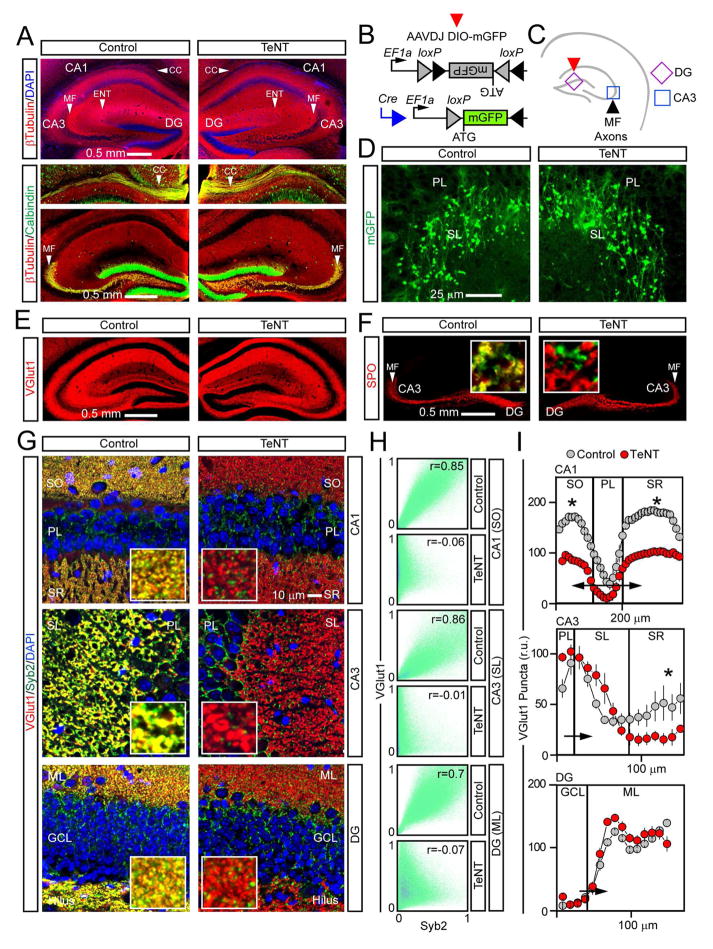
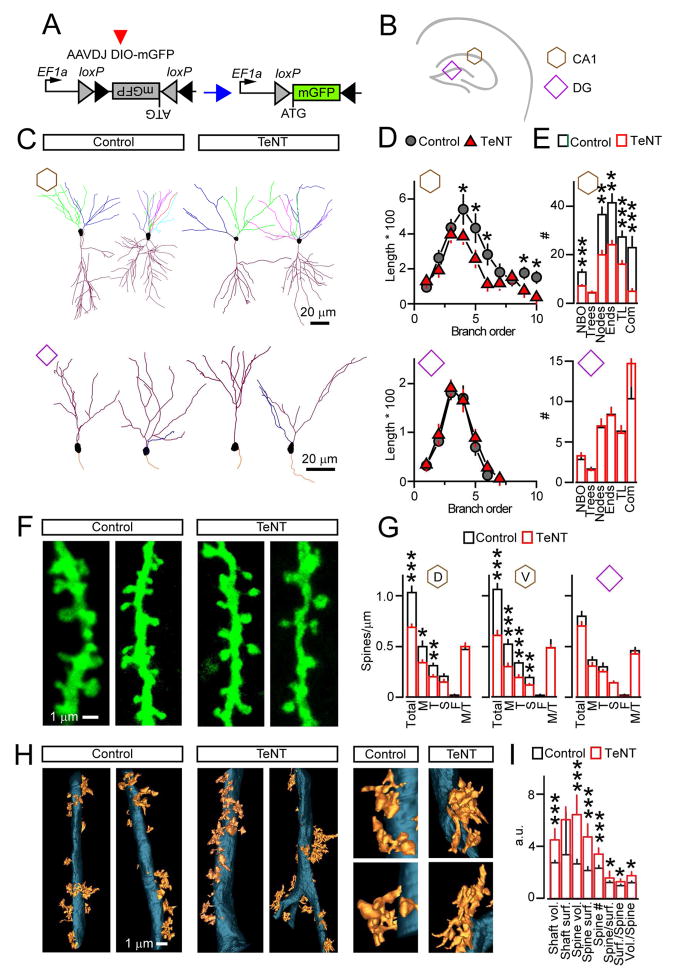
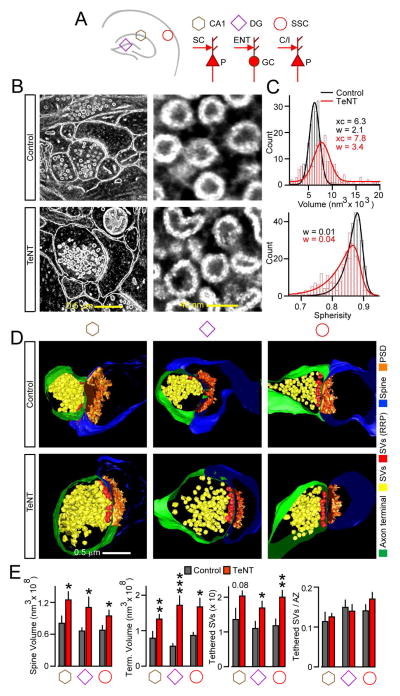
Synaptic excitation mediates a broad spectrum of structural changes in neural circuits across the brain. Here, we examine the morphologies, wiring, and architectures of single synapses of projection neurons in the murine hippocampus that developed in virtually complete absence of vesicular glutamate release. While these neurons had smaller dendritic trees and/or formed fewer contacts in specific hippocampal subfields, their stereotyped connectivity was largely preserved. Furthermore, loss of release did not disrupt the morphogenesis of presynaptic terminals and dendritic spines, suggesting that glutamatergic neurotransmission is unnecessary for synapse assembly and maintenance. These results underscore the instructive role of intrinsic mechanisms in synapse formation.

Keywords: active zone; dendritic spine; glutamate release; hardwiring; hippocampus; memory; neural circuit development; neurotransmission; synapse; synaptic vesicle exocytosis.


Figures

Figure 1
Figure 1. Characterization of Emx1/TeNT mice
(A) Emx1IRES-Cre-inducible expression of TeNT from the R26floxstopTeNT allele. (B) Recombinase activity of Emx1IRES-Cre was assessed with Ai9 tdTomato Cre reporter in brains of e14 embryos and p1 pups. See also Figure S1. (C) Protein extracts from different brain regions of p1 control and Emx1/TeNT mice were tested by immunoblotting for Syb2 and βTubulin. (D to F) Brain sections from p1 control and Emx1/TeNT mice were labeled with antibodies against Syb2 and VGlut1. (D) Low-magnification confocal images show a loss of Syb2 in projections of excitatory neurons carrying TeNT (arrows). (E) Individual presynaptic boutons in the CA1. (F) Colocalization of VGlut1 and Syb2 in stratum oriens of the CA1. Pseudo colored pixel intensity graphs and Person’s correlation coefficients (r) demonstrate the extent of overlap of two fluorophores in 1002 μm image frames. See also Figure S2. (G to I) Control and Emx1/TeNT mice were examined at 4 weeks of age. See also Figure S3. (G) Intact animals and brains. Mice of both genotypes also carried the Ai9 allele. (H and I) Brain sections were imaged after labeling with indicated antibodies. (H) Staining for pan-neuronal marker, NeuN. (I) Distribution of layer-specific excitatory neurons in somatosensory cortex. Top: Cux1 (layers II/III) and Ctip2 (layer V). Bottom: Tbr1 (layer VI). (J to L) Glutamatergic neurotransmission in the hippocampus at p3 and p30. EPSCs were monitored from CA1 pyramidal cells in acute slices. (J) Superimposed traces of evoked NMDA (outward) and AMPA (inward) EPSCs that were sampled at +40 and −70 mV, respectively. Schaffer collaterals were stimulated at 0.1 Hz (top) or 10 Hz (bottom, averaged traces from 10 consecutive sweeps are shown). Note the differences in scales. (K) Spontaneous EPSCs at p30. (L) Averaged EPSCs amplitudes and frequencies of spontaneous events. p3: Control, n = 2 mice/6 neurons; TeNT, n = 2/6. p30: Control, n = 3/4; TeNT, n = 3/5. *P < 0.05; ***P < 0.001 (Student’s t-test). See also Table S1.
Figure 2
Figure 2. Presynaptic differentiation of excitatory neurons
Axons and presynaptic terminals of glutamatergic neurons in hippocampi of 4 weeks old animals. (A) Sections were stained with antibodies against βTubulin and Calbindin. CC = corpus callosum; MF = GC mossy fibers; ENT = axons of layer II entorhinal cortical neurons that terminate in the CA3. (B to D) Mossy fibers were tagged in vivo with AAVDJ DIO-mGFP. (B) Schematic diagram of reporter induction in excitatory neurons. (C) Sites of mGFP expression and location of inspected axons. (D) GC axons and large mossy fiber terminals (LMTs) in the CA3. SL = stratum lucidum; PL = pyramidal cell layer. See also Figure S5. (E and F) Glutamatergic terminals were labeled with antibodies against VGlut1 (E) or a marker of LMTs, SPO (F). Single LMTs in samples co-stained for Syb2 are shown in inserts. (G) Images of the CA1, CA3 and DG in sections that were stained for VGlut1 and Syb2. SO = stratum oriens; SR = stratum radiatum; SL = stratum lucidum; PL = pyramidal cell layer; GCL = granule cell layer; ML = molecular layer. (H) Colocalization of VGlut1 and Syb2 in indicated areas. See also Figure S4. (I) Densities of VGlut1-positive boutons in different sites of the hippocampus. Values from 3 pairs of mice are plotted as mean ± S.E.M. *P < 0.05 (Student’s t-test).
Figure 3
Figure 3. Dendrites and postsynaptic spines of excitatory neurons
(A to G) Pyramidal neurons in the CA1 and dentate GCs were sparsely labeled with AAVDJ DIO-mGFP. Neuronal morphologies were analyzed at p30. Data are annotated as shown in panel B. (A and B) Schematics of experimental design with sites of AAV expression. (C) Dendritic trees reconstructed from 3D image stacks. Branches of different order are color-coded. (D) Averaged length of branches of different order (μm * 100). (E) Mean numbers of branch orders (NBO), trees, nodes, ends, tree length (TL, μm * 100), and complexity indexes (Com, a.u. *1000). CA1: Control, n = 3 mice/24 neurons; TeNT, n = 3/20. DG: Control, n = 3/13; TeNT, n = 3/26. See also Figure S5. (F) Images of spines on proximal dendrites of pyramidal cells in the CA1. (G) Linear densities of different spine types on dendrites of CA1 pyramidal and dentate GC neurons. M = mushroom; T = thin; S = stubby; F = filopodia; M/T = ratio of mushroom to total. Dorsal CA1 (D): Control, n = 3 mice/15 neurons; TeNT, n = 3/20. Ventral CA1 (V): Control, n = 3/15; TeNT, n = 3/15. DG: Control, n = 3/21; NFB, n = 3/20. (H and I) Spines on proximal dendrites of pyramidal cells in the CA3 were analyzed at p30 by SBEM. (H) Dendritic shafts and spines in stratum lucidum of the CA3. (I) Quantifications of shaft volumes (* 1011 nm3) and surface areas (* 1010 nm2), spine volumes (* 1010 nm3) and surface areas (* 108 nm2), spine numbers, and ratios of spines to dendrite surface, dendrite surface to spine, and dendrite volume to spine (all a.u.). n = 3 mice/9–10 reconstructions per genotype. Graphs are plotted as mean ± S.E.M. *P < 0.05; **P < 0.01; ***P < 0.001 (Student’s t-test).
Figure 4
Figure 4. Architectures of glutamatergic synapses
Structures of single excitatory synapses in the CA1, DG, and somatosensory cortex of p30 mice were analyzed by SEM. (A) Simplified diagrams of connectivity in examined areas. P = pyramidal neuron; GC = granule cell; C/I = callosal or ascending layer IV afferents; ENT = entorhinal axons; SC = Schaffer collaterals. (B) 2D EM images of synapses (left) and neurotransmitter vesicles (right) in the CA1. (C) Vesicle volumes and spherisity. Histograms were fitted with Gaussian and asymmetric sigmoidal functions, respectively. n = 270 vesicles/genotype. xc = center of the distribution; w = width of the distribution. w values are shown for left-skewed slope. (D) 3D views of terminals with opposed spines. Structures are color-coded, as indicated on the right. SV = synaptic vesicle; RRP readily-releasable pool of SVs adjacent to presynaptic active zones (AZ); PSD = postsynaptic density. (C) Quantifications of terminal/spine volumes and tethered pools of SVs, displayed as absolute numbers or normalized to AZ length. Data from 3 mice, 9–12 3D-reconstructions per area/genotype are represented as mean ± S.E.M. *P < 0.05; **P < 0.01; ***P < 0.001 (Student’s t-test). See also Figure S6 and Table S2.

References

    1. Aimone JB, Li Y, Lee SW, Clemenson GD, Deng W, Gage FH. Regulation and function of adult neurogenesis: from genes to cognition. Physiological reviews. 2014;94:991–1026. - PMC - PubMed
    1. Alvarez VA, Sabatini BL. Anatomical and physiological plasticity of dendritic spines. Annual review of neuroscience. 2007;30:79–97. - PubMed
    1. Anggono V, Huganir RL. Regulation of AMPA receptor trafficking and synaptic plasticity. Current opinion in neurobiology. 2012;22:461–469. - PMC - PubMed
    1. Bopp R, Holler-Rickauer S, Martin KA, Schuhknecht GF. An ultrastructural study of the thalamic input to layer 4 of primary motor and primary somatosensory cortex in the mouse. The Journal of neuroscience : the official journal of the Society for Neuroscience 2017 - PMC - PubMed
    1. Bourne JN, Harris KM. Coordination of size and number of excitatory and inhibitory synapses results in a balanced structural plasticity along mature hippocampal CA1 dendrites during LTP. Hippocampus. 2011;21:354–373. - PMC - PubMed