. 2017 Apr 19;94(2):401-414.e6.
doi: 10.1016/j.neuron.2017.03.044.

Metaplasticity as a Neural Substrate for Adaptive Learning and Choice under Uncertainty

Affiliations

Metaplasticity as a Neural Substrate for Adaptive Learning and Choice under Uncertainty

Shiva Farashahi et al. Neuron. .

Abstract

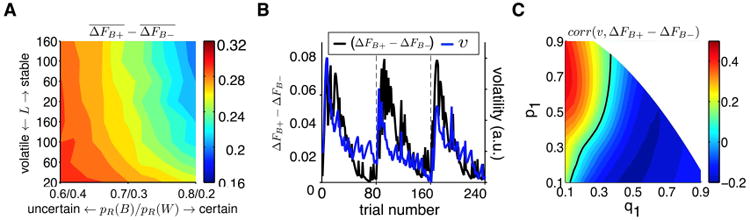
Value-based decision making often involves integration of reward outcomes over time, but this becomes considerably more challenging if reward assignments on alternative options are probabilistic and non-stationary. Despite the existence of various models for optimally integrating reward under uncertainty, the underlying neural mechanisms are still unknown. Here we propose that reward-dependent metaplasticity (RDMP) can provide a plausible mechanism for both integration of reward under uncertainty and estimation of uncertainty itself. We show that a model based on RDMP can robustly perform the probabilistic reversal learning task via dynamic adjustment of learning based on reward feedback, while changes in its activity signal unexpected uncertainty. The model predicts time-dependent and choice-specific learning rates that strongly depend on reward history. Key predictions from this model were confirmed with behavioral data from non-human primates. Overall, our results suggest that metaplasticity can provide a neural substrate for adaptive learning and choice under uncertainty.

Keywords: decision making; learning rate; metaplasticity; reward; sub-optimality; uncertainty; volatility.


Figures

Figure 1
Figure 1
Probabilistic reversal learning task and reward uncertainty. (A) Timeline of the PRL task and an example reward schedule. Subjects select between two options (e.g. red and green targets) and receive reward feedback on every trial. The reward is assigned probabilistically to one of the two targets while the better target changes between blocks of trials. In the shown example, probability of reward on the green target (pR(g)) changes between 0.8 and 0.2 after every 20 trials. Each cross shows reward assignment on a given trial. (B) Performance of the RL(1) model as a function of the learning rate in three environments with different levels of uncertainty or volatility. The diamond sign shows the optimal learning rate for each environment. (C) The optimal learning rate for the RL(1) model in different environments quantified with reward probability on the better and worse options and the block length, L. The optimal learning rate was smaller for more stable, and to a lesser extent, for more uncertain environments. White squares indicate sample environments chosen for further tests.
Figure 2
Figure 2
The RDMP model and its response to three environments with different levels of uncertainty or volatility. (A) The schematic of metaplastic synapses. Metaplastic synapses have multiple meta-states associated with each of the two levels of synaptic efficacy: weak (W) and strong (S). Potentiation and depression events result in stochastic transitions between meta-states with different levels of stability and are indicated by arrows (in gold and cyan for potentiation and depression events, respectively) and quantified by different transition probabilities (q1 > q2 > q3 > q4 and p1 > p2 > p3). We also refer to more unstable and stable meta-states as ‘shallower’ and ‘deeper’ meta-states, respectively. (B) For synapses associated with the green target, the average (over many blocks) fractions of synapses in different strong (top) and weak (bottom) meta-states are plotted over time in the stable environment (0.8/0.2 schedule with L = 80). The x-axis color indicates the better option within a given block and the inset shows the steady state of the fraction of synapses in each of four meta-states (computed by averaging over the last 2 trials within each block). (C-D) The same as B but show the results for the volatile (0.8/0.2 schedule with L = 20) and uncertain environments (0.6/0.4 schedule with L = 80).
Figure 3
Figure 3
The RDMP model adjusts learning over time according to reward uncertainty and volatility. (A) The time course of the effective learning rate for when the reward was assigned to the better (KB+) or worse (KB-) option during a given block in the stable (0.8/0.2 schedule with L = 80) and uncertain (0.6/0.4 schedule with L = 80) environments. The inset shows the results for the volatile environment (0.8/0.2 reward schedule with L = 20). (B-D) The difference between the effective learning rates at three time points after a reversal in different environments. Overall, KB+ increased while KB- decreased and their difference was larger for more certain and/or stable environments. (E) Changes in model's response to reward feedback over time. Plotted are the changes in the synaptic strength in response to reward assignment on the better (ΔFB+) or worse option (ΔFB-), as well as the overall change in the synaptic strength (ΔF) as a function of the trial number after a reversal in the stable and uncertain environments. (F-H) The overall change in the synaptic strength at three time points after a reversal in different environments. The model's response to reward feedback was stronger for more certain and/or volatile environments right after reversals and this difference slowly decreased over time.
Figure 4
Figure 4
Model comparison. (A) Comparison of the goodness-of-fit for monkeys' choice behavior during the modified PRL task using eight different models (BayesH: hierarchical Bayesian; BayesCD: change-detection Bayesian; RL-c and RL-t refer to RL models with constant and time-dependent learning rates). Plotted is the average negative log likelihood (-LL) over all cross-validation instances (using test trials) separately for data in the stable and volatile environments. Overall, the RDMP and sRDMP models provide the best fit in both environments whereas the Bayesian models provide the worst fit. (B) Goodness-of-fits for congruent and incongruent trials. For clarity only the results for the best RL model is shown. (C-D) Goodness-of-fits across time for different models during the volatile (C) and stable (D) environments. Plotted is the goodness-of-fit across time measured as the average -LL per trial, on a given trial within a block (based on cross-validation test trials). The blue (black) bars in the inset show the difference between the average -LL of sRDMP and RL(2)-t (respectively, hierarchical Bayesian) in early (trial 2-10) and late (trial 11-20, or 11-80) trials after a reversal. Overall, the sRDMP and RDMP (not shown to avoid clutter) models provide the best fit especially right after reversals.
Figure 5
Figure 5
Experimental evidence for metaplasticity revealed by time-dependent, choice-specific learning rates. (A) Plotted are the average estimated learning rates over time on trials when the reward was assigned to the better and worse options. These estimates are obtained using the session-by-session fit of monkeys' choice behavior with the sRDMP model in the stable environment. The error bars indicate s.e.m. The insets show the distributions of the difference between the steady state and initial values of the learning rates across all sessions (separately for each learning rate), and stars show whether the median (black dashed line) of each distribution is significantly different from zero (p < .05). (B) The distribution of five transition probabilities estimated from fitting the choice behavior using the RDMP model with three meta-states (m = 3). Dashed lines show the median. The bimodal distribution for p1 values is an indicative of degeneracy in the solution for the RDMP model. (C) The effective learning rates in the RDMP model based on the median of estimated transition probabilities shown in B. (D-F) The same as A-C but for behavior in the volatile environment. Estimated transition probabilities and the effective learning rates showed similar patterns in the two environments.
Figure 6
Figure 6
The RDMP model robustly performs the PRL task. (A) Performance of five different models in ten selected environments which require different optimal learning rates (BayesH: hierarchical Bayesian; BayesCD: change-detection Bayesian). The performance of the RDMP model is computed using one set of parameters in all environments, whereas the performance for the RL(2) and RL(1) models are based on the optimal learning rates chosen separately for each environment. The performance of the omniscient observer that knows the better option and chooses that option all the time is equal to the actual probability of reward assignment on the better option. (B) Performance (normalized by the performance of the omniscient observer) of RL(1) in a universe with many different levels of uncertainty/volatility, as a function of the learning rate. The normalized performance of 0.7 corresponds to chance performance. The inset shows the optimal performance (±std) of the RL(1), RL(2), and RDMP models with different number of meta-states (3, 4, and 5), computed by averaging top 2% performance in order to reduce noise. The rectangle indicates the top 2% performance. (C) The performance of RL(2) in a universe with many different levels of uncertainty/volatility, as a function of the learning rates for rewarded and unrewarded trials. The black curves enclose the top 2% performance. (D-F) The performance of RDMP in a universe with many different levels of uncertainty/volatility, as a function of the maximum transition probabilities, and for different numbers of meta-states. The white region indicates parameter values that could result in implausible transitions in the model (see STAR Methods).
Figure 7
Figure 7
Neural correlates of estimated volatility in the RDMP model. (A) Plotted is the average value of the difference in the changes in synaptic strengths in the RDMP model, for different environments. (B) The time course of the difference in the change in synaptic strengths in the RDMP model (blue), and of estimated volatility from the hierarchical Bayesian model (black) during three blocks of trials in the stable environment. For these simulations we used q1 = 0.2 and p1 = 0.6. (C) The correlation coefficient between trial-by-trial estimate of (ΔFB+(t) − ΔFB(t)) and estimated volatility by the hierarchical Bayesian model over a wide range of model's parameters (the maximum transition probabilities), during ten environments with different levels of volatility (block length). The black curve indicates parameter values for which the correlation is equal to 0.1.

References

    1. Abraham WC. Metaplasticity: tuning synapses and networks for plasticity. Nat Rev Neurosci. 2008;9:387–399. - PubMed
    1. Abraham WC, Bear MF. Metaplasticity: the plasticity of synaptic plasticity. Trends Neurosci. 1996;19:126–130. - PubMed
    1. Aston-Jones G, Cohen JD. An integrative theory of locus coeruleusnorepinephrine function: adaptive gain and optimal performance. Annu Rev Neurosci. 2005;28:403–450. - PubMed
    1. Behrens TEJ, Woolrich MW, Walton ME, Rushworth MFS. Learning the value of information in an uncertain world. Nat Neurosci. 2007;10:1214–1221. - PubMed
    1. Bernacchia A, Seo H, Lee D, Wang XJ. A reservoir of time constants for memory traces in cortical neurons. Nat Neurosci. 2011;14:366–372. - PMC - PubMed