. 2017 May 9;8(19):30933-30955.
doi: 10.18632/oncotarget.15944.

Oxidative DNA double strand breaks and autophagy in the antitumor effect of sterically hindered platinum(II) complexes in NSCLCs

Affiliations

Oxidative DNA double strand breaks and autophagy in the antitumor effect of sterically hindered platinum(II) complexes in NSCLCs

Feihong Chen et al. Oncotarget. .

Abstract

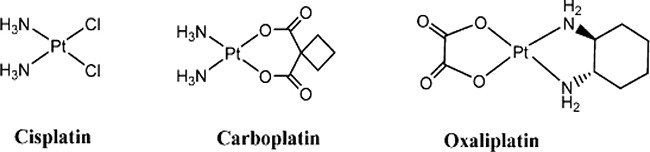
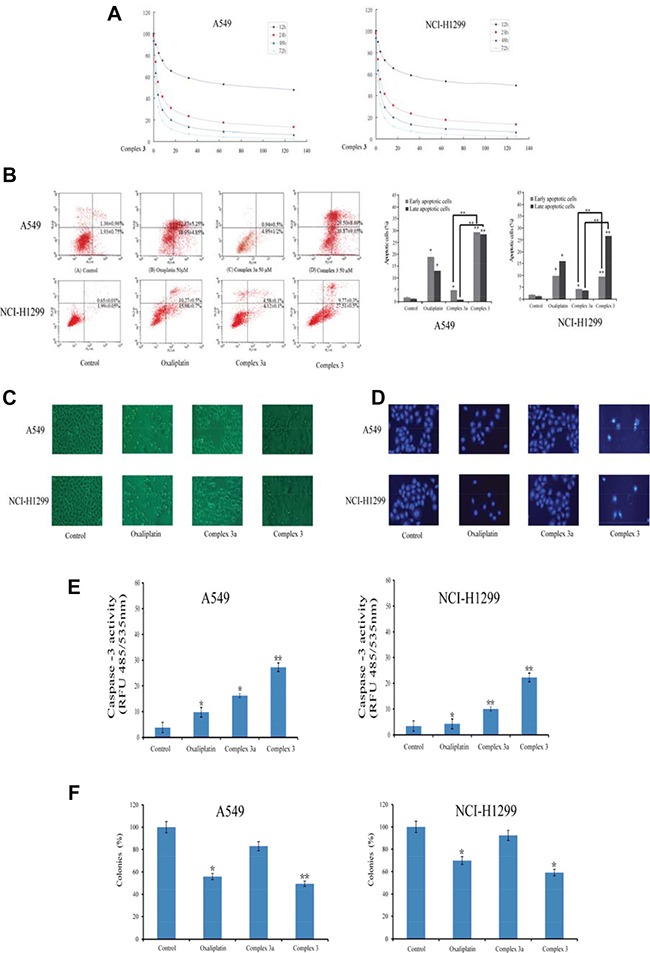
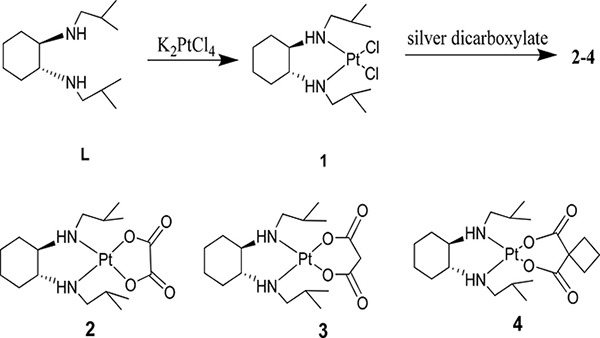
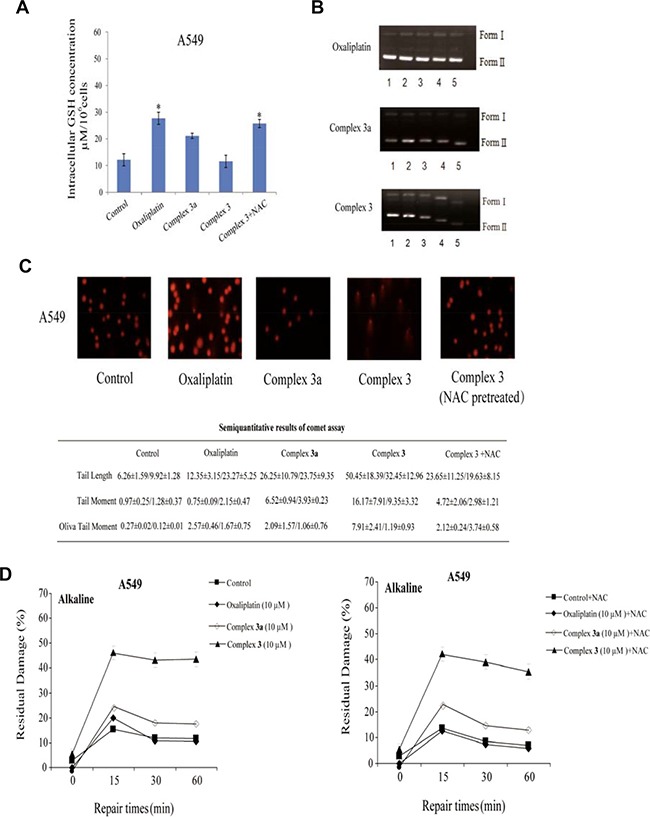
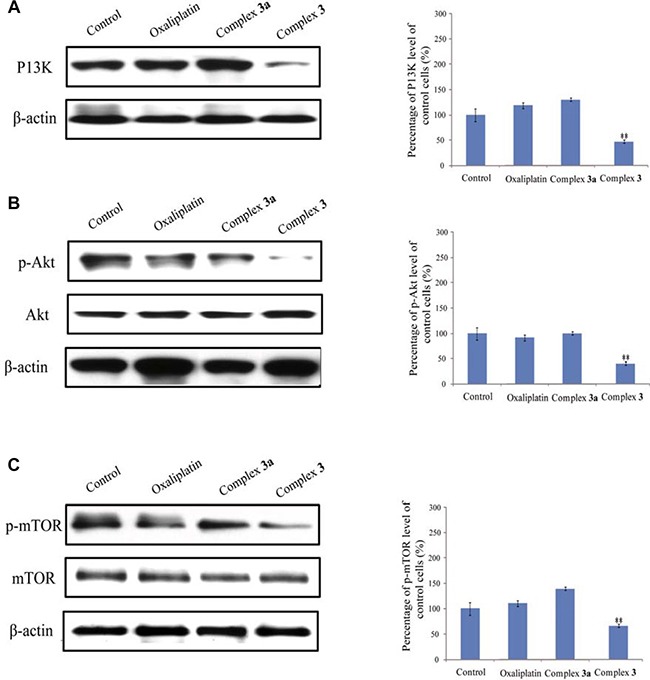
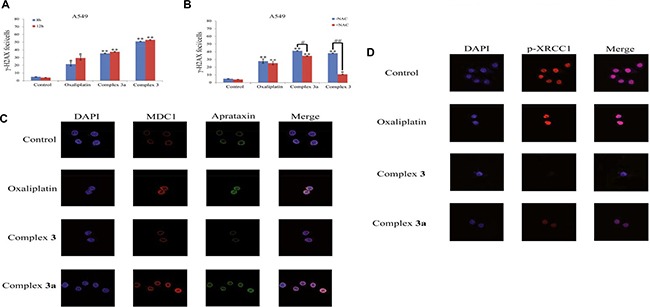
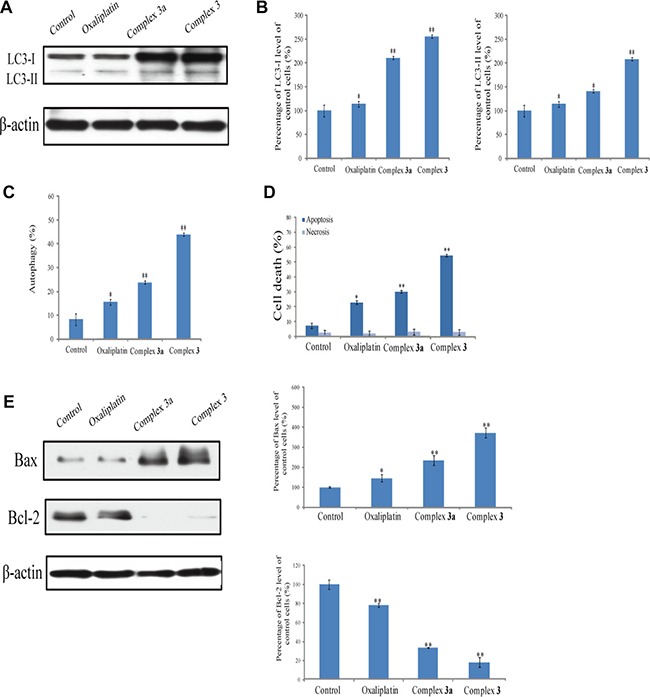
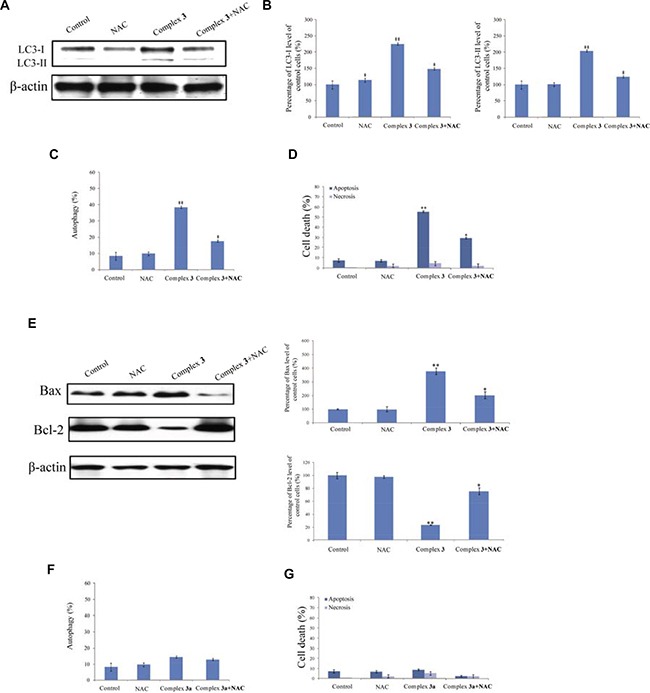
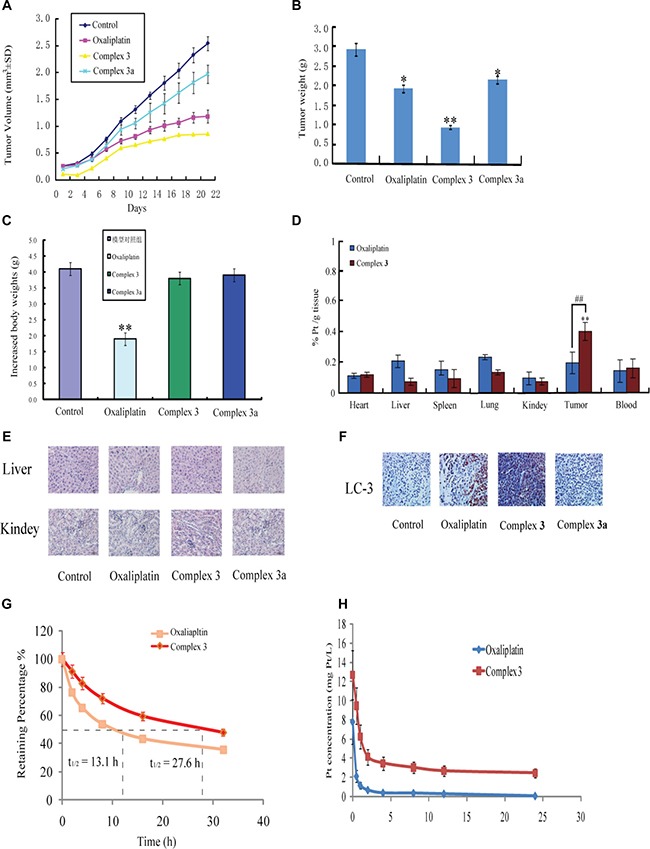
A series of novel platinum(II) complexes with (1R,2R)-N1,N2-diisobutyl-1,2-diaminocyclohexane as a carrier ligand, while N1,N2-diisobutyl moiety serving as steric hindrance were designed, synthesized and characterized. The in vitro biological assays demonstrated that complex 3 had increased cytotoxicity against lung cancer cells, especially non-small-cell lung cancer (NSCLC) compared to its mono-substituted complex 3a, indicating that the sterically hindered alkyl moieties have significant influences on its antitumor property. However, the mechanism still remains unclear. The further studies revealed that complex 3 could induce ROS overproduction, severe DNA double strands breaks and inhibit the activation of DNA damage repair proteins within nucleus, leading to cell-cycle arrest and cell death. Moreover, complex 3 could induce autophagy via the accumulation of autophagic vacuoles and alterations of autophagic protein expression. Interestingly, the ROS scavengers, N-acetyl-cysteine (NAC) could reverse complex 3-induced DNA double strands breaks and autophagic responses more significantly compared to complex 3a. The results demonstrated that the ROS generation plays an important role in the DNA double strands breaks and autophagic responses in the antitumor effect of complex 3 with N1,N2-diisobutyl moiety. Our study offered a novel therapeutic strategy and put new insights into the anticancer research of the complexes with N1,N2-diisobutyl moiety served as steric hindrance.

Keywords: MDC1/aprataxin; N1, N2-diisobutyl moiety; ROS; double strand breaks; platinum(II) complexes.


Conflict of interest statement

CONFLICTS OF INTEREST

The authors declare that they have no competing interests.

Figures

Figure 1
Figure 1. Reactions of complex 3 with DNA by reduction
(A) The different Pt/nucleotide ratios and time of DNA platination. All the reactions were conducted with 0.01 mg/mL DNA in 10 mM NaClO4 in 10 mM phosphate buffer (pH = 7.4) at 37°C for 24 h and then add 0.04 mg/mL EtBr before the fluorescence measurements with the excitation wavelength of 546 nm and the emission wavelength of 590 nm. (B) The cellular uptake of oxaliplatin, complex 3, complex in A549, NCI-H1299 and L02 cells. (C) The accumulation of the measured compounds in mitochondria, lysosomes and nucleus of A549 and NCI-H1299 cells. The levels of Pt in cancer cells were detected by ICP-MS after 4 h incubation with the treatments of evaluated complexes at 10 μM. Results are representative of at least three independent experiments and shown as the mean ± S.D. *P < 0.05, **P < 0.01 compared with oxaliplatin-treated groups.
Scheme 1
Scheme 1. Structures of cisplatin, carboplatin, oxaliplatin
Figure 2
Figure 2. Cellular responses of oxaliplatin, complex 3 and complex 3a in A549 and NCI-H1299 cancer cells
All the complexes were used at the fixed concentration of 10 μM for 24 h. (A) The growth inhibition effect of complex 3 on A549 and NCI-H1299 cancer cells on 12, 24, 48 and 72 h. (B) Apoptosis inducing property of the measured complexes by Annexin V-FITC/PI staining of cancer cells. The Y-axis shows the PI-labeled population and the X-axis shows FITC-labeled Annexin V-positive cells. (C) Morphological changes in A549 and NCI-H1299 cancer cells were observed under an inverted light microscope (original magnification 100 ×). (D) Apoptotic cells were observed by DAPI staining. (E) Analysis of caspase-3 activation in cancer cells following the treatment of measure compounds. (F) Long-term colony formation assays of A549 and NCI-H1299 cancer cells. Cells were grown in the presence of the measured complexes for 7 days. For each cell line, all dishes were fixed at the same time, stained and analyzed. Results are representative of at least three independent experiments and shown as the mean ± S.D. *P < 0.05, **P < 0.01 compared with control group.
Scheme 2
Scheme 2. Synthetic pathway to target complexes 2-4
Figure 3
Figure 3. Complex 3 induces cell death and cell cycle changes in A549 and NCI-H1299 cancer cells
(A) Cell cycle analysis upon exposure to complex 3. A549 and NCI-H1299 cancer cells exposed to the measured complexes for 72 h were stained with propidium iodide and subjected to flow cytometry analysis. The mitochondrial membrane potential (b, c) and the intracellular ATP (d) decreased in complex 3-treated A549 and NCI-H1299 cancer cells. (B) Cells were exposed to oxaliplatin, complex 3 and complex 3a (10 μM) for 24 h, stained with JC-1 and visualized under an inverted fluorescence microscope. Red fluorescence of JC-1 dimers was present in the cell areas with high MMP, while green fluorescence of JC-monomers was prevalent in the cell areas with low MMP. (C) Normalized JC-1 fluorescence change analyzed by flow cytometry. The median fluorescence intensity of each treatment group was normalized to the control group. (D) Cells were treated with oxaliplatin, complex 3 and complex 3a (10 μM), for 12 h and then the intracellular ATP was detected. (E) Intracellular ROS were measured by flow cytometry after 10 μM DCFH-DA staining. Geometric mean off luorescence intensity values were calculated and compared to that in DMSO controls. (F) Cells were exposed to 10 μM oxaliplatin, complex 3 and complex 3a, then H2O2 level was measured. Values are means ± SD for at least three independent experiments performed in triplicate (*P < 0.05 and **P < 0.01 compared with vehicle control).
Figure 4
Figure 4. Intracellular GSH concentrations and DNA damage of the measured complexes induced SSBs and DSBs
(A) A549 cells were pretreated with NAC for 30 min and then incubated with oxaliplatin, complex 3 and complex 3a (10 μM) for 4 h. (B) Gel electrophoretic mobility pattern of pET28a plasmid DNA incubated with various concentrations of platinum(II) complexes. Lanes 1–5 (0, 20, 80, 320, 640 μM) + DNA. A) oxaliplatin; B) complex 3a; C) complex 3. (C) Comet assay revealing increased chromosomal DNA strand breaks including SBBs, DSBs and active excision repair of DNA cross-links triggered by the measured complexes in A549 cancer cells with or without NAC pretreatment. (D) The number of SBBs was determined by a neutral comet assay with or without NAC pretreatment. Graph represents average number of foci per cells ± SD. Results are representative of at least three independent experiments and shown as the mean ± S.D. *P < 0.05, **P < 0.01 compared with control group.
Figure 7
Figure 7. Complex 3 inhibits the PI3K/Akt/mTOR signaling pathway
Human A549 cells were exposed to 10 μM complex 3 for 24 h. (A) Levels of PI3K was immunodetected. β-Actin was detected as an internal control. These protein bands were quantified and statistically analyzed. (B and C), Levels of p-Akt and p-mTOR were immunodetected. Akt, mTOR, and β-actin were detected as the internal controls. These immunorelated protein bands were quantified and statistically analyzed. Each value represents the mean ± SEM from three independent experiments. The symbols * indicate that values significantly (*P < 0.05, **P < 0.01) differed from the respective control group.
Figure 5
Figure 5. The inhibitory effect of the measured samples on DNA repair response
(A) γH2AX foci after treatments were counted in 50–60 individual cells of 8 h and 12 h in A549 cells. (B) γH2AX foci after pretreatment with NAC were counted in 50–60 individual cells of 12 h in A549 cells. (C) Complex 3 could inhibit the recruitment of DSB repair proteins MDC1 and Aprataxin to damaged chromatin. (D) The inhibitory effect of the measured samples on DNA single strands repair response. A549 cancer cells were treated with the measured complexes at 10 μM for 24 h. After that, cells were pre-extracted with detergent, fixed and immunostained with antibodies against MDC1/Aprataxin and p-XRCC1. Results are representative of at least three independent experiments and shown as the mean ± S.D. *P < 0.05, **P < 0.01 compared with control group.
Figure 6
Figure 6. Complex 3 induces autophagic cell death
Human A549 cells were treated with measured complexes of 10 μM for 24 h. (A) Levels of LC3 were immunodetected. β-actin was detected as the internal control. (B) These protein bands were quantified and statistically analyzed. (C) The percentage of autophagy was quantified using flowcytometry. (D) Cell apoptosis was quantified using flow cytometry. (E) Bax and Bcl-2 levels in the whole-cell lysates. Each value represents the mean ± SEM from three independent experiments. The symbols * indicate that values significantly (*P < 0.05, **P < 0.01) differed from the respective control group.
Figure 8
Figure 8. Reactive oxygen species (ROS) are involved in complex 3-induced autophagic death
(A) A549 cells were pretreated with 5 mM NAC for 2 h and then with 10 μM complex for another 18 h. Levels of LC1 and LC3 were immunodetected. β-Actin was immunodetected as the internal control. (B) These protein bands were quantified and statistically analyzed. The percentage of autophagy (C) and cell viability (D) were analyzed using flow cytometry. (E) Levels of Bax and Bcl-2 were immunodetected. β-Actin was used as the internal control. The protein bands were quantified and analyzed. (F) The percentage of autophagy was quantified using flow cytometry following the pretreatment with NAC in complex 3a-treated A549 cells. (G) Cell apoptosis was quantified using flow cytometry with NAC pretreatment in complex 3a-treated A549 cells. Each value represents the mean ± SEM from three independent experiments. The symbols * indicate that values significantly (*P < 0.05, **P < 0.01) differed from the respective control group.
Figure 9
Figure 9. In vivo antitumor activity of oxaliplatin, complex 3 and complex 3a in A549 xenograft tumors
Mean tumor volumes, changes in tumor and body weights are presented. Oxaliplatin (dosed intravenously at 5 mg/kg twice a week), complex 3 (dosed intravenously at 5 mg/kg once every three days), complex 3a (dosed intravenously at 5 mg/kg once every three days). (A) The tumor growth in xenograft mouse models at the administration of the corresponding groups. (B) The tumor weight in each group at the end of the experiment. (C) Measured weight increase of mice during the treatments. (D) Tissues and tumor distribution of cisplatin and complex 3 in mice bearing A549 tumors after i.v. administration of the corresponding groups. Major organs were collected at 1 h after injection. (E). The HE staining of normal tissues of Liver and Kindey. (F) immunoblotting analysis of LC3. (G) Stability of oxaliplatin and complex 3 in rat plasma. (H) In vivo pharmacokinetic curves of Pt concentration in the rat plasma versus time after intracenous injection of cisplatin and complex 3 in rats. Results are representative of at least three independent experiments and shown as the mean ± S.D. *P < 0.05, **P < 0.01 compared with control group.

Similar articles

Cited by

References

    1. Rosenberg B, VanCamp L, Trosko JE, Mansour VH. Platinum compounds: a new class of potent anti-tumor agents. Nature. 1969;222:385–386. - PubMed
    1. Kelland L. The resurgence of platinum-based cancer chemotherapy. Nat Rev Cancer. 2007;7:573–584. - PubMed
    1. Wang XY, Wang XH, Guo ZJ. Functionalization of platinum complexes for biomedical applications. Acc Chem Res. 2015;48:2622–2631. - PubMed
    1. Liu FF, Gou SH, Chen FH, Fang L, Zhao J. Study on antitumor platinum(II) complexes of chiral diamines with dicyclic species as steric hindrance. J Med Chem. 2015;58:6368–6377. - PubMed
    1. Graf N, Lippard SJ. Redox activation of metalbased pro-drugs as a strategy for drug delivery. Adv Drug Delivery Rev. 2012;64:993–1004. - PMC - PubMed

MeSH terms