

Household level spatio-temporal analysis of Plasmodium falciparum and Plasmodium vivax malaria in Ethiopia
- PMID: 28427451
- PMCID: PMC5397782
- DOI: 10.1186/s13071-017-2124-6
Household level spatio-temporal analysis of Plasmodium falciparum and Plasmodium vivax malaria in Ethiopia
Abstract
Background: The global decline of malaria burden and goals for elimination has led to an increased interest in the fine-scale epidemiology of malaria. Micro-geographic heterogeneity of malaria infection could have implications for designing targeted small-area interventions.
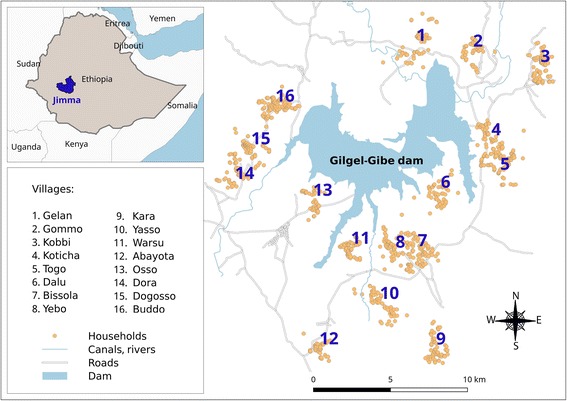
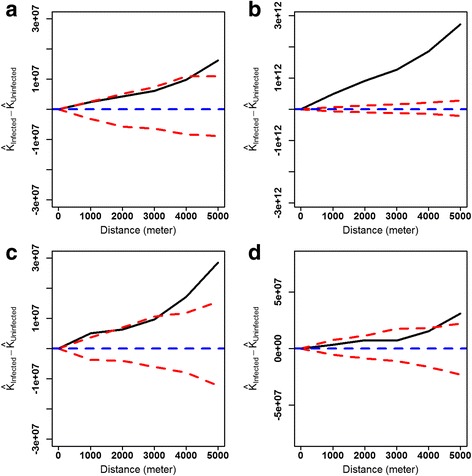
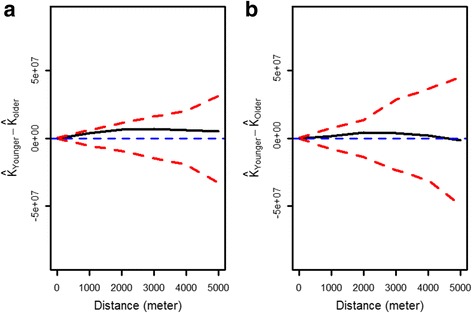
Methods: Two-year longitudinal cohort study data were used to explore the spatial and spatio-temporal distribution of malaria episodes in 2040 children aged < 10 years in 16 villages near the Gilgel-Gibe hydropower dam in Southwest Ethiopia. All selected households (HHs) were geo-referenced, and children were followed up through weekly house-to-house visits for two consecutive years to identify febrile episodes of P. falciparum and P. vivax infections. After confirming the spatial dependence of malaria episodes with Ripley's K function, SatScanTM was used to identify purely spatial and space-time clusters (hotspots) of annual malaria incidence for 2 years follow-up: year 1 (July 2008-June 2009) and year 2 (July 2009-June 2010).
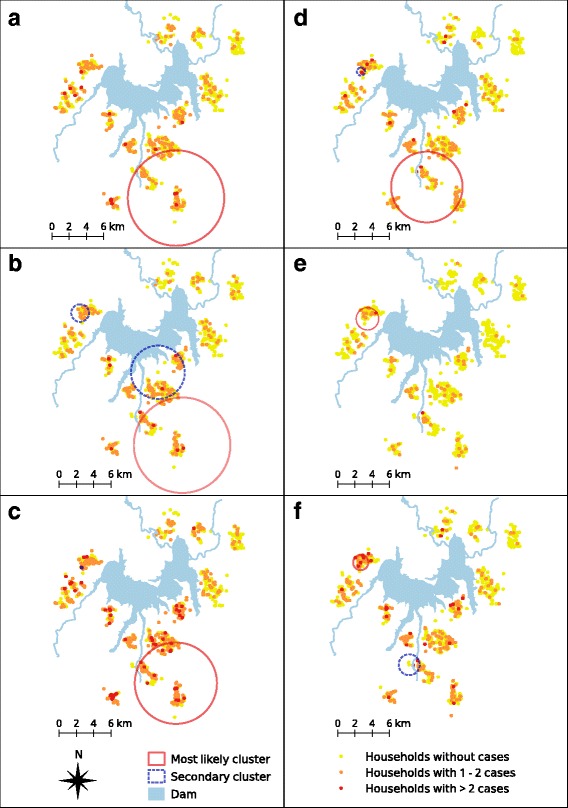
Results: In total, 685 P. falciparum episodes (in 492 HHs) and 385 P. vivax episodes (in 290 HHs) were identified, representing respectively incidence rates of 14.6 (95% CI: 13.4-15.6) and 8.2 (95% CI: 7.3-9.1) per 1000 child-months at risk. In year 1, the most likely (128 HHs with 63 episodes, RR = 2.1) and secondary (15 HHs with 12 episodes, RR = 5.31) clusters of P. vivax incidence were found respectively in southern and north-western villages; while in year 2, the most likely cluster was located only in north-western villages (85 HHs with 16 episodes, RR = 4.4). Instead, most likely spatial clusters of P. falciparum incidence were consistently located in villages south of the dam in both years: year 1 (167 HHs with 81 episodes, RR = 1.8) and year 2 (133 HHs with 67 episodes, RR = 2.2). Space-time clusters in southern villages for P. vivax were found in August-November 2008 in year 1 and between November 2009 and February 2010 in year 2; while for P. falciparum, they were found in September-November 2008 in year 1 and October-November 2009 in year 2.
Conclusion: Hotspots of P. falciparum incidence in children were more stable at the geographical level and over time compared to those of P. vivax incidence during the study period.
Keywords: Active case detection; Ethiopia; Plasmodium falciparum; Plasmodium vivax; SatScan; Spatio-temporal analysis.
Figures
References
-
- World Health Organization . World malaria report 2015. Geneva: WHO; 2015.
-
- Federal Democratic Republic of Ethiopia Ministry of Health . HSDP IV annual performance report 2014/2015. Addis Ababa: Ministry of Health; 2015.
MeSH terms
LinkOut - more resources
Full Text Sources
Other Literature Sources
