. 2017 Aug 15;23(16):4724-4734.
doi: 10.1158/1078-0432.CCR-16-1871. Epub 2017 Apr 20.

In Vivo Detection of EGFRvIII in Glioblastoma via Perfusion Magnetic Resonance Imaging Signature Consistent with Deep Peritumoral Infiltration: The φ-Index

Affiliations

In Vivo Detection of EGFRvIII in Glioblastoma via Perfusion Magnetic Resonance Imaging Signature Consistent with Deep Peritumoral Infiltration: The φ-Index

Spyridon Bakas et al. Clin Cancer Res. .

Abstract

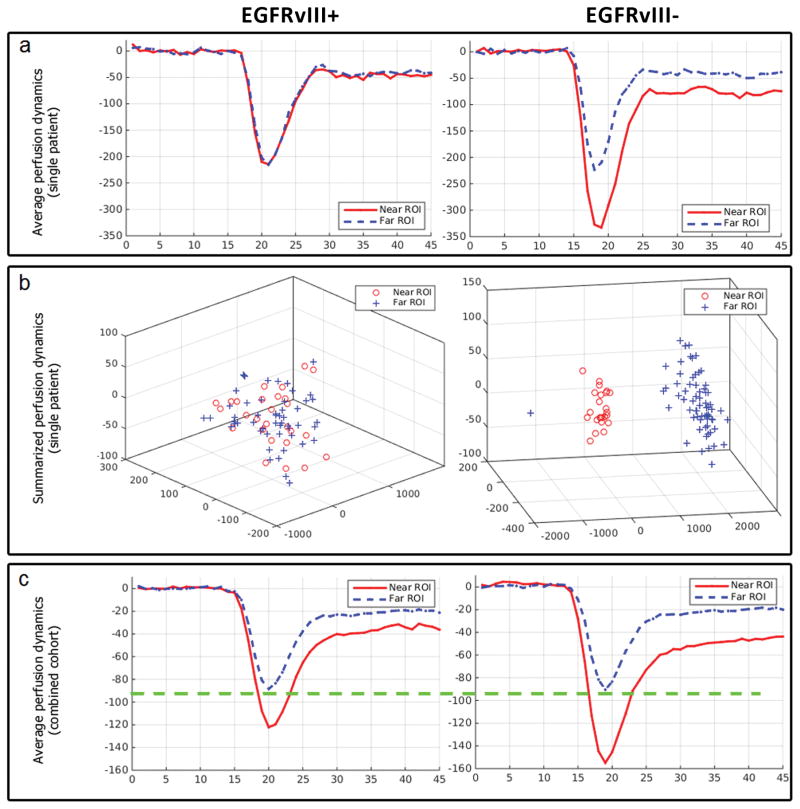
Purpose: The epidermal growth factor receptor variant III (EGFRvIII) mutation has been considered a driver mutation and therapeutic target in glioblastoma, the most common and aggressive brain cancer. Currently, detecting EGFRvIII requires postoperative tissue analyses, which are ex vivo and unable to capture the tumor's spatial heterogeneity. Considering the increasing evidence of in vivo imaging signatures capturing molecular characteristics of cancer, this study aims to detect EGFRvIII in primary glioblastoma noninvasively, using routine clinically acquired imaging.Experimental Design: We found peritumoral infiltration and vascularization patterns being related to EGFRvIII status. We therefore constructed a quantitative within-patient peritumoral heterogeneity index (PHI/φ-index), by contrasting perfusion patterns of immediate and distant peritumoral edema. Application of φ-index in preoperative perfusion scans of independent discovery (n = 64) and validation (n = 78) cohorts, revealed the generalizability of this EGFRvIII imaging signature.Results: Analysis in both cohorts demonstrated that the obtained signature is highly accurate (89.92%), specific (92.35%), and sensitive (83.77%), with significantly distinctive ability (P = 4.0033 × 10⁻¹⁰, AUC = 0.8869). Findings indicated a highly infiltrative-migratory phenotype for EGFRvIII+ tumors, which displayed similar perfusion patterns throughout peritumoral edema. Contrarily, EGFRvIII- tumors displayed perfusion dynamics consistent with peritumorally confined vascularization, suggesting potential benefit from extensive peritumoral resection/radiation.Conclusions: This EGFRvIII signature is potentially suitable for clinical translation, since obtained from analysis of clinically acquired images. Use of within-patient heterogeneity measures, rather than population-based associations, renders φ-index potentially resistant to inter-scanner variations. Overall, our findings enable noninvasive evaluation of EGFRvIII for patient selection for targeted therapy, stratification into clinical trials, personalized treatment planning, and potentially treatment-response evaluation. Clin Cancer Res; 23(16); 4724-34. ©2017 AACR.


Conflict of interest statement

Conflict of interest disclosure statement: The application and results of a preliminary version of the proposed approach, in a smaller population size, were presented at the 20th Annual Scientific Meeting of the Society for Neuro-Oncology 2015 in San Antonio, Texas. The authors declare that they have no other potential conflicts of interest.

Figures

Figure 1
Figure 1
Example of the immediate and distant peritumoral region of interest (ROI) annotations. Image a illustrates in red an example ROI defined adjacent to the enhancing part of the tumor superimposed on a T1-CE axial image, and image b illustrates in blue an example ROI defined in the periphery of the tumor within edema superimposed on a T2-FLAIR axial image. Note that these ROIs are described by lines annotated in multiple slices for each subject and not just in a single slice, as shown in this visual example.
Figure 2
Figure 2
Temporal perfusion dynamics for the described immediate and distant peritumoral regions of interest (ROIs), by EGFRvIII expression status. a illustrates examples of aligned average perfusion curves for individual patients. b shows the summarization of perfusion curves through principal component analysis in three components. Note that each perfusion curve in a is represented by a single dot in b. These summarized perfusion curves show more separability (higher φ-index) between the immediate and the distant peritumoral ROI measures among EGFRvIII− patients compared to EGFRvIII+ patients. c illustrates aligned average perfusion curves across 142 patients. Note that the drop in the perfusion signal for the distant peritumoral ROI is almost identical between across all patients, and that the average drop in the immediate peritumoral ROI is much deeper among the EGFRvIII− patients compared to EGFRvIII+ patients.
Figure 3
Figure 3
Distributions of the Peritumoral Heterogeneity Index (PHI) by EGFRvIII expression status across the discovery cohort in a, the replication cohort in b, and the combined cohort in c. Statistical significance was evaluated via a two-tailed paired t-test comparing between the two distributions of a. the discovery cohort (p=1.5725×10⁻⁷), b. the replication cohort (p=2.8164×10⁻⁴), and c. the combined cohort (p=4.0033×10⁻¹⁰). The bottom and top of each “box” depict the 1st and 3rd quartile of the PHI measure, respectively. The line within each box indicates the median, and the fact that it is not necessarily at the center of each box indicates the skewness of the distribution over different cases. The “whiskers” drawn external to each box depict the extremal observations still within 1.5 times the interquartile range, below the 1st or above the 3rd quartile. Observations beyond the whiskers are marked as outliers with a “+” sign.
Figure 4
Figure 4
Receiver Operating Characteristics (ROC) Analyses. ROC curves are illustrated in: i) a–i for individual MRI modalities across 140 patients, ii) j and k for combination of modalities across 140 patients, and iii) l for our final proposed approach in 142 patients.
Figure 5
Figure 5
Scatter plot of the Peritumoral Heterogeneity Index (PHI), by EGFRvIII expression status across 140 patients, in the DSC modality (x axis) over the PHI in the DTI-TR measure (y axis) in a, and over the PHI in the T1 modality (y axis) in b.
Figure 6
Figure 6
Scatter plot of the DTI-TR measure, by EGFRvIII expression status across 140 patients, for the region adjacent to the enhancing tumor (x axis) over the region at the periphery of the edema (y axis).

References

    1. Johnson DR, O’Neill BP. Glioblastoma survival in the United States before and during the temozolomide era. Journal of Neuro-Oncology. 2011;107:359–64. - PubMed
    1. Lemee J-M, Clavreul A, Menei P. Intratumoral heterogeneity in glioblastoma: don’t forget the peritumoral brain zone. Neuro-Oncology. 2015;17:1322–32. - PMC - PubMed
    1. Aum DJ, Kim DH, Beaumont TL, Leuthardt EC, Dunn GP, Kim AH. Molecular and cellular heterogeneity: the hallmark of glioblastoma. Neurosurg Focus. 2014;37:E11. - PubMed
    1. Sottoriva A, Spiterib I, Piccirillo SGM, Touloumis A, Collins VP, Marioni JC, et al. Intratumor heterogeneity in human glioblastoma reflects cancer evolutionary dynamics. Proc Natl Acad Sci U S A. 2013;110:4009–14. - PMC - PubMed
    1. Patel AP, Tirosh I, Trombetta JJ, Shalek AK, Gillespie SM, Wakimoto H, et al. Single-cell RNA-seq highlights intratumoral heterogeneity in primary glioblastoma. Science. 2014;344:1396–401. - PMC - PubMed

MeSH terms

Substances