. 2017 May 1;214(5):1529-1546.
doi: 10.1084/jem.20150402. Epub 2017 Apr 20.

TSLP-activated dendritic cells induce human T follicular helper cell differentiation through OX40-ligand

Affiliations

TSLP-activated dendritic cells induce human T follicular helper cell differentiation through OX40-ligand

Lucia Pattarini et al. J Exp Med. .

Abstract

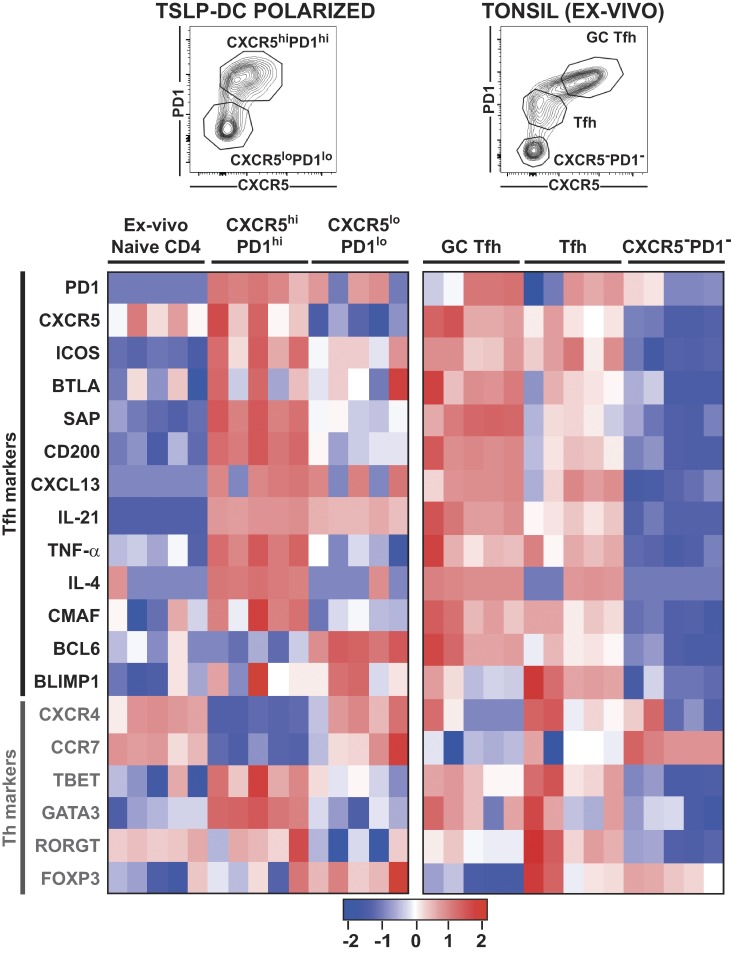
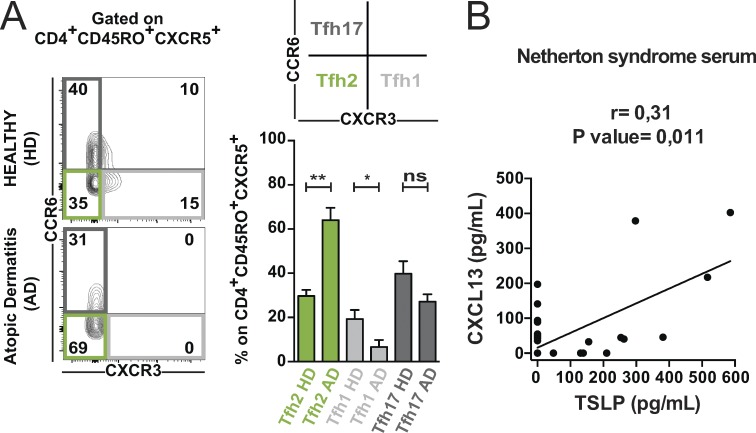
T follicular helper cells (Tfh) are important regulators of humoral responses. Human Tfh polarization pathways have been thus far associated with Th1 and Th17 polarization pathways. How human Tfh cells differentiate in Th2-skewed environments is unknown. We show that thymic stromal lymphopoietin (TSLP)-activated dendritic cells (DCs) promote human Tfh differentiation from naive CD4 T cells. We identified a novel population, distinct from Th2 cells, expressing IL-21 and TNF, suggestive of inflammatory cells. TSLP-induced T cells expressed CXCR5, CXCL13, ICOS, PD1, BCL6, BTLA, and SAP, among other Tfh markers. Functionally, TSLP-DC-polarized T cells induced IgE secretion by memory B cells, and this depended on IL-4Rα. TSLP-activated DCs stimulated circulating memory Tfh cells to produce IL-21 and CXCL13. Mechanistically, TSLP-induced Tfh differentiation depended on OX40-ligand, but not on ICOS-ligand. Our results delineate a pathway of human Tfh differentiation in Th2 environments.


Figures

Figure 1.
Figure 1.
TSLP-activated DCs polarize naive CD4 T cells into IL-21–secreting cells. Untreated DCs, treated with TSLP (TSLP-DC) or LPS (LPS-DC) were cultured with naive CD4 T cells for 6 d. (A) CBA (IL-4, IL-13, IFN-γ, and IL-17A) and ELISA (IL-21) assays after 24 h of restimulation with anti CD3/CD28 beads. Th0, naive T cells cultured for 6 d with anti-CD3/CD28; Th17, Th0 plus Th17 polarizing cytokines (IL1β, IL-23, TGF-β, and IL-6). Data are mean ± SEM from nine independent experiments. (B) Intracellular FACS staining for IL-21, IFN-γ, TNF, and IL-4 for one representative donor. Gate is on activated DAPI CD4 T cells. (C) Quantification of data as in B. Data are mean ± SEM from six independent experiments. (D) Distribution of IL-21+ cells (red square) polarized by TSLP-DC coproducing IL-4, TNF, and IFN-γ. Filled histogram, isotype control; black line, IL-21 staining. Mean of six independent experiments. Single IL-21 producers (16%) are not plotted. *, P < 0.05; **, P < 0.01; ***, P < 0.001, by Wilcoxon or Student’s t test.
Figure 2.
Figure 2.
IL-21 production by TSLP-DC–polarized CD4 T cells is stable. (A) DCs were activated with TSLP (50 ng/ml, TSLP-DC, filled triangles) or in control medium (DC, circles). After 24 h, DCs were co-cultured with naive CD4 T cells and stimulated for 24 h with anti-CD3/CD28 beads. IL-21 concentration in the supernatants from seven independent experiments. (B) Quantification of IL-21 secretion by CD4 T cells polarized for 6 d with DCs, previously activated for 24 h with increasing doses of TSLP. SEM for four independent experiments; *, P < 0.05; **, P < 0.01; ***, P < 0.001, paired Student’s t test. (C) CD4 T cell fold expansion and IL-21 secretion from co-cultures with untreated CD1c+, TSLP-activated CD1c+ and TSLP-activated CD141+ DCs. SEM for 12 independent experiments; *, P < 0.05; ***, P < 0.001, paired Student’s t test. (D) Intracellular FACS staining of IL-21, TNF, and IL-4 by TSLP-DC–activated CD4 T cells at the indicated days of primary and secondary culture from a representative CD4 T cell donor. In primary culture CD4 T cells were activated by TSLP-DC. In secondary culture, cells from day 5 of primary culture were cultured for 6 d in medium alone (No DC), with TSLP-DC or LPS-DC. (E) Percentage of IL-21+/TNF+ and IL-21+/IL-4+ cells (among activated cells) and fold expansion in primary and secondary culture as indicated, in three independent experiments. NA, not applicable.
Figure 3.
Figure 3.
T cells polarized by TSLP-DC possess key features of human Tfh cells. (A) ELISA for CXCL13 production by CD4 T cells differentiated for 6 d in co-culture with DCs, TSLP-DC, or LPS-DC. Cytokines secretion was measured after an additional 24 h of anti-CD3/CD28 bead stimulation. Data are mean ± SEM from 20 independent experiments. **, P < 0.01, paired Student’s t test. For the kinetic of CXCL13 expression, CD4 T cells were restimulated for 24 h with anti-CD3/CD28 beads after 3, 4, 5, or 6 d of co-culture with DCs (circles) or TSLP-DC (triangles). SEM for seven independent experiments. (B) FACS staining for ICOS, PD1, and CXCR5 in CD4 T cells after 4 d of co-culture with DCs. CXCR5hi/ICOShi and CXCR5hi/PD1hi cells within CD4 T DAPI cells from a representative donor are shown. (C) Quantification of cell populations as indicated in B in naive CD4 T cells after 0, 2, 4, or 6 d of co-culture with DCs (circles), TSLP-DC (filled triangles), or LPS-DC (open triangles). SEM from six independent experiments. (D) CXCR5hi/PD1hi and CXCR5lo/PD1lo CD4 T cells polarized 4 d by TSLP-DC were sorted (top), and co-cultured with autologous memory B cells for 14 d. CD38 and CD27 were measured by FACS on B cells (DAPI/CD3/CD4/CD19+). One representative plot is shown. (E) IgA, IgG, IgG4, and IgE were quantified in the supernatants of co-cultures, as in D, in the indicated conditions. Mean ± SEM for five donors. n.d., not detected. (F) Quantification of IgG and IgE in the supernatants of memory B cells co-cultured as in D, plus IL4R-α blocking or isotype control antibodies. SEM from five independent experiments are plotted. *, P < 0.05; **, P < 0.01, paired Student’s t test.
Figure 4.
Figure 4.
T cells polarized by TSLP-DC show an expression pattern similar to tonsillar Tfh cells. Heat map showing mRNA quantification of Tfh and Th markers in naive CD4 T cells, TSLP-DC–polarized CD4 T cells, and human tonsillar CD4 populations. CD4 T cells differentiated for 4 d with TSLP-DC were sorted as indicated (top left). Three populations of tonsillar CD4 cells were sorted (top right): CXCR5hi/PD1hi (GC Tfh), CXCR5int/PD1int (Tfh), and CXCR5/PD1. mRNA levels normalized on the B2M and RPL34 housekeeping genes and center reduced are displayed on the heat map from five independent donors and two independent experiments.
Figure 5.
Figure 5.
TSLP-induced cells express Tfh markers. FACS analysis of BTLA (A), CD200 (B), SAP (C), C-MAF (D), and CCR7 (E) in naive CD4 T cells and in TSLP-DC and LPS-DC activated cells at day 4 of co-culture with naive CD4 T cells. Isotype and specific staining for naive CD4 T cells and CXCR5hi/PD1hi and CXCR5lo/PD1lo population induced by TSLP-DC and LPS-DC is shown in histogram plot for one representative experiment. Quantification of MFI is plotted for three or four independent experiments. Naive CD4 T cells, filled diamond; TSLP-DC co-culture, filled triangles; LPS-DC co-culture, triangles. *, P < 0.05; **, P < 0.01; ***, P < 0.001, paired Student’s t test.
Figure 6.
Figure 6.
CD4 T cells activated by TSLP-DC coexpress BCL6 and GATA3. (A) FACS staining for BLC6, TBET, GATA3, and RORGT in naive CD4 T cells co-cultured with TSLP-DC for 4 d. (B) Tonsillar CD4 cells analyzed as in A. Gates were set using fluorescence minus one plus isotype, and percentage of cells in each quadrant are shown for one representative donor. (C) Quantification of BCL6, TBET, GATA3, and RORGT MFI in naive CD4 T cells and from data shown in A and B from three or five independent experiments. Empty squares, naive CD4 T cells; dots, TSLP-DC activated CD4; triangles, tonsillar CD4+ T cells. *, P < 0.05; **, P < 0.01; ***, P < 0.001; ****, P < 0.0001, unpaired Student’s t test. (D) CD4 T cells sorted as CXCR5hiPD1hi at day 4 of co-culture with TSLP-DC were analyzed for intracellular expression of IL-4, IL-21, GATA3, and BCL6. One representative experiment is shown, and quantification of % of GATA3+/BCL6+ cells is plotted for four independent experiments. Mean ± SEM is plotted. *, P < 0.05; **, P < 0.01, paired Student’s t test.
Figure 7.
Figure 7.
Memory CD4 T cells express Tfh factors after activation by TSLP-DC. CD4 memory T cells were cultured with DCs, TSLP-DC, or LPS-DC, and cytokines were measured at the indicated days after 24 h of restimulation with anti-CD3/CD28 beads. ELISA assay for IL-21 at day 6 of culture in A and at day 2, 4, and 6 in B. Mean ± SEM for 13 and 5 donors is shown, from four and two independent experiments, respectively. ELISA assay for CXCL13 in C and CBA assay for Th cytokines in D in the same experimental settings as in B. (E and F) Memory CD4 T cells were separated into CXCR5+ and CXCR5 cells by FACS sorting, and cultured with DCs or TSLP-DC for 6 d. IL-21 and CXCL13 quantification after 24 h of anti-CD3/CD28 stimulation is shown as mean ± SEM from nine independent experiments. FACS staining for ICOS, PD1, and CXCR5 at day 6 of co-culture. BCL6 was quantified on the CXCR5hi/PD1hipopulation. The geometric MFI is plotted for three or two independent experiments. *, P < 0.05; **, P < 0.01; ***, P < 0.001, paired Student’s t test.
Figure 8.
Figure 8.
TSLP-DC induce IL-21 and CXCL13 production through OX40L. (A) FACS analysis of surface expression of CD86, PDL1, ICOSL, and OX40L by DCs cultured without any stimulation (NT), TSLP, or LPS for 48 h. Filled gray histogram shows matched isotype control. Black histogram shows antibody staining. One representative donor is shown. (B) Quantification of MFI as in A. Mean ± SEM for seven experiments. (C) Quantification of cytokine by CBA (IL-3 and IL-10) or ELISA (CXCL13 and IL-21) by CD4 T cells differentiated during 6 d with DCs or TSLP-DC. Anti-ICOSL blocking antibody or isotype control antibody (25 µg/ml) were kept all along the culture. Mean ± SEM for four experiments, is plotted. D) Cells were cultured as in C, and instead of ICOSL blocking antibody, an anti-OX40L antibody or isotype control (50 µg/ml) were used. Mean ± SEM for seven experiments. *, P < 0.05; **, P < 0.01; ***, P < 0.001, paired Student’s t test.
Figure 9.
Figure 9.
OX40L blocking reduces BCL6 induction by TSLP-DC. (A) Quantification of IL-10 production using CBA by CD4 T cells differentiated during 6 d with pDC activated with CpGB (15 µg/ml during 24 h). Anti-ICOSL blocking antibody or isotype control antibody (25 µg/ml) were added at the beginning of the culture. Mean ± SEM for six experiments is plotted. *, P < 0.05 Wilcoxon matched pair test. (B) Quantification by FACS analysis of the percentage of CXCR5hiPD1hi, CXCR5loPD1lo cells in TSLP-DC co-culture at day 4, treated with functional blocking antibodies or isotype controls as indicated. The percentage of each gate is shown. For BCL6 expression, gray histograms represent the FMO signal, and red histograms represent specific BCL6 staining. MFI of specific staining and percentage of BCL6+ cells are plotted for one representative experiment. (C and D) Quantification as in B, from six independent experiments. SMFI for BCL6 was calculated by subtracting the FMO from BCL6-specific staining in CXCR5hiPD1hi and CXCR5loPD1lo cells. *, P < 0.05; **, P < 0.01; ***, P < 0.001, paired Student’s t test.
Figure 10.
Figure 10.
In NS patients, serum TSLP levels positively correlate with CXCL13. (A) FACS analysis showing the frequency of CCR6CXCR3 (green), CCR6CXCR3+, and CCR6+CXCR3 populations in the CD4+CD45RO+CXCR5+ gate. Representative plots are shown for a healthy donor and AD donor, respectively. Frequency distribution in six AD donors, and four healthy donors are plotted. *, P < 0.05; **, P < 0.01; ***, P < 0.001, paired Student’s t test. (B) Linear correlation between serum TSLP and CXCL13, measured by ELISA, is shown. Spearman r and P-values are plotted. 64 samples from 13 NS patients are plotted.

Similar articles

Cited by

References

    1. Alculumbre S., and Pattarini L.. 2016. Purification of human dendritic cell subsets from peripheral blood. Methods Mol. Biol. 1423:153–167. 10.1007/978-1-4939-3606-9_11 - DOI - PubMed
    1. Ballesteros-Tato A., Randall T.D., Lund F.E., Spolski R., Leonard W.J., and León B.. 2016. T follicular helper cell plasticity shapes pathogenic T helper 2 Cell-mediated immunity to inhaled house dust mite. Immunity. 44:259–273. 10.1016/j.immuni.2015.11.017 - DOI - PMC - PubMed
    1. Bernasconi N.L., Traggiai E., and Lanzavecchia A.. 2002. Maintenance of serological memory by polyclonal activation of human memory B cells. Science. 298:2199–2202. 10.1126/science.1076071 - DOI - PubMed
    1. Brandt E.B., and Sivaprasad U.. 2011. Th2 Cytokines and atopic dermatitis. J. Clin. Cell. Immunol. 2:3–5. 10.4172/2155-9899.1000110 - DOI - PMC - PubMed
    1. Briot A., Deraison C., Lacroix M., Bonnart C., Robin A., Besson C., Dubus P., and Hovnanian A.. 2009. Kallikrein 5 induces atopic dermatitis-like lesions through PAR2-mediated thymic stromal lymphopoietin expression in Netherton syndrome. J. Exp. Med. 206:1135–1147. 10.1084/jem.20082242 - DOI - PMC - PubMed

MeSH terms