

microRNA-33 Regulates Macrophage Autophagy in Atherosclerosis
- PMID: 28428217
- PMCID: PMC5494696
- DOI: 10.1161/ATVBAHA.116.308916
microRNA-33 Regulates Macrophage Autophagy in Atherosclerosis
Abstract
Objective: Defective autophagy in macrophages leads to pathological processes that contribute to atherosclerosis, including impaired cholesterol metabolism and defective efferocytosis. Autophagy promotes the degradation of cytoplasmic components in lysosomes and plays a key role in the catabolism of stored lipids to maintain cellular homeostasis. microRNA-33 (miR-33) is a post-transcriptional regulator of genes involved in cholesterol homeostasis, yet the complete mechanisms by which miR-33 controls lipid metabolism are unknown. We investigated whether miR-33 targeting of autophagy contributes to its regulation of cholesterol homeostasis and atherogenesis.
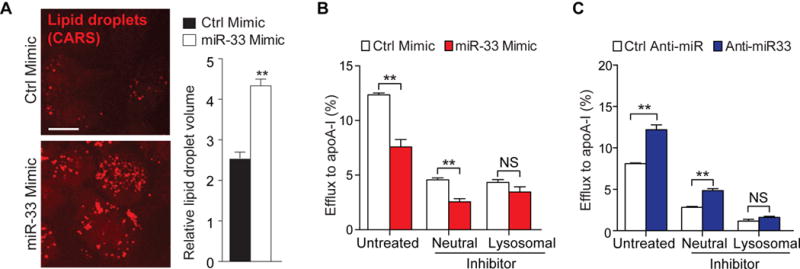
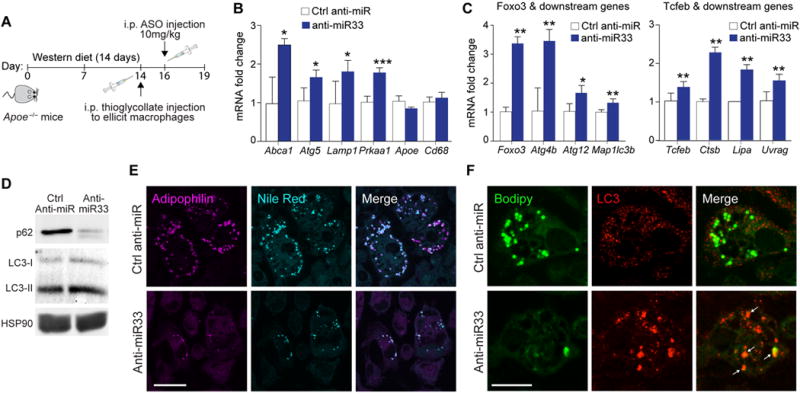
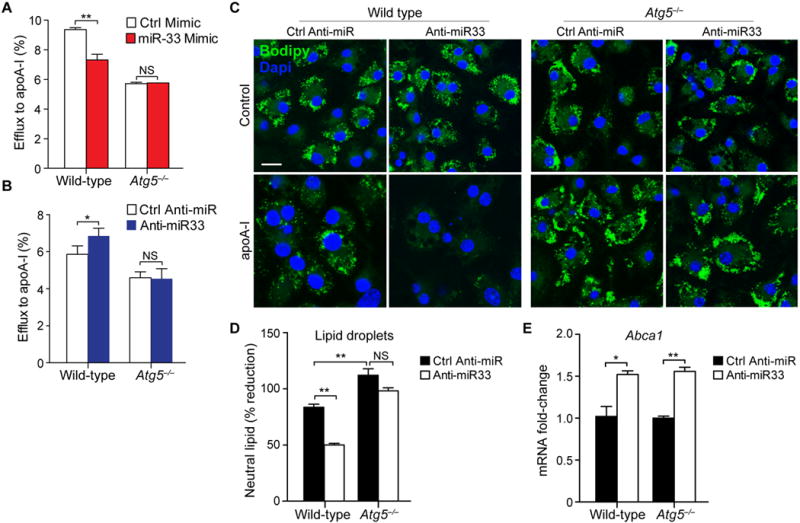
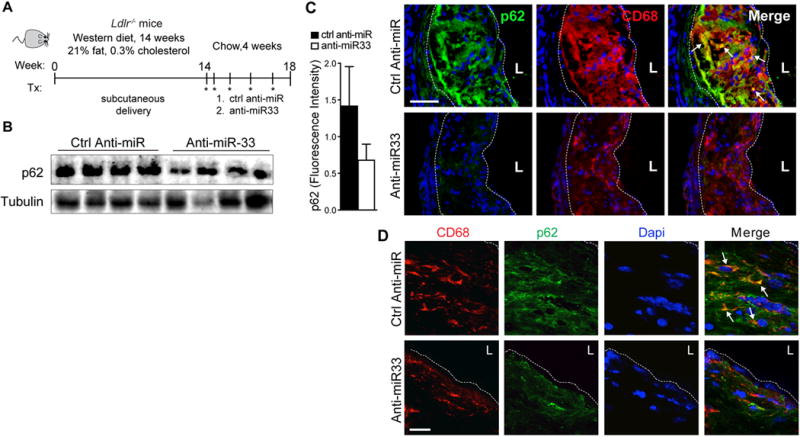
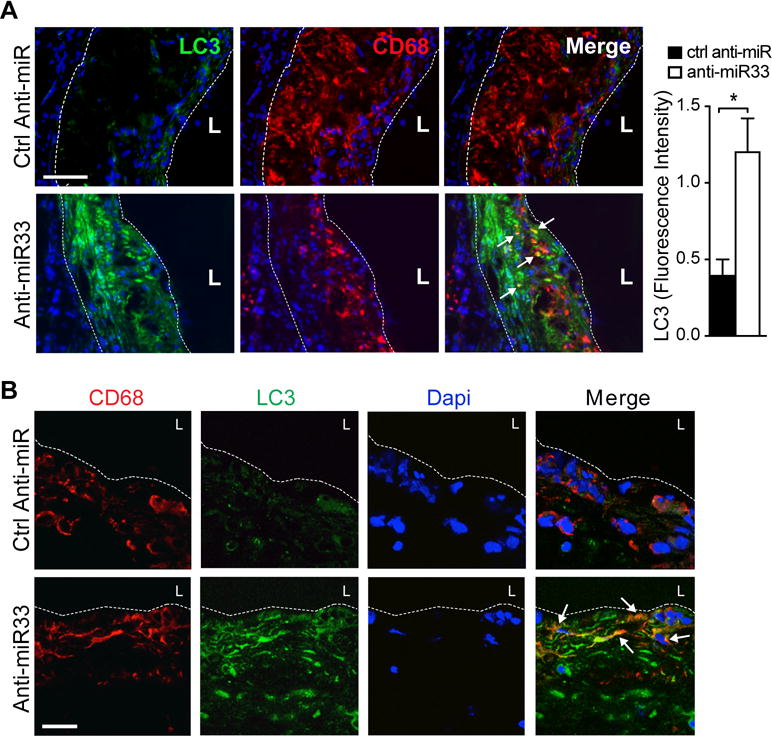
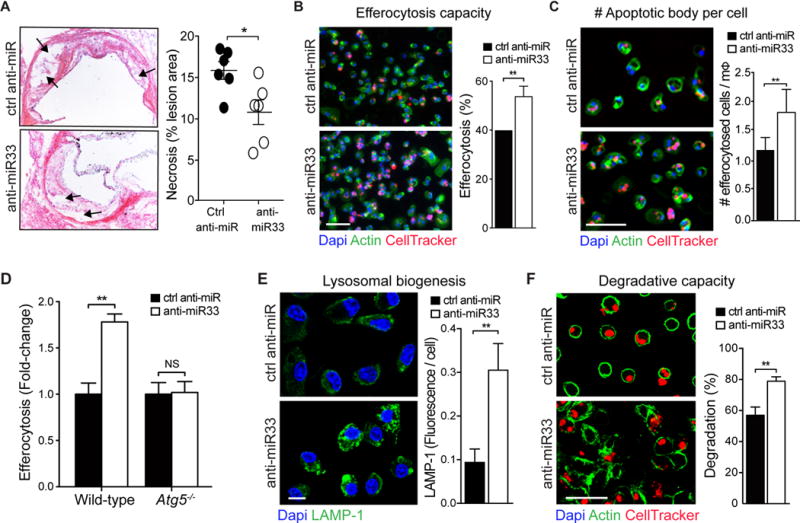
Approach and results: Using coherent anti-Stokes Raman scattering microscopy, we show that miR-33 drives lipid droplet accumulation in macrophages, suggesting decreased lipolysis. Inhibition of neutral and lysosomal hydrolysis pathways revealed that miR-33 reduced cholesterol mobilization by a lysosomal-dependent mechanism, implicating repression of autophagy. Indeed, we show that miR-33 targets key autophagy regulators and effectors in macrophages to reduce lipid droplet catabolism, an essential process to generate free cholesterol for efflux. Notably, miR-33 regulation of autophagy lies upstream of its known effects on ABCA1 (ATP-binding cassette transporter A1)-dependent cholesterol efflux, as miR-33 inhibitors fail to increase efflux upon genetic or chemical inhibition of autophagy. Furthermore, we find that miR-33 inhibits apoptotic cell clearance via an autophagy-dependent mechanism. Macrophages treated with anti-miR-33 show increased efferocytosis, lysosomal biogenesis, and degradation of apoptotic material. Finally, we show that treating atherosclerotic Ldlr-/- mice with anti-miR-33 restores defective autophagy in macrophage foam cells and plaques and promotes apoptotic cell clearance to reduce plaque necrosis.
Conclusions: Collectively, these data provide insight into the mechanisms by which miR-33 regulates cellular cholesterol homeostasis and atherosclerosis.
Keywords: atherosclerosis; autophagy; hydrolysis; lipid droplets; macrophages.
© 2017 American Heart Association, Inc.
Figures
Similar articles
-
MicroRNA 302a is a novel modulator of cholesterol homeostasis and atherosclerosis.Arterioscler Thromb Vasc Biol. 2015 Feb;35(2):323-31. doi: 10.1161/ATVBAHA.114.304878. Epub 2014 Dec 18. Arterioscler Thromb Vasc Biol. 2015. PMID: 25524771 Free PMC article.
-
Diosgenin inhibits atherosclerosis via suppressing the MiR-19b-induced downregulation of ATP-binding cassette transporter A1.Atherosclerosis. 2015 May;240(1):80-9. doi: 10.1016/j.atherosclerosis.2015.02.044. Epub 2015 Feb 24. Atherosclerosis. 2015. PMID: 25765596
-
MicroRNA-19b promotes macrophage cholesterol accumulation and aortic atherosclerosis by targeting ATP-binding cassette transporter A1.Atherosclerosis. 2014 Sep;236(1):215-26. doi: 10.1016/j.atherosclerosis.2014.07.005. Epub 2014 Jul 18. Atherosclerosis. 2014. PMID: 25084135
-
microRNAs in lipoprotein metabolism and cardiometabolic disorders.Atherosclerosis. 2016 Mar;246:352-60. doi: 10.1016/j.atherosclerosis.2016.01.025. Epub 2016 Jan 18. Atherosclerosis. 2016. PMID: 26828754 Free PMC article. Review.
-
Regulation of lipid droplet cholesterol efflux from macrophage foam cells.Arterioscler Thromb Vasc Biol. 2012 Mar;32(3):575-81. doi: 10.1161/ATVBAHA.111.240705. Epub 2011 Dec 29. Arterioscler Thromb Vasc Biol. 2012. PMID: 22207731 Review.
Cited by
-
miR-409-3p is reduced in plasma and islet immune infiltrates of NOD diabetic mice and is differentially expressed in people with type 1 diabetes.Diabetologia. 2020 Jan;63(1):124-136. doi: 10.1007/s00125-019-05026-1. Epub 2019 Oct 28. Diabetologia. 2020. PMID: 31659408
-
A novel therapeutic strategy for atherosclerosis: autophagy-dependent cholesterol efflux.J Physiol Biochem. 2022 Aug;78(3):557-572. doi: 10.1007/s13105-021-00870-5. Epub 2022 Jan 22. J Physiol Biochem. 2022. PMID: 35064467 Review.
-
Lysophosphatidic acid enhances neointimal hyperplasia following vascular injury through modulating proliferation, autophagy, inflammation and oxidative stress.Mol Med Rep. 2018 Jul;18(1):87-96. doi: 10.3892/mmr.2018.8937. Epub 2018 Apr 27. Mol Med Rep. 2018. PMID: 29749484 Free PMC article.
-
Experimental Study on the Compatibility and Characteristics of a Dual-Target Microbubble Loaded with Anti-miR-33.Int J Nanomedicine. 2021 Sep 11;16:6265-6280. doi: 10.2147/IJN.S324514. eCollection 2021. Int J Nanomedicine. 2021. PMID: 34539179 Free PMC article.
-
Loss of hepatic miR-33 improves metabolic homeostasis and liver function without altering body weight or atherosclerosis.Proc Natl Acad Sci U S A. 2021 Feb 2;118(5):e2006478118. doi: 10.1073/pnas.2006478118. Proc Natl Acad Sci U S A. 2021. PMID: 33495342 Free PMC article.
References
-
- Ouimet M. Autophagy in obesity and atherosclerosis: Interrelationships between cholesterol homeostasis, lipoprotein metabolism and autophagy in macrophages and other systems. Biochimica et biophysica acta. 2013;1831:1124–1133. - PubMed
MeSH terms
Substances
Grants and funding
LinkOut - more resources
Full Text Sources
Other Literature Sources
Medical
Molecular Biology Databases
