. 2017 Jun;37(6):1068-1075.
doi: 10.1161/ATVBAHA.117.309114. Epub 2017 Apr 20.

Deficiency of Cholesteryl Ester Transfer Protein Protects Against Atherosclerosis in Rabbits

Affiliations

Deficiency of Cholesteryl Ester Transfer Protein Protects Against Atherosclerosis in Rabbits

Jifeng Zhang et al. Arterioscler Thromb Vasc Biol. 2017 Jun.

Abstract

Objective: CETP (cholesteryl ester transfer protein) plays an important role in lipoprotein metabolism; however, whether inhibition of CETP activity can prevent cardiovascular disease remains controversial.

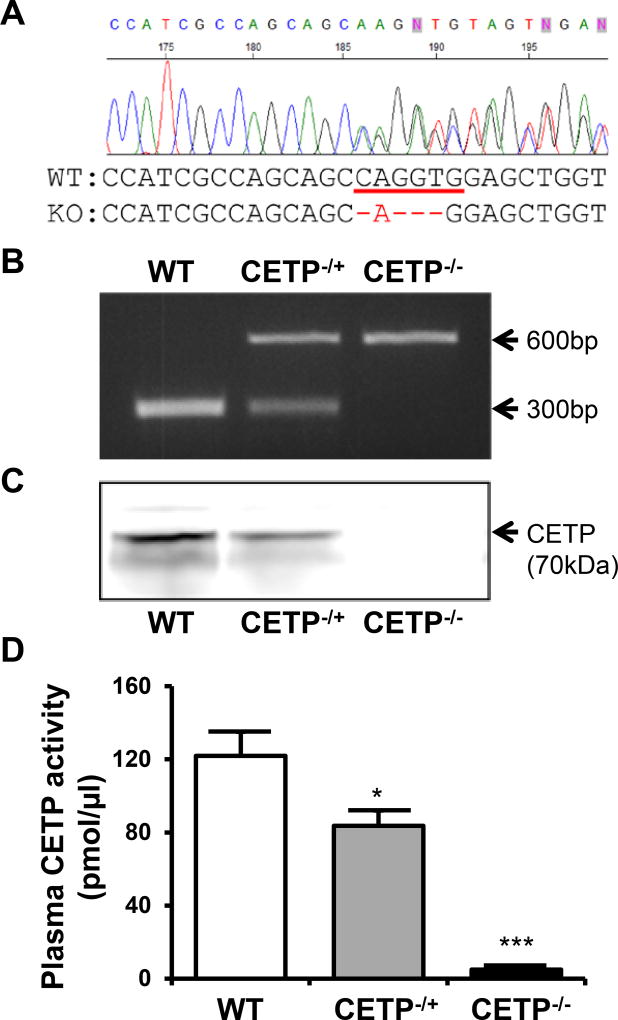
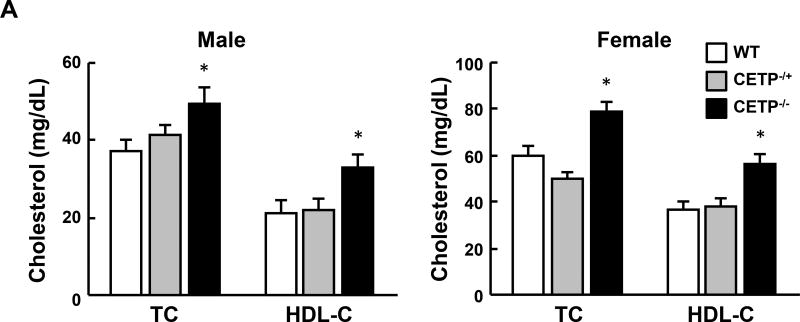
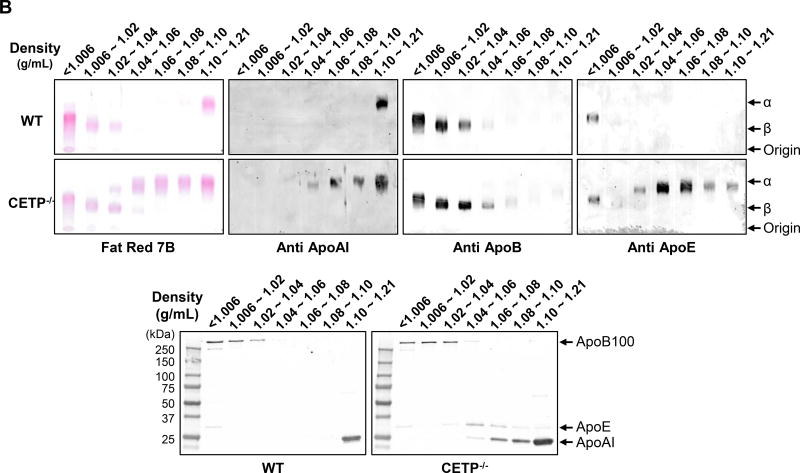
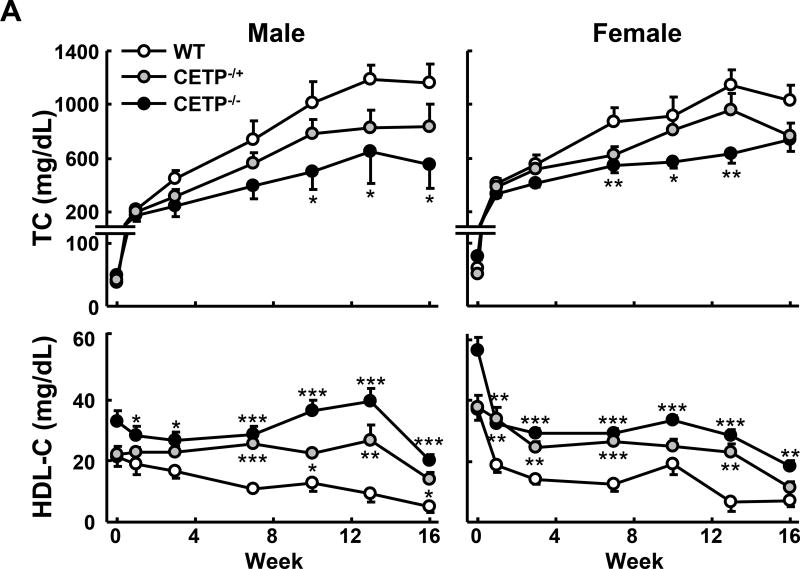
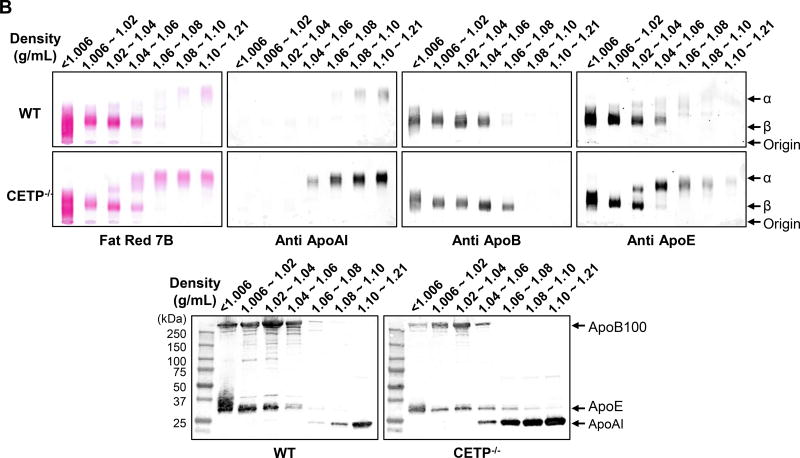
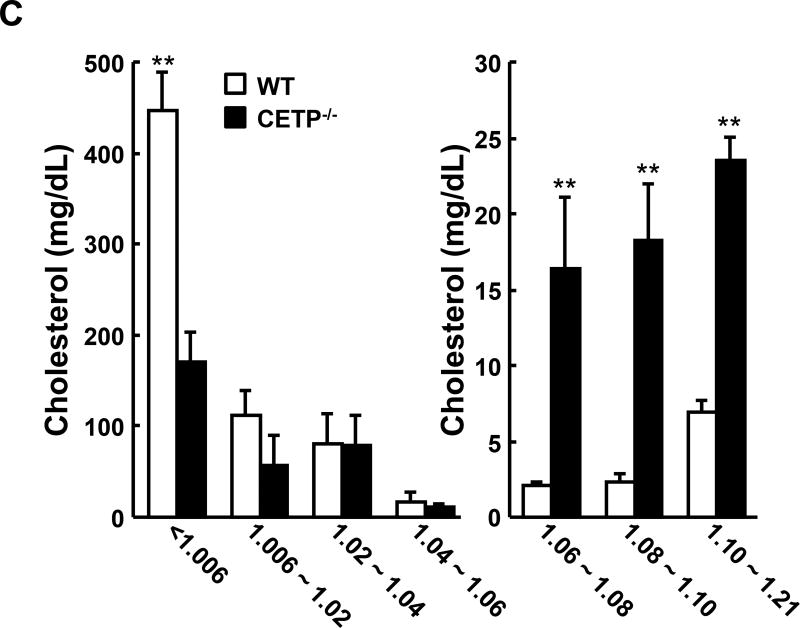
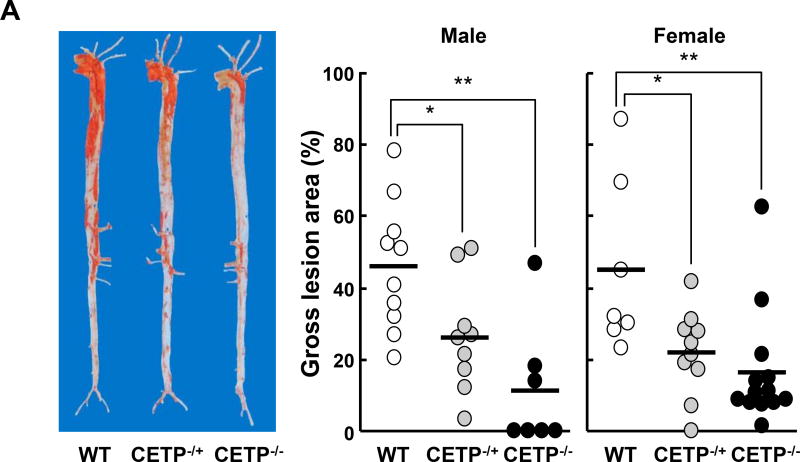
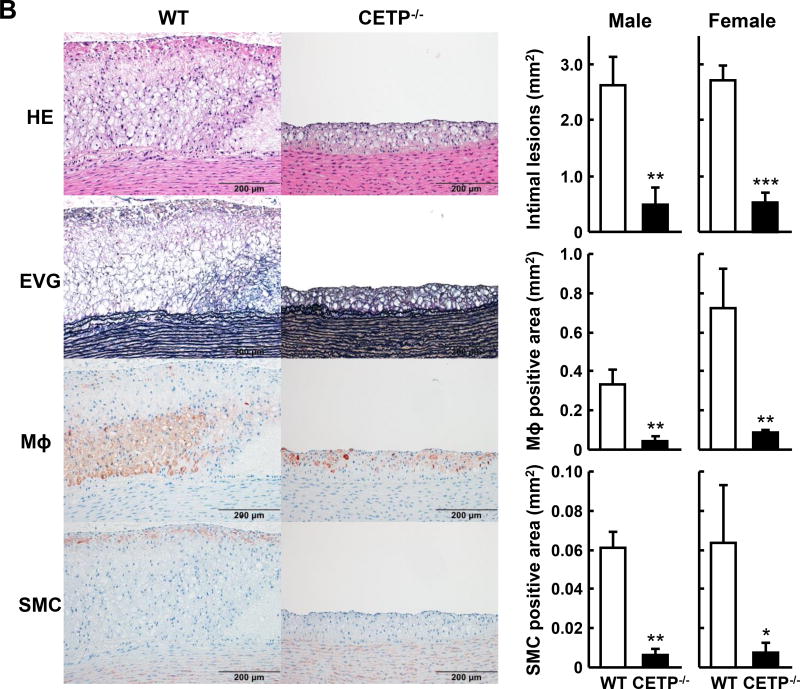
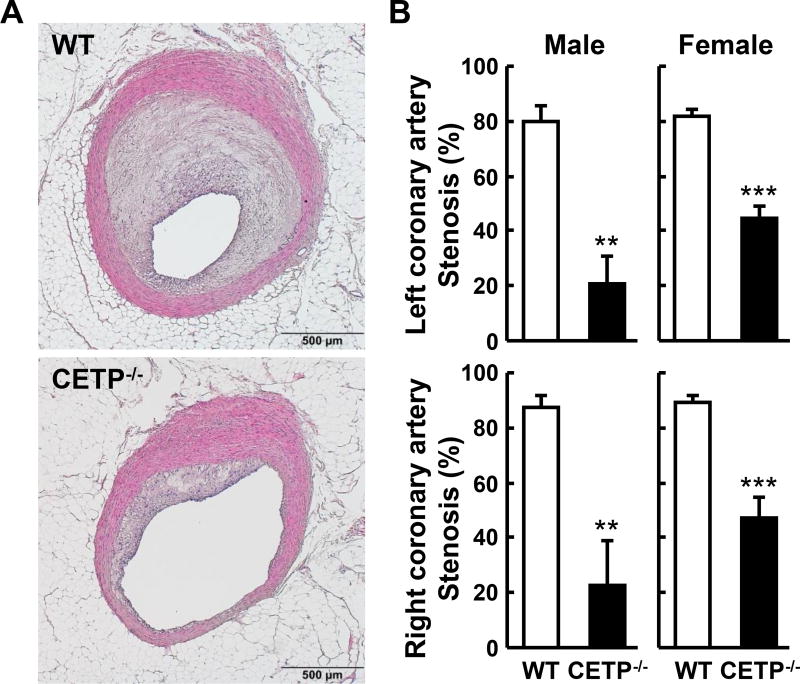
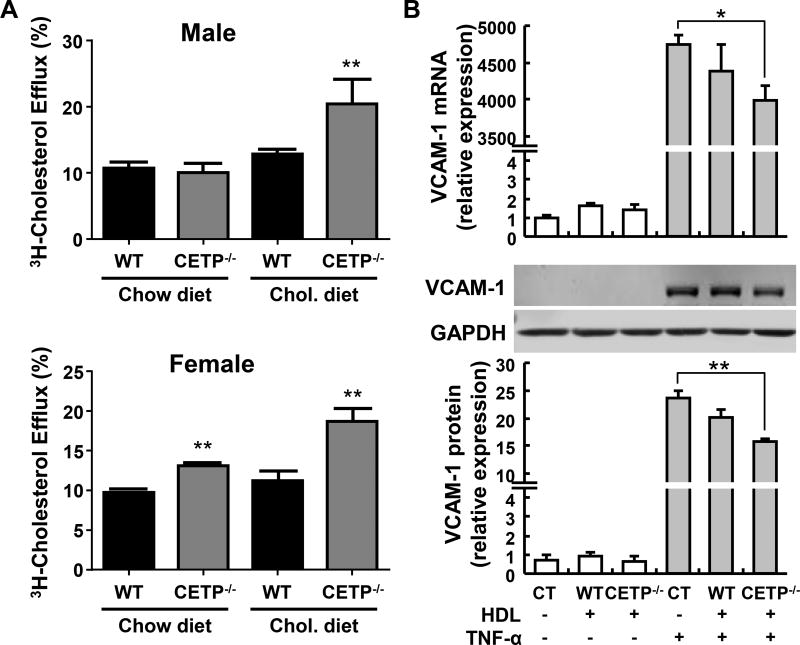
Approach and results: We generated CETP knockout (KO) rabbits by zinc finger nuclease gene editing and compared their susceptibility to cholesterol diet-induced atherosclerosis to that of wild-type (WT) rabbits. On a chow diet, KO rabbits showed higher plasma levels of high-density lipoprotein (HDL) cholesterol than WT controls, and HDL particles of KO rabbits were essentially rich in apolipoprotein AI and apolipoprotein E contents. When challenged with a cholesterol-rich diet for 18 weeks, KO rabbits not only had higher HDL cholesterol levels but also lower total cholesterol levels than WT rabbits. Analysis of plasma lipoproteins revealed that reduced plasma total cholesterol in KO rabbits was attributable to decreased apolipoprotein B-containing particles, while HDLs remained higher than that in WT rabbits. Both aortic and coronary atherosclerosis was significantly reduced in KO rabbits compared with WT rabbits. Apolipoprotein B-depleted plasma isolated from CETP KO rabbits showed significantly higher capacity for cholesterol efflux from macrophages than that from WT rabbits. Furthermore, HDLs isolated from CETP KO rabbits suppressed tumor necrosis factor-α-induced vascular cell adhesion molecule 1 and E-selectin expression in cultured endothelial cells.

Conclusions: These results provide evidence that genetic ablation of CETP activity protects against cholesterol diet-induced atherosclerosis in rabbits.

Keywords: apolipoprotein; atherosclerosis; cholesterol reduction; cholesteryl ester transfer protein genetics; high-density lipoprotein.


Figures

Figure 1
Figure 1. Generation of CETP KO rabbits by ZFN genome editing
A. Sequencing analysis revealed 4bp deletion that introduces an early stop codon into the CETP gene. The 4 bp deletion also causes the loss of an XcmI restriction enzyme recognition site. B. PCR for the genotyping of rabbits WT, hetero and homozygous for the CETP gene was conducted with the primers caccgccagcaccccgcacacc (Forward) and tcaaccccagaagccccgaggacact (Reverse) which result in a 608bp and 604bp amplicon from WT and homozygous CETP knockout allele, respectively. Subsequent XcmI enzyme digestion brings the WT amplicon to 293 and 315bp, as evidenced by agarose gel electrophoresis. C. Plasma CETP protein was detected by Western blotting using a monoclonal antibody against rabbit CETP. One microliter of plasma was loaded in each lane. D. Plasma CETP activity was measured by Roar CETP activity assay kit as described in the materials and methods. N=8–14 for each group. Data are expressed as the mean ± SEM. *P<0.05, *** P<0.001 vs. the WT control group.
Figure 2
Figure 2. Analysis of plasma lipid profiles from rabbits fed a chow diet
A. Total cholesterol (TC) and HDL-C levels in plasma from CETP KO and WT rabbits. B. Plasma lipoproteins of rabbits fed a chow diet. Top panels. Plasma lipoproteins were separated by sequential density ultracentrifugation according to the density ranges shown above the gels. An equal volume of each fraction was resolved by electrophoresis in a 1% agarose gel. Lipoproteins were visualized using Fat red 7B staining, and apolipoproteins were identified by immunoblotting with specific antibodies against apoB, apoE, and apoAI. α and β indicate electrophoretic mobility. Bottom panels. These fractions were further analyzed using 5~20% SDS-PAGE and probed with antibodies against apoB, apoE, and apoAI. N=8–14 for each group. Data are expressed as the mean ± SEM. All rabbits are in the range between 3 to 4 month old. *P<0.05 vs. the WT control group.
Figure 3
Figure 3. Analysis of plasma lipid profiles from rabbits fed a cholesterol-rich diet
A. The plasma lipid profile was monitored during the 16 weeks of cholesterol-rich diet treatment. N=8–14 for each group. B. Plasma lipoproteins were separated by sequential density ultracentrifugation and analyzed as in figure 2B. C. Cholesterol contents of each lipoprotein fraction were quantified using the Wako total Cholesterol assay kit. The combined recovery for each animal averaged ~80% of the total amount in plasma. N=3 for each group. Data are expressed as the mean ± SEM. ***P<0.001, **P<0.01 or *P<0.05 vs. WT control group.
Figure 4
Figure 4. Quantification of aortic atherosclerosis at 16 weeks of cholesterol-rich diet feeding
A. Representative pictures of aortas stained with Sudan IV are shown on the left. The lesion area (defined by sudanophilic staining as red) was quantified using an image analysis system (right). Each dot represents the lesion area of an individual animal. Horizontal bar represents the mean for each genotype. N=7–13 for each group. B. Representative micrographs of the aortic arch lesions from each group. Serial cuts from paraffin sections were stained with hematoxylin-eosin (HE) and elastica van Gieson (EVG) or immunohistochemically stained with monoclonal antibodies against macrophages (Mϕ) or α-smooth muscle actin for smooth muscle cells (SMCs). The lesions are characterized by intimal accumulation of macrophage-derived foam cells intermingled with smooth muscle cells (left panels). Scale bars represent 200µm. The right panel shows the quantification of the lesions of different parts of aortas. The intimal lesion area and the area with positive immunostaining for macrophages and SMCs were quantified using an image analysis system as described in the Materials and Methods. N=5–14 for each group. Data are expressed as the mean ± SEM. ***P<0.001, **P<0.01 or *P<0.05 vs. WT control group.
Figure 5
Figure 5. Quantification of coronary atherosclerotic lesions
A. Representative micrographs of the left coronary atherosclerotic lesions from each group (HE staining). B. The lesion size (expressed as stenosis %) of both right and left coronary arteries is shown. N=5–12 for each group. Data are expressed as the mean ± SEM. **P<0.01 or *P<0.05 vs. WT control group.
Figure 6
Figure 6. Improved HDL function in CETP KO rabbits
A. Cholesterol efflux capacity assay. A. ApoB depleted plasma from CETP KO rabbits shows significantly higher cholesterol efflux capacity compared with plasma from WT rabbits, especially after cholesterol rich diet feeding. Plasma was collected from male and female rabbits, respectively, fed with normal chow or cholesterol-rich diet for 10 weeks. ApoB-depleted plasma was obtained by PEG precipitation as described in the methods section. B. Anti-inflammatory activity of HDL. HDL3 isolated from CETP KO rabbits shows increased anti-inflammatory in cultured endothelial cells effect than that from WT rabbits. HDL3 was isolated by sequential density ultracentrifugation as described in Figure 2B. HUVECs were pre-treated with rabbit HDL3 (5 µg protein/ml, N=6) for 1hr and then stimulated with TNF-α (1 ng/ml) for 4 h. The expression of the proinflammatory adhesion molecule VCAM-1 was determined by qRT-PCR (upper panel). The protein levels of VCAM-1 were detected by Western blotting (middle and lower panel). Quantitative data were generated with Image Studio (LI-COR) from three independent Western blot experiments. Data are expressed as the mean ± SEM *P<0.05 vs. WT group.

Similar articles

Cited by

References

    1. Gordon T, Castelli WP, Hjortland MC, Kannel WB, Dawber TR. High-density lipoprotein as a protective factor against coronary heart-disease - framingham study. Am J Med. 1977;62:707–714. - PubMed
    1. Degoma EM, Rader DJ. Novel hdl-directed pharmacotherapeutic strategies. Nature reviews. Cardiology. 2011;8:266–277. - PMC - PubMed
    1. Tall AR. Plasma cholesteryl ester transfer protein. Journal of lipid research. 1993;34:1255–1274. - PubMed
    1. Barter PJ, Nicholls SJ, Kastelein JJ, Rye KA. Is cholesteryl ester transfer protein inhibition an effective strategy to reduce cardiovascular risk? Cetp inhibition as a strategy to reduce cardiovascular risk: The pro case. Circulation. 2015;132:423–432. - PubMed
    1. Brown ML, Inazu A, Hesler CB, Agellon LB, Mann C, Whitlock ME, Marcel YL, Milne RW, Koizumi J, Mabuchi H, Takeda R, Tall AR. Molecular basis of lipid transfer protein deficiency in a family with increased high-density lipoproteins. Nature. 1989;342:448–451. - PubMed

Publication types

MeSH terms

Supplementary concepts