. 2017 Jun 15;28(12):1676-1687.
doi: 10.1091/mbc.E16-12-0863. Epub 2017 Apr 20.

A novel physiological role for ARF1 in the formation of bidirectional tubules from the Golgi

Affiliations

A novel physiological role for ARF1 in the formation of bidirectional tubules from the Golgi

Francesca Bottanelli et al. Mol Biol Cell. .

Abstract

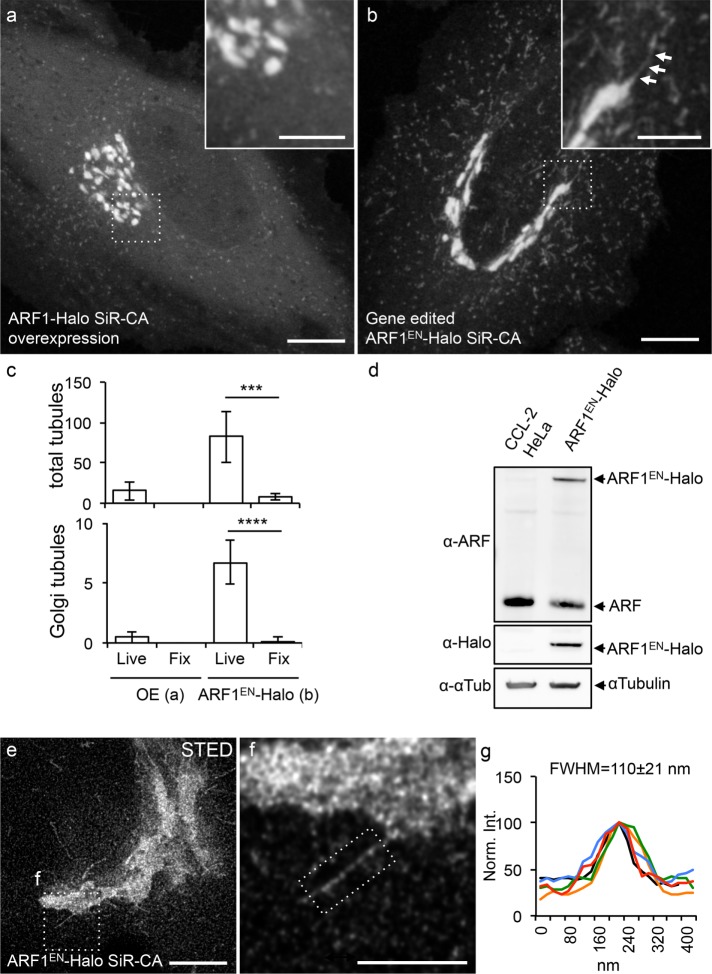
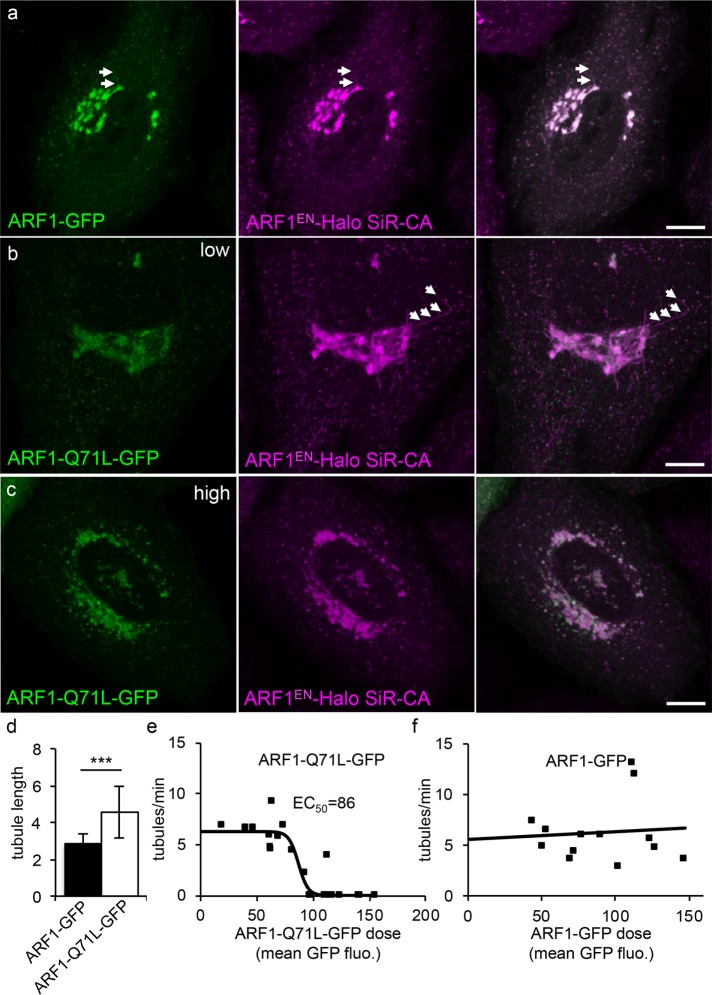
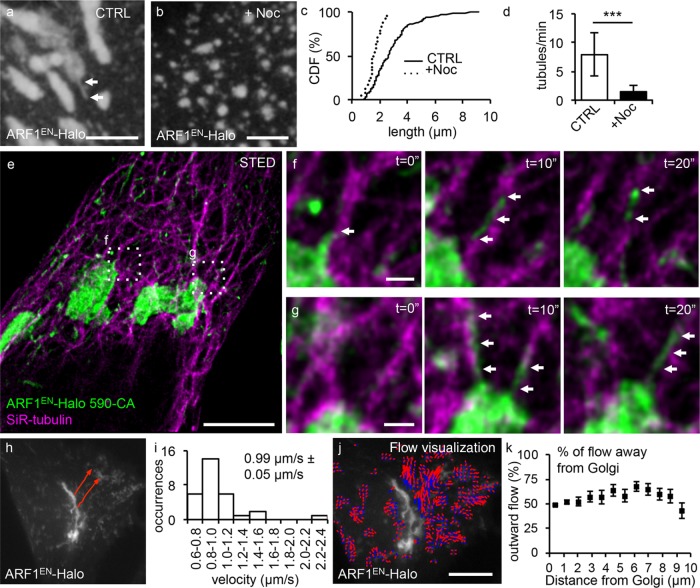
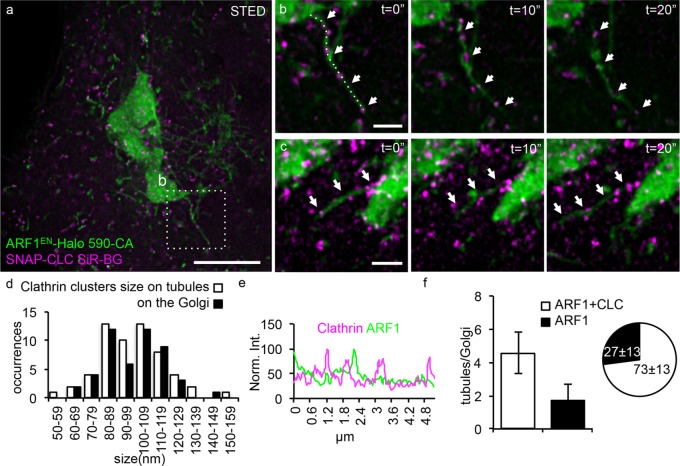
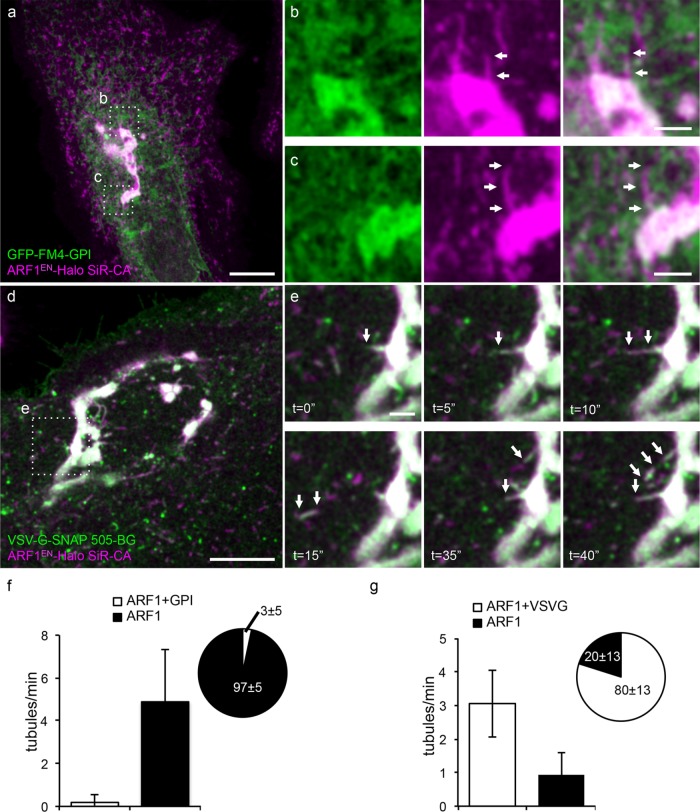
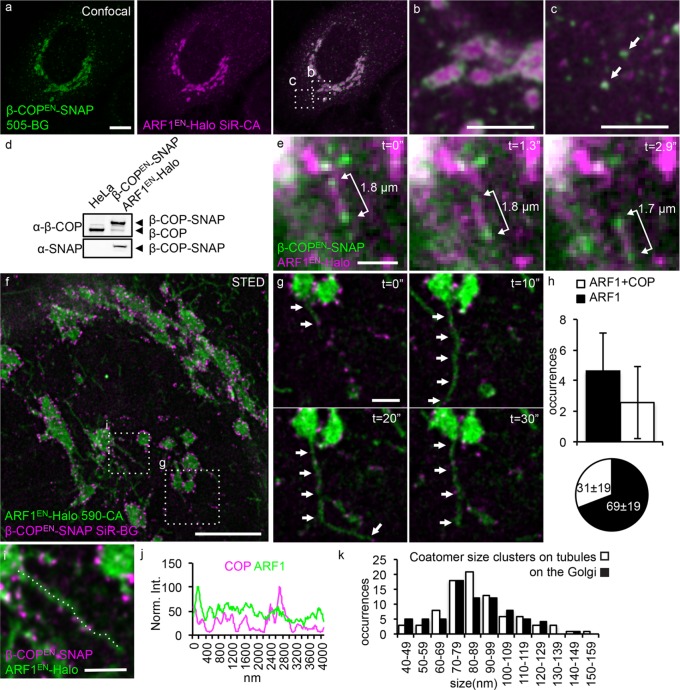
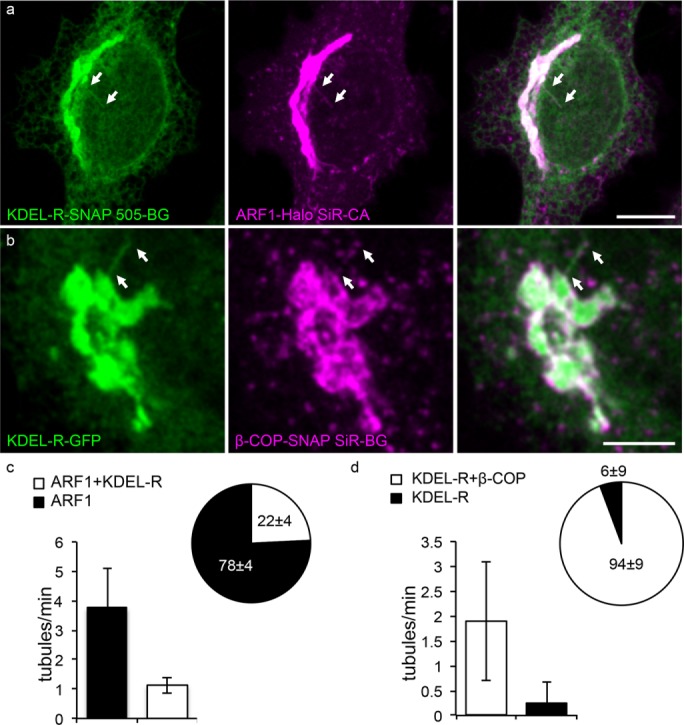
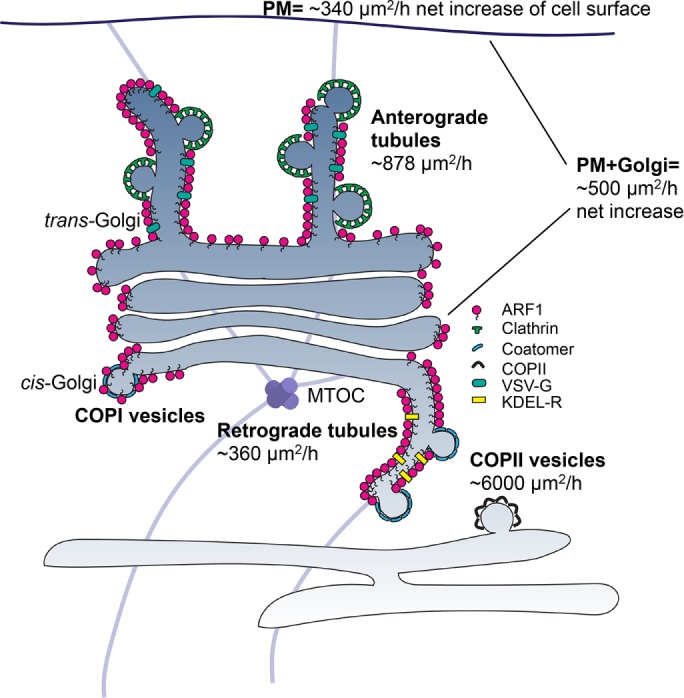
Capitalizing on CRISPR/Cas9 gene-editing techniques and super-resolution nanoscopy, we explore the role of the small GTPase ARF1 in mediating transport steps at the Golgi. Besides its well-established role in generating COPI vesicles, we find that ARF1 is also involved in the formation of long (∼3 µm), thin (∼110 nm diameter) tubular carriers. The anterograde and retrograde tubular carriers are both largely free of the classical Golgi coat proteins coatomer (COPI) and clathrin. Instead, they contain ARF1 along their entire length at a density estimated to be in the range of close packing. Experiments using a mutant form of ARF1 affecting GTP hydrolysis suggest that ARF1[GTP] is functionally required for the tubules to form. Dynamic confocal and stimulated emission depletion imaging shows that ARF1-rich tubular compartments fall into two distinct classes containing 1) anterograde cargoes and clathrin clusters or 2) retrograde cargoes and coatomer clusters.


Figures

FIGURE 1:
FIGURE 1:
Endogenous tagging of ARF1 highlights Golgi-derived tubular structures. Cells either transiently overexpressing ARF1-Halo (a) or expressing gene-edited ARF1EN-Halo (b) were labeled with SiR-CA and imaged with a confocal microscope. (b) A Golgi-derived tubule is highlighted by arrows. (c) Total numbers of tubules/cell and Golgi-derived tubules/cell were quantified in both cells both live and after fixation with 4% PFA. Result of a two-tailed, unpaired t test. ***p < 0.001, ****p < 0.0001 (n = 10 cells). (d) Gene editing was validated via Western blot using an antibody that recognizes class I ARFs (ARF1 and ARF3) due to the high protein sequence homology. The added amounts of ARF1EN-Halo (∼35%) and unedited ARF (∼70%) in the ARF1EN-Halo cell line match the amount of ARF1 (set to 100%) in CCL-2 HeLa cells. (e, f) ARF1EN-Halo cells were imaged on a custom-built STED setup. (g) The average width (FWHM) of the Golgi tubules was 110 ± 21 nm (n = 20). All STED images were deconvolved; the line profile represents raw image data. All error bars represent SD. Scale bars, 10 μm (a, b), 5 μm (cropped images, a, b), 5 μm (e), 2 μm (f).
FIGURE 2:
FIGURE 2:
ARF1 GTPase activity is required for the formation of Golgi-derived tubules. ARF1EN-Halo cells (magenta) were electroporated with plasmids encoding for (a) ARF1-GFP and for ARF1-Q71L-GFP (green) at (b) low and (c) high expression levels. (a, b) Examples of tubules are highlighted by arrows. (d) Cells expressing low levels of ARF1-Q71L-GFP show a significant increase in the length of tubules. Result of a two-tailed, unpaired t test.***p < 0.001 (ARF1-GFP, 13 cells; ARF1-Q71L-GFP, 20 cells). (e) When the mean GFP fluorescence at the Golgi of ARF1-Q71L-GFP reaches a certain threshold (86 A.U.), the frequency of tubules drops drastically. Data points from 20 different time-lapse experiments were fitted to a sigmoidal curve (ARF1-Q71L-GFP). (f) No change in frequency of the tubules is observed when ARF1-GFP is overexpressed (13 time-lapse experiments). Error bars represent SD. Scale bars, 10 μm.
FIGURE 3:
FIGURE 3:
ARF1EN-Halo tubules move toward the cell periphery on microtubule tracks. The length and frequency of tubules in (a) untreated control (CTRL) ARF1EN-Halo cells and (b) nocodazole-treated (+Noc) ARF1EN-Halo cells. (c) In nocodazole-treated cells, the length of the tubules is strongly reduced, as shown by the cumulative distribution functions (CDF) of both treated and control cells. (d) In addition, the frequency of the tubules is greatly reduced. Results of a two-tailed, unpaired t test. ***p < 0.001 (10 time-lapse movies for both CTRL and +Noc cells). (e–g) ARF1EN-Halo (green) cells were treated with SiR-tubulin (magenta) to label microtubules and imaged on a custom-built STED microscope. (f, g) Examples of tubules emanating from the Golgi are highlighted by arrows. (h) Manual tracking with ImageJ of ARF1EN-Halo Golgi-derived tubules reveals (i) an average speed of 0.99 ± 0.05 µm/s. (j, k) Quantification of the outward optical flow of ARF1EN-Halo fluorescence with respect to the distance from the perinuclear Golgi. (j) ARF1EN-Halo flow is represented as blue-to-red arrows to visualize directionality. ARF1EN-Halo flow shows a modest bias for outward vs. inward flow. All STED images were deconvolved. Error bars represent SD (d) and SEM (i, k). Scale bars, 5 μm (a, b), 5 μm (e), 500 nm (f, g), 10 μm (h–j).
FIGURE 4:
FIGURE 4:
The majority of ARF1 tubules are decorated by clathrin clusters. ARF1EN-Halo (green) cells were electroporated with a plasmid encoding for SNAP-CLC (magenta). (a–c) Cells were labeled with 590-CA and SiR-BG for two-color live-cell STED imaging on a custom-built microscope. (b, c) Examples of Golgi-derived tubules are highlighted by arrows. (d) A two-dimensional Lorentzian function was fitted to images of clathrin clusters, and FWHM of the fitted functions is represented in histograms. The average size is 99 ± 18 nm for both clathrin clusters on the tubules and on the Golgi (50 clusters). (e) A line profile along the tubule in b shows that there is no enrichment of ARF1 in the clathrin clusters. (f) Quantification of the number of clathrin-positive tubules shows that 73 ± 13% of the tubules are decorated by SNAP-CLC clusters. All STED images were deconvolved; the line profile represents raw image data. Error bars represent SD. Scale bars, 5 μm (a), 1 μm (b, c).
FIGURE 5:
FIGURE 5:
ARF1EN-Halo post-Golgi tubules contain the anterograde cargo VSV G-SNAP but not the raft-associated cargo GPI-GFP-FM4. ARF1EN-Halo cells were electroporated with GFP-FM4-GPI (a–c) and VSV G-SNAP (d, e) encoding plasmids. Cells were labeled with SiR-CA only (a–c) or 505-BG and SiR-CA (d, e). (a) Aggregated GFP-FM4-GPI was released from the ER by adding the disaggregating drug. (a–c) GFP-FM4-GPI was never observed in ARF1EN-Halo-positive structures. (b, c) ARF1EN-Halo tubules devoid of GFP-FM4-GPI are highlighted by arrows. (d) VSV G-SNAP cells were grown overnight at 40.5°C and then shifted to 32°C on the microscope stage to release the cargo from the ER. (e) At ∼30 min after shifting the cells to the permissive temperature, tubules containing both ARF1EN-Halo and VSV G-SNAP were observed forming at the Golgi (arrows). (f) A negligible fraction of ARF1EN-Halo tubules contained the cargo GFP-FM4-GPI. The frequency of VSV G–positive tubules exiting the Golgi is 3 ± 1 tubules/min, and 80 ± 13% of the ARF1EN-Halo tubules also contained VSV G–SNAP (g). Error bars represent SD. Scale bars, 10 μm (a, c), 2 μm (b, d, e).
FIGURE 6:
FIGURE 6:
Coatomer clusters decorate the remaining fraction of ARF1EN-Halo tubules. (a–c) ARF1EN-Halo and β-COPEN-SNAP double-gene-edited cells were labeled with 505-BG (green) and SiR-CA (magenta) for confocal imaging. β-COPEN-SNAP localizes to (b) the rims of the Golgi cisternae and (c) peripheral ERGIC structures. (d) The correct tagging of endogenous β-COP was validated via Western blot. (e) ARF1EN-Halo and β-COPEN-SNAP cells were imaged with deep-TIRF at a frame rate of ∼3 frames/s on an OMX microscope. (e) Golgi-derived tubular structures labeled by ARF1EN-Halo and decorated by clusters of β-COPEN-SNAP were observed, and the distance between the clusters of coatomer remained constant. (f, g) The same double-gene-edited cells were labeled with 590-CA (green) and SiR-BG (magenta) for live-cell STED imaging on a custom instrument. (h) Single STED frames were used to quantify the number of coatomer-positive tubules/Golgi; 2.5 ± 2.3 tubules/Golgi were decorated by coatomer, which corresponds to 31 ± 19% of the total tubules. (i, j) Line profile along a coatomer-positive tubule shows that there is no enrichment of ARF1EN-Halo in the β-COPEN-SNAP–positive clusters. (k) A two-dimensional Lorentzian function was fitted to images of coatomer clusters, and FWHM of the fitted functions is represented in histograms. The average size of coatomer clusters on the tubules is 89 ± 24 nm, similar to the size of clusters/buds at the Golgi (86 ± 24 nm). All STED images were deconvolved; the line profile represents raw image data. Error bars represent SD. Scale bars, 10 μm (a), 5 μm (b, c), 2 μm (e), 5 μm (f), 1 μm (g, i).
FIGURE 7:
FIGURE 7:
Coatomer-positive tubules contain the retrograde marker KDEL receptor. (a) ARF1EN-Halo cells were electroporated with a KDEL-R-SNAP–encoding plasmid and labeled with 505-BG and SiR-CA for confocal imaging. KDEL-R-SNAP–containing tubules were also decorated by ARF1EN-Halo (arrows). (c) We found that 1.3 ± 0.3 ARF1EN-Halo tubules/min also contained KDEL-R, which corresponds to 22 ± 4% of the total ARF1EN-Halo tubules observed. (b) β-COPEN-SNAP cells were electroporated with a KDEL-R-GFP–encoding plasmid and labeled with SiR-CA for confocal imaging. Nearly all observed KDEL-R-GFP tubules were positive for Coatomer (arrows). (d) We counted 1.9 ± 1.1 KDEL-R-GFP/ β-COPEN-SNAP tubules/min, which corresponds to 94 ± 9% of the total number of tubules observed. Error bars represent SD. Scale bars, 10 μm (a), 5 μm (b).
FIGURE 8:
FIGURE 8:
ARF1 tubules represent a major membrane flow out of the Golgi. ARF1-dependent retrograde and anterograde tubules are tightly packed with ARF1EN-Halo and contain the cargoes KDEL receptor and VSV G, respectively. Clusters of coat proteins (clathrin and coatomer) are observed on the tubules. Retrograde tubules account for a flow of membranes of ∼360 μm2/h, ∼7% of the flow necessary for membrane balance, if one takes into account the anterograde flow of COPII vesicles (∼6000 μm2/h) and the growth of Golgi and post-Golgi membranes (∼500 μm2/h). Anterograde tubules account for ∼900 μm2/h, approximately threefold of what is needed for plasma membrane (PM) growth (∼340 μm2/h). MTOC, microtubule-organizing center.

Similar articles

Cited by

References

    1. Abramoff MD, Magalhaes PJ, Ram SJ. Image processing with ImageJ. Biophotonics Int. 2004;11:36–42.
    1. Barlowe C, Helenius A. Cargo capture and bulk flow in the early secretory pathway. Annu Rev Cell Dev Biol. 2016;32:197–222. - PubMed
    1. Beck R, Sun Z, Adolf F, Rutz C, Bassler J, Wild K, Sinning I, Hurt E, Brugger B, Bethune J, et al. Membrane curvature induced by Arf1-GTP is essential for vesicle formation. Proc Natl Acad Sci USA. 2008;105:11731–11736. - PMC - PubMed
    1. Beznoussenko GV, Parashuraman S, Rizzo R, Polishchuk R, Martella O, Di Giandomenico D, Fusella A, Spaar A, Sallese M, Capestrano MG, et al. Transport of soluble proteins through the Golgi occurs by diffusion via continuities across cisternae. Elife. 2014;3:e02009. - PMC - PubMed
    1. Boehm M, Aguilar RC, Bonifacino JS. Functional and physical interactions of the adaptor protein complex AP-4 with ADP-ribosylation factors (ARFs) EMBO J. 2001;20:6265–6276. - PMC - PubMed

MeSH terms