. 2017 Jun 15;28(12):1636-1651.
doi: 10.1091/mbc.E16-12-0828. Epub 2017 Apr 20.

Deletion of inositol-requiring enzyme-1α in podocytes disrupts glomerular capillary integrity and autophagy

Affiliations

Deletion of inositol-requiring enzyme-1α in podocytes disrupts glomerular capillary integrity and autophagy

Daniel Robert Kaufman et al. Mol Biol Cell. .

Abstract

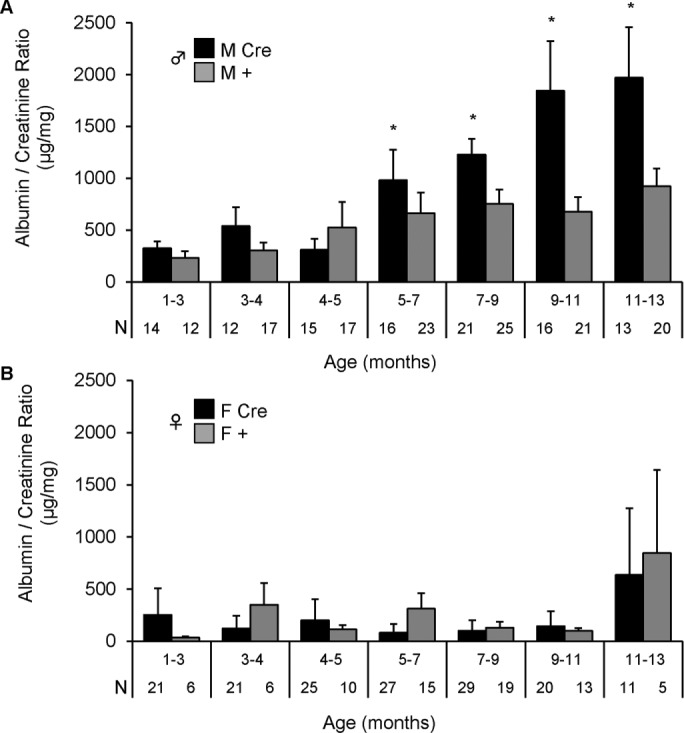
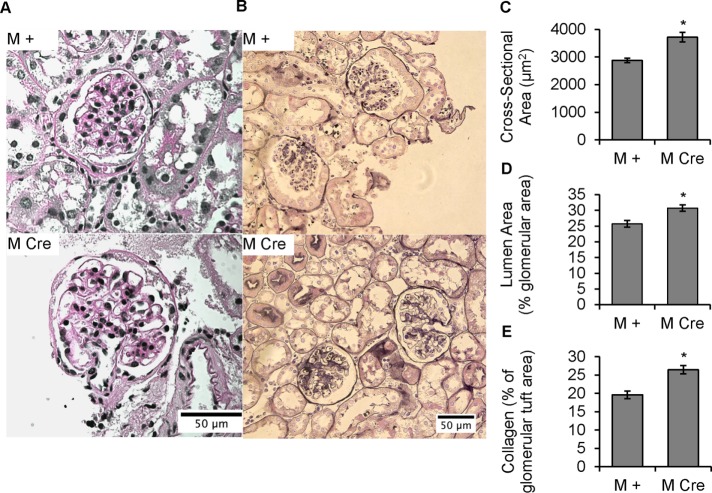
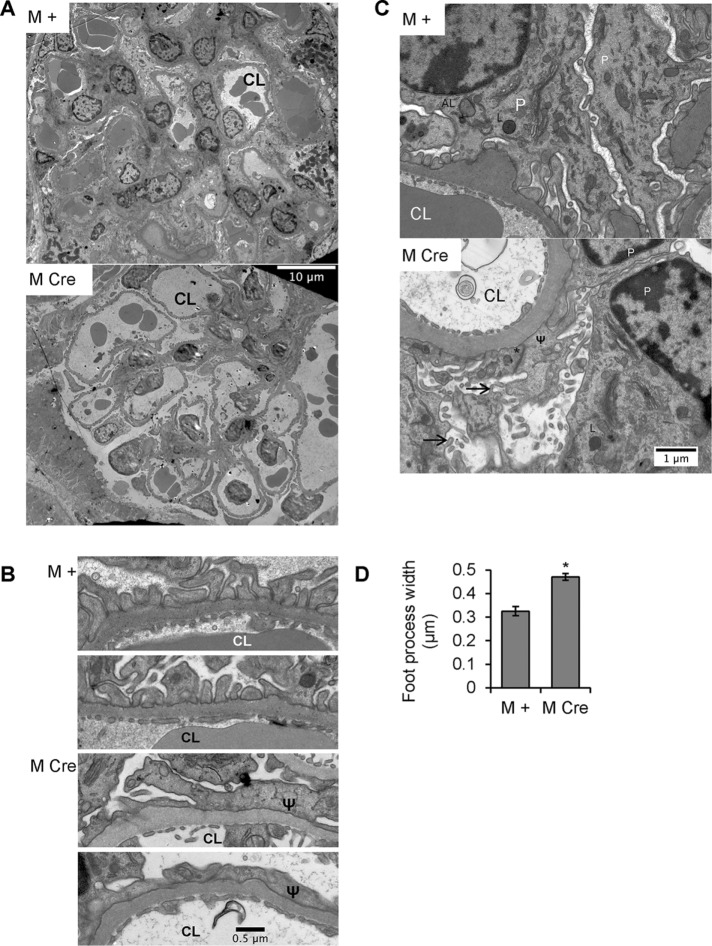
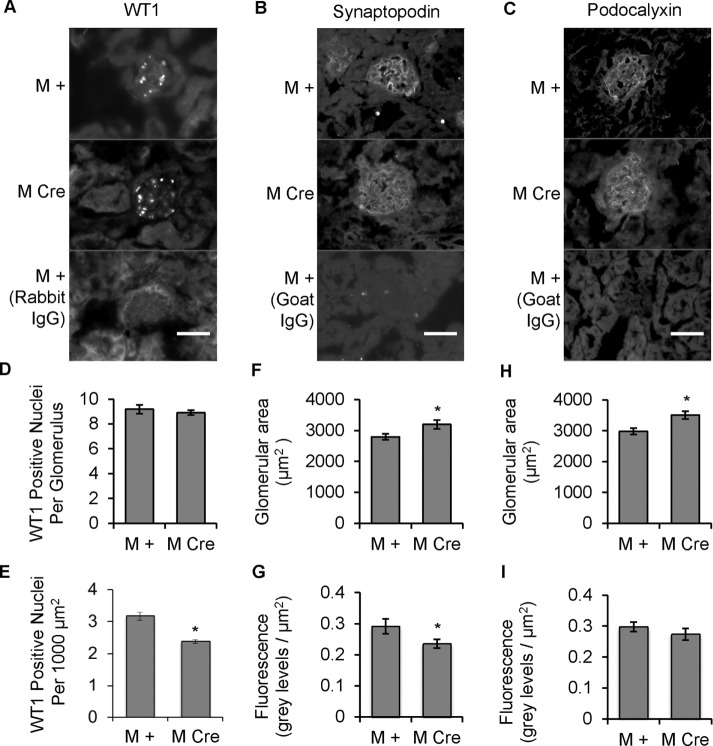
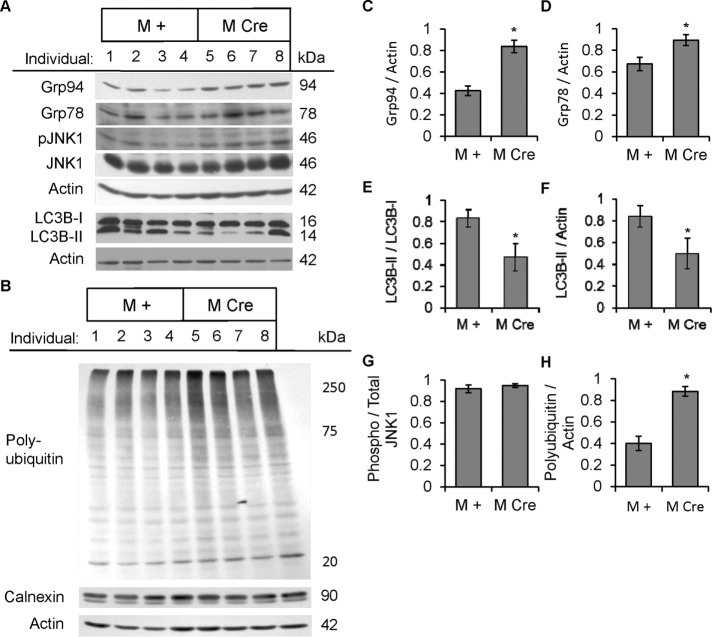
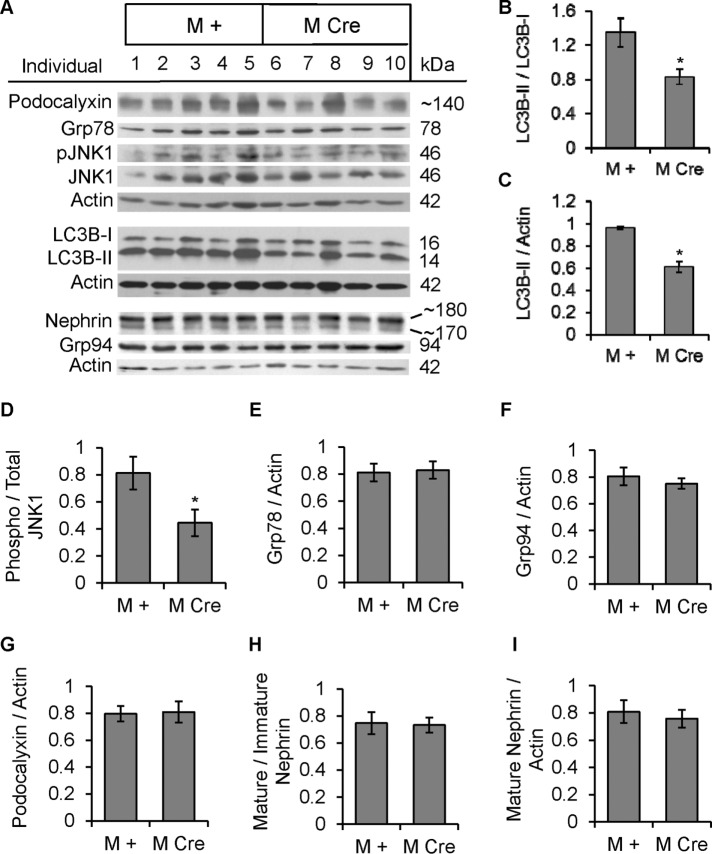
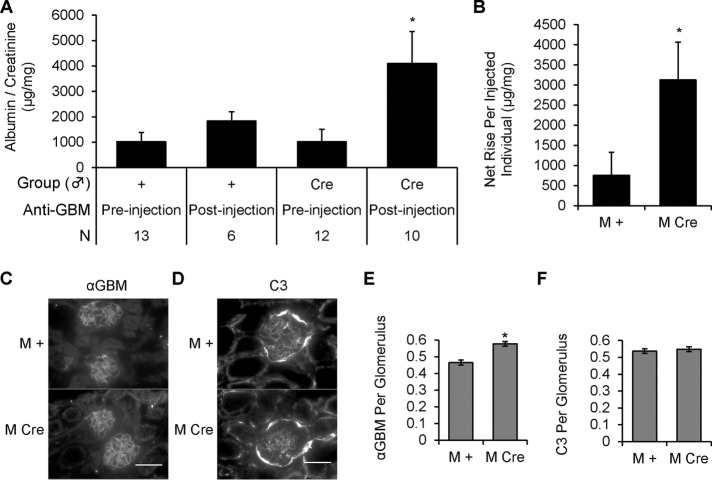
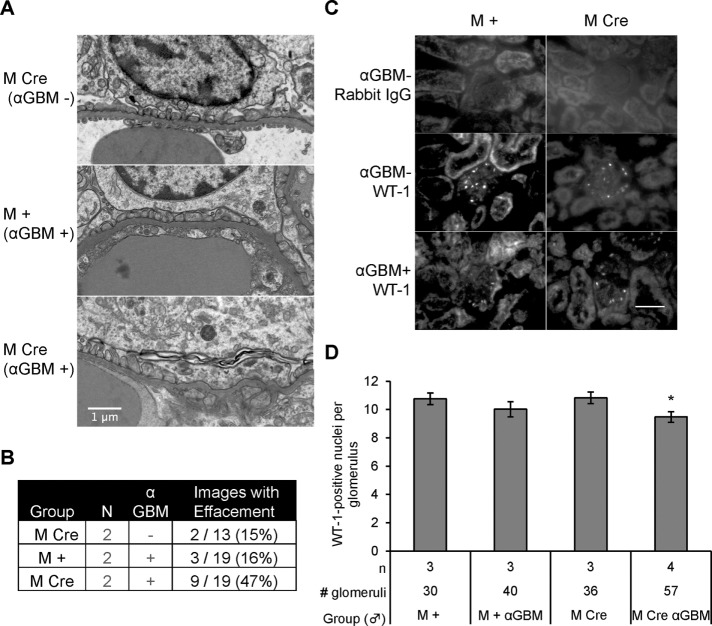
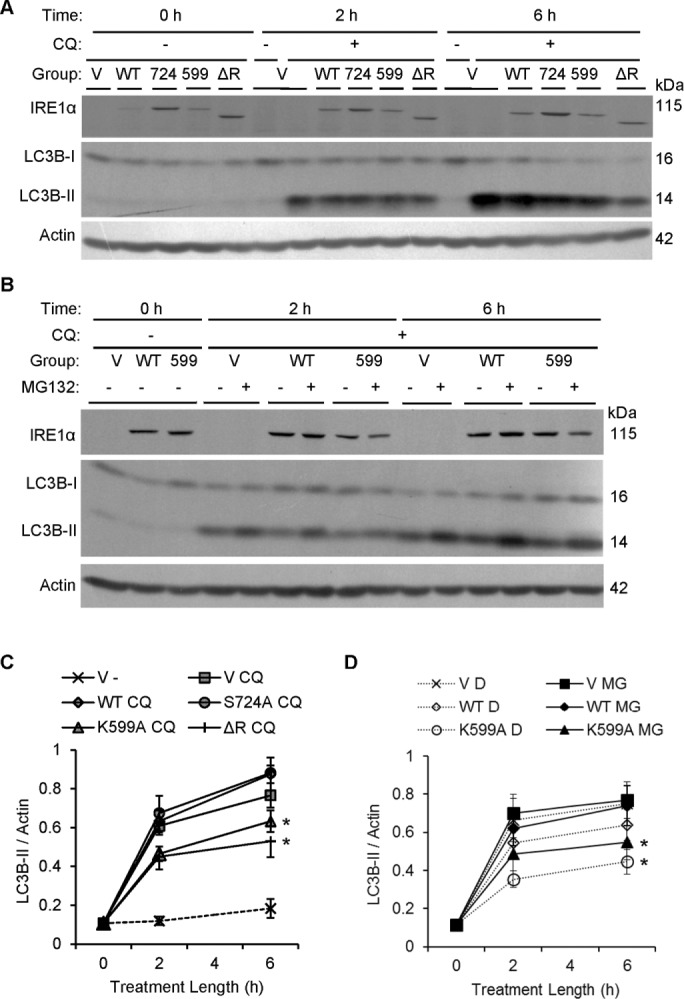
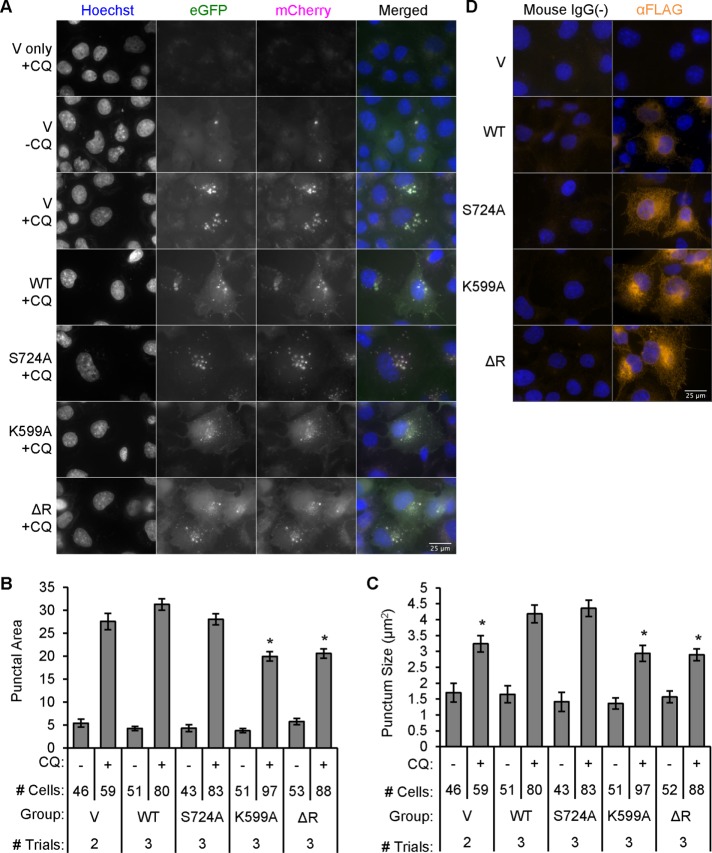
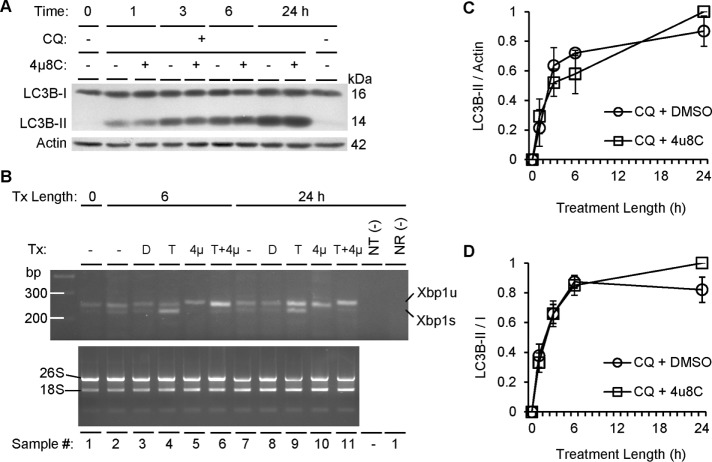
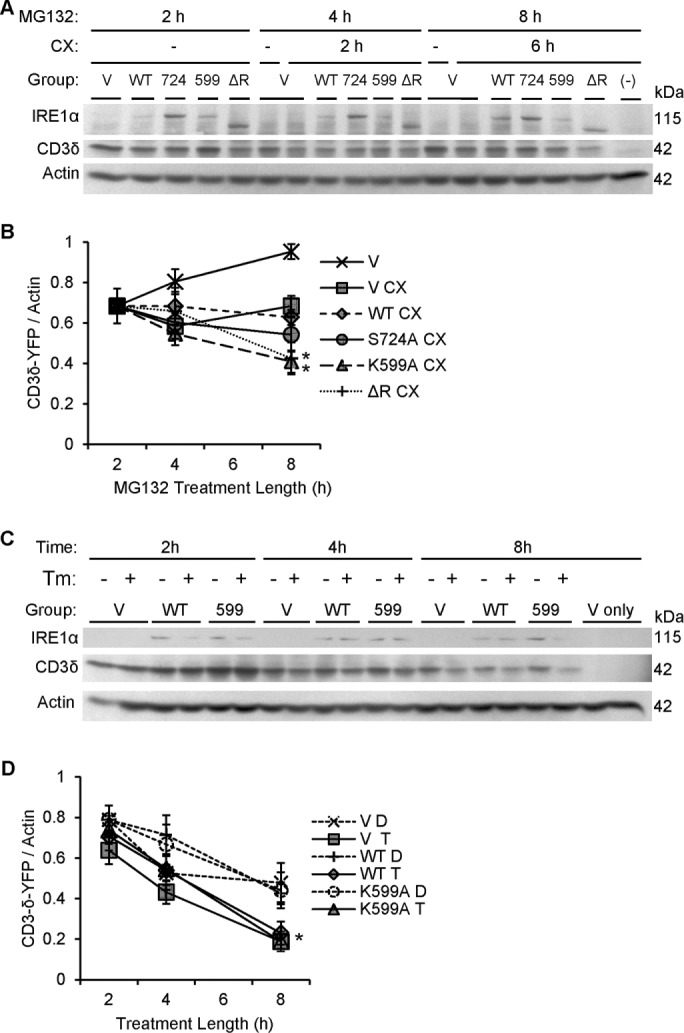
Inositol-requiring enzyme-1α (IRE1α) is an endoplasmic reticulum (ER)-transmembrane endoribonuclease kinase that plays an essential function in extraembryonic tissues during normal development and is activated during ER stress. To address the functional role of IRE1α in glomerular podocytes, we produced podocyte-specific IRE1α-deletion mice. In male mice, deletion of IRE1α in podocytes resulted in albuminuria beginning at 5 mo of age and worsening with time. Electron microscopy revealed focal podocyte foot-process effacement in 9-mo-old male IRE1α-deletion mice, as well as microvillous transformation of podocyte plasma membranes. Compared with control, glomerular cross-sectional and capillary lumenal areas were greater in deletion mice, and there was relative podocyte depletion. Levels of microtubule-associated protein 1A/1B-light chain 3 (LC3)-II expression and c-Jun N-terminal kinase-1 phosphorylation were decreased in IRE1α-deletion glomeruli, in keeping with reduced autophagy. Deletion of IRE1α exacerbated glomerular injury in anti-glomerular basement membrane nephritis. In cell culture, IRE1α dominant-negative mutants reduced the physiological (basal) accumulation of LC3B-II and the size of autophagic vacuoles but did not affect ER-associated degradation. Thus IRE1α is essential for maintaining podocyte and glomerular integrity as mice age and in glomerulonephritis. The mechanism is related, at least in part, to the maintenance of autophagy in podocytes.


Figures

FIGURE 1:
FIGURE 1:
Podocyte IRE1α-deletion male mice develop albuminuria with aging. Male (A) and female (B) F3 littermates were monitored for albuminuria monthly. Podocyte IRE1α deletion in male mice (IRE1αflox/flox;Cre; M Cre) caused persistent and worsening albuminuria beginning at 5 mo of age as compared with control (IRE1αflox/flox;+; M +). Male mice: p = 4.72 × 10⁻⁴ (M Cre vs. M +; genotype); p = 2.20 × 10⁻⁶ (age); p = 0.033 (genotype × age interaction). There were no significant differences in albuminuria between female Cre (F Cre) and control (F +) mice. Number of urine samples (N) is indicated under each column.
FIGURE 2:
FIGURE 2:
Podocyte IRE1α deletion causes glomerular volume expansion and distended capillary loops, as well as collagen deposition, at 9 mo of age. (A) PAS stain. IRE1αflox/flox;Cre (M Cre) mice have enlarged glomeruli, as well as enlarged glomerular capillary lumens, compared with control (IRE1αflox/flox;+; M +). (B) There is increased capillary wall and mesangial collagen deposition in M Cre mice (Jones’ silver stain). (C) PAS-stained glomerular area is increased in M Cre mice (*p = 3.1 × 10⁻⁵). Mean of 48 M + glomeruli from three mice and 56 M Cre glomeruli from three mice. (D) Percentage of a given PAS-stained glomerulus that is occupied by capillary lumen is expanded in M Cre mice (*p = 0.0066). Average of 48 M + glomeruli from three mice, and 55 M Cre glomeruli from three mice. (E) Silver-stained glomeruli of M Cre mice have a higher fraction of glomerular tissue occupied by collagen than M + mice (*p = 1.45 × 10⁻⁵). Because the expanded capillary lumens in M Cre mice could confound this analysis, the capillary luminal area was subtracted from total glomerular cross-sectional area, so that the area of stained tissue could then be normalized to the total cross-sectional area of glomerular tissue. Imaging and quantification included 75 M + glomeruli from three mice and 74 M Cre glomeruli from three mice.
FIGURE 3:
FIGURE 3:
Podocyte IRE1α deletion results in ultrastructural changes in podocytes. (A–C) Representative electron micrographs from 9-mo-old IRE1αflox/flox;+ (M +) and IRE1αflox/flox;Cre (M Cre) mice. (A) At low power, glomerular capillaries appear markedly dilated in M Cre mice (CL, capillary lumen). (B) Glomerular capillary walls from 2 M + and 2 M Cre mice reveal widened and effaced podocyte foot processes in the M Cre mice (Ψ). (C) M + and M Cre podocyte (P) cell bodies. M + mice displayed evidence of active autophagy, that is, autophagosomes or autolysosomes (AL). Lysosomes (L) were present in M Cre and M + mice. M Cre podocytes show focal foot process widening (Ψ), occludens junctions (*), and microvillous transformation of the plasma membranes (arrows). (D) Quantification of M Cre focal podocyte foot process widening (*p = 3.9 × 10⁻⁷). Foot processes were measured in 63 lengths of GBM from three M Cre mice and 20 lengths of GBM from two M + mice.
FIGURE 4:
FIGURE 4:
Podocyte IRE1α deletion result in a reduction of WT1 and synaptopodin. (A–C) Kidney sections from 9-mo-old mice were stained with antibodies to WT1 (A), synaptopodin (B), and podocalyxin (C). Staining with nonimmune IgG is also presented (negative controls). Scale bars, 50 μm. (D, E) The number of WT1-positive nuclei per glomerulus (determined by colocalization with Hoechst nuclear stain; not shown) was assessed by visual counting. WT1 counts per glomerulus were comparable, but when expressed per 1000 µm2 of glomerular area, WT1 counts were significantly lower in M Cre mice (*p = 4.6 × 10⁻⁵); 32 M + glomeruli from three mice and 48 M Cre glomeruli from three mice. (F) Synaptopodin-stained glomeruli were enlarged in M Cre mice (*p = 0.024). (G) Quantification of synaptopodin immunofluorescence per unit glomerular area showed that intensity was lower in M Cre mice (*p = 0.046). For F and G, 74 M + glomeruli from three mice and 69 M Cre glomeruli from three mice. (H) Podocalyxin-stained glomeruli were enlarged in M Cre mice (*p = 0.0013). (I) Podocalyxin fluorescence per glomerulus and fluorescence per unit glomerular area were comparable in both groups. For H and I, 58 M + glomeruli from three mice and 54 M Cre glomeruli from three mice.
FIGURE 5:
FIGURE 5:
Podocyte IRE1α deletion induces ER stress and causes deficient autophagosome turnover in 4- to 5-mo-old prealbuminuric mice. (A, B) Glomerular lysates were immunoblotted with antibodies as indicated. Representative immunoblots of four IRE1αflox/flox;+ (M +) and four IRE1αflox/flox;Cre (M Cre) mice obtained from a cohort of prealbuminuric male mice. (C, D) Densitometric quantification. M Cre mice show elevated expression of Grp78 (*p = 0.033) and Grp94 (*p = 0.0017). No change in calnexin was noted (B). (B, H) M Cre mice display elevated global polyubiquitinated proteins (*p = 0.0015). (A, E, F) M Cre mice show decreased LC3B-II, normalized either to LC3B-I (*p = 0.023) or actin (*p = 0.043; five to seven mice per group); M Cre mice show a reduced LC3B-II/I ratio (*p = 0.002). There were no differences in total LC3B-I or phospho-JNK1 (pJNK1) between groups (F, G).
FIGURE 6:
FIGURE 6:
Mice with podocyte IRE1α deletion are deficient in autophagy but do not show ER stress at 9 mo of age. (A) Glomerular lysates were immunoblotted with antibodies as indicated. Representative immunoblots of 5 IRE1αflox/flox;+ (M +) and 5 IRE1αflox/flox;Cre (M Cre) mice. (B–D) Densitometric quantification. M Cre mice show decreased LC3B-II, normalized either to LC3B-I (*p = 0.013) or actin (*p < 0.0001), and decreased JNK1 phosphorylation (*p = 0.048). (E–I) No significant differences between M Cre and M + mice were observed in Grp78, Grp94, podocalyxin, nephrin maturation (upper/lower band), or mature nephrin expression (upper band).
FIGURE 7:
FIGURE 7:
Podocyte IRE1α deletion increases susceptibility to acute anti-GBM nephritis. (A) Male mice 5 mo of age were injected with 5 μl of sheep anti–GBM antibody (αGBM). Urine was collected preinjection and at 24 h. Kidneys were harvested at 24 h. In mice that received anti-GBM antibody, there was significantly greater albuminuria in the IRE1αflox/flox;Cre (M Cre) group than in controls (IRE1αflox/flox;+; M +). Albuminuria in anti-GBM M Cre mice was also significantly greater than the preinjection (baseline) value (*p = 0.005, ANOVA; N, number of animals). (B) The net change in albumin/creatinine ratio calculated per individual mouse for 10 anti-GBM injected M Cre mice and 6 injected M + mice was significantly greater in M Cre mice (*p = 0.049). (C–F) Anti-GBM antibody and C3 deposition in mouse glomeruli were confirmed by immunofluorescence microscopy. Quantification of sheep anti-GBM fluorescence intensity showed a slight increase in M Cre mice (*p = 4.27 × 10⁻⁷; 83 glomeruli from six GBM-injected M + mice and 110 glomeruli from seven GBM-injected M Cre mice). There were no significant differences in C3 deposition. C3 fluorescence intensity was measured in 80 glomeruli from six M + mice and 98 glomeruli from seven M Cre mice. Scale bars, 50 μm.
FIGURE 8:
FIGURE 8:
Mice with podocyte deletion of IRE1α and anti-GBM nephritis exhibit podocyte loss and foot process effacement. (A) Representative electron micrographs showing mild foot-process widening in uninjected IRE1αflox/flox;Cre (M Cre) and injected IRE1αflox/flox;+ (M +) mice and greater widening in anti-GBM antibody–injected M Cre mice (24 h). (B) Quantification of images showing foot-process widening/effacement (N, number of animals). (C) Representative WT1 immunofluorescence images of mice with acute anti-GBM nephritis (24 h). Scale bar, 50 μm. (D) Quantification of WT1-positive cells shows that anti-GBM antibody treatment in M Cre mice resulted in a modest but significant loss of podocytes (*p = 0.027 anti-GBM vs. control in the M Cre groups). In M + mice, there was no significant decrease in podocytes after anti-GBM antibody.
FIGURE 9:
FIGURE 9:
IRE1α facilitates physiological formation of autophagic vacuoles. (A) COS-1 cells transiently transfected with vector (V), FLAG-IRE1α WT, or mutants were treated with or without chloroquine (CQ, 50 μM). Levels of LC3B were measured by immunoblotting after 2 or 6 h. FLAG-IRE1α expression was confirmed using anti-FLAG antibody. (C) Quantification of the rate of LC3B-II accumulation shows that overexpression of IRE1α K599A and ΔR significantly reduces the formation of LC3B-II vs. IRE1α WT. IRE1α ΔR also significantly lowers the rate of LC3B-II formation vs. control (vector), whereas IRE1α K599A tends to lower the rate of formation vs. control (*p = 5.40 × 10⁻⁷ [IRE1α]; p = 1.09 × 10⁻⁹ [CQ]; p < 2.2 × 10⁻¹⁶ [time]; p = 0.0018 [IRE1α × time interaction]; p = 1.07 × 10⁻⁴ [CQ × time interaction]; seven experiments). (B) COS-1 cells transfected with vector (V), IRE1α WT, or K599A were treated with chloroquine (CQ, 50 μM) plus vehicle (DMSO [D]) or MG132 (MG, 25 μM). Overexpression of IRE1α K599A reduced the rate of LC3B-II accumulation independently of MG132 treatment. (D) Quantification of the rate of LC3B-II accumulation over the 6-h chloroquine treatment period shows that overexpression of IRE1α K599A significantly reduced the rate of LC3B-II accumulation vs. control (empty vector) and vs. IRE1α WT. Differences were significant at 2 h and increased further at 6 h (*p = 0.0047 [IRE1α]; p = 1.1 × 10⁻¹⁴ [time]). These effects were independent of MG132. Six experiments.
FIGURE 10:
FIGURE 10:
IRE1α modulates autophagosome volume. (A) COS-1 cells were transiently cotransfected with FLAG-IRE1α WT or mutants and mCherry-eGFP-LC3B. Cells were untreated or treated with chloroquine (CQ, 50 μM) and examined after 6 h. The mCherry-eGFP-LC3B reporter was not transfected in the cells shown in the first row (negative control). (B) Quantification revealed that the punctal area (the cross-sectional area occupied by autophagic puncta per 1000 μm2 of total cell area) was lower in chloroquine-treated K599A- and ΔR-overexpressing cells compared with treated WT or vector/control (*p = 1.11 × 10⁻¹⁰ [IRE1α]; p < 2.2 × 10⁻¹⁶ [CQ]; p = 4.19 × 10⁻⁸ [IRE1α × CQ interaction]). (C) Cross-sectional area per autophagosome (punctum size) paralleled punctal area. IRE1α WT or S724A increased punctum size compared with control, K599A, or ΔR (*p = 4.20 × 10⁻⁵ [IRE1α]; p < 2.2 × 10⁻¹⁶ [CQ]; p = 7.82 × 10⁻³ [IRE1α × CQ interaction]). (D) Cells expressing empty vector or FLAG-IRE1α WT or mutants were immunostained with anti-FLAG antibody (nonimmune IgG in controls). IRE1α WT. and mutants show cytoplasmic staining with perinuclear accentuation. For B and C, the number of trials and the number of quantified cells are indicated beneath columns.
FIGURE 11:
FIGURE 11:
IRE1α-mediated autophagosome formation does not require RNase activity. (A) COS-1 cells were treated with chloroquine (CQ, 50 μM), the IRE1α RNase inhibitor 4μ8c (10 μM), or vehicle (DMSO). Quantification of the rate of autophagosome formation for up to 24 h as reported by LC3B-II normalized to actin (C) or the LC3B-II to I ratio (D) revealed no significant differences in the presence or absence of 4μ8c, although LC3B-II increased over time (C: p = 2.21 × 10⁻⁶; D: p = 9.34 × 10⁻⁵; three experiments). (B) Tunicamycin (T, 10 μg/ml) induced Xbp1 splicing, and this effect was blocked by 4μ8c (4μ, 10 μM) at 6 and 24 h. NR, no–reverse transcriptase negative control; NT, no-template negative control; Tx, treatment.
FIGURE 12:
FIGURE 12:
Dominant-negative IRE1α mutants (K599A and ΔR) accelerate degradation of CD3δ-YFP. (A) COS-1 cells cotransfected with FLAG-IRE1α (WT or mutants) and the ERAD reporter CD3δ-YFP were pretreated with MG132 (MG, 10 μM) to partially block the proteasome. At 2 h, vehicle (DMSO) or cycloheximide (CX, 25 μg/ml) was added. Lysates were immunoblotted after another 2 or 6 h, as indicated. Expression of IRE1α and CD3δ-YFP was confirmed using anti-FLAG and anti-GFP antibodies, respectively. Overexpression of IRE1α K599A or ΔR enhanced CD3δ-YFP degradation. The lane labeled “–” is a mock-transfected, cycloheximide-treated control sample, which confirms the CD3δ-YFP signal specificity. (B) Densitometric quantification showed that in the presence of cycloheximide, overexpression of IRE1α K599A or ΔR enhanced CD3δ-YFP degradation compared with vector. In addition, IRE1α K599A enhanced CD3δ-YFP degradation compared with WT (*p = 0.003 [IRE1α]; p = 0.0065 [CX]; p = 0.003 [IRE1α × time interaction; five experiments]. (C) COS-1 cells coexpressing IRE1α WT and CD3δ-YFP were cotreated with cycloheximide together with either vehicle (DMSO [D]) or tunicamycin (Tm or T, 5 μg/ml). Lysates were immunoblotted 2, 4, and 8 h posttreatment. The lanes labeled “V only” are without transfection of CD3δ-YFP. (D) Densitometric quantification shows that tunicamycin stimulated degradation of CD3δ-YFP in vector- and IRE1α-transfected cells. IRE1α did not modulate the tunicamycin-induced degradation of CD3δ-YFP, that is, overexpression of IRE1α WT did not potentiate tunicamycin-induced degradation of CD3δ-YFP, nor did IRE1α K599A exert an inhibitory effect (*p = 4.12 × 10⁻⁵ [Tm]; p = 3.70 × 10⁻¹⁵ [CX + time]; six experiments).

Similar articles

Cited by

  • Recent Advances in Proteinuric Kidney Disease/Nephrotic Syndrome: Lessons from Knockout/Transgenic Mouse Models.
    Saiki R, Katayama K, Dohi K. Saiki R, et al. Biomedicines. 2023 Jun 23;11(7):1803. doi: 10.3390/biomedicines11071803. Biomedicines. 2023. PMID: 37509442 Free PMC article. Review.
  • Endoplasmic Reticulum Stress in Systemic Lupus Erythematosus and Lupus Nephritis: Potential Therapeutic Target.
    Li HY, Huang LF, Huang XR, Wu D, Chen XC, Tang JX, An N, Liu HF, Yang C. Li HY, et al. J Immunol Res. 2023 Aug 31;2023:7625817. doi: 10.1155/2023/7625817. eCollection 2023. J Immunol Res. 2023. PMID: 37692838 Free PMC article. Review.
  • Acute Kidney Injury and Progression of Diabetic Kidney Disease.
    Yu SM, Bonventre JV. Yu SM, et al. Adv Chronic Kidney Dis. 2018 Mar;25(2):166-180. doi: 10.1053/j.ackd.2017.12.005. Adv Chronic Kidney Dis. 2018. PMID: 29580581 Free PMC article. Review.
  • Guidelines for the use and interpretation of assays for monitoring autophagy (4th edition)1.
    Klionsky DJ, Abdel-Aziz AK, Abdelfatah S, Abdellatif M, Abdoli A, Abel S, Abeliovich H, Abildgaard MH, Abudu YP, Acevedo-Arozena A, Adamopoulos IE, Adeli K, Adolph TE, Adornetto A, Aflaki E, Agam G, Agarwal A, Aggarwal BB, Agnello M, Agostinis P, Agrewala JN, Agrotis A, Aguilar PV, Ahmad ST, Ahmed ZM, Ahumada-Castro U, Aits S, Aizawa S, Akkoc Y, Akoumianaki T, Akpinar HA, Al-Abd AM, Al-Akra L, Al-Gharaibeh A, Alaoui-Jamali MA, Alberti S, Alcocer-Gómez E, Alessandri C, Ali M, Alim Al-Bari MA, Aliwaini S, Alizadeh J, Almacellas E, Almasan A, Alonso A, Alonso GD, Altan-Bonnet N, Altieri DC, Álvarez ÉMC, Alves S, Alves da Costa C, Alzaharna MM, Amadio M, Amantini C, Amaral C, Ambrosio S, Amer AO, Ammanathan V, An Z, Andersen SU, Andrabi SA, Andrade-Silva M, Andres AM, Angelini S, Ann D, Anozie UC, Ansari MY, Antas P, Antebi A, Antón Z, Anwar T, Apetoh L, Apostolova N, Araki T, Araki Y, Arasaki K, Araújo WL, Araya J, Arden C, Arévalo MA, Arguelles S, Arias E, Arikkath J, Arimoto H, Ariosa AR, Armstrong-James D, Arnauné-Pelloquin L, Aroca A, Arroyo DS, Arsov I, Artero R, Asaro DML, Aschner M, Ashrafizadeh M, Ashur-Fabian O, Atanasov AG, Au AK, Auberger P, Auner HW, Aurelian L, Autelli R… See abstract for full author list ➔ Klionsky DJ, et al. Autophagy. 2021 Jan;17(1):1-382. doi: 10.1080/15548627.2020.1797280. Epub 2021 Feb 8. Autophagy. 2021. PMID: 33634751 Free PMC article.
  • Ste20-like kinase, SLK, a novel mediator of podocyte integrity.
    Cybulsky AV, Papillon J, Guillemette J, Belkina N, Patino-Lopez G, Torban E. Cybulsky AV, et al. Am J Physiol Renal Physiol. 2018 Jul 1;315(1):F186-F198. doi: 10.1152/ajprenal.00238.2017. Epub 2017 Nov 29. Am J Physiol Renal Physiol. 2018. PMID: 29187370 Free PMC article.

References

    1. Araki K, Nagata K. Protein folding and quality control in the ER. Cold Spring Harb Perspect Biol. 2011;3:a007526. - PMC - PubMed
    1. Bonifacino JS, Suzuki CK, Lippincott-Schwartz J, Weissman AM, Klausner RD. Pre-Golgi degradation of newly synthesized T-cell antigen receptor chains: intrinsic sensitivity and the role of subunit assembly. J Cell Biol. 1989;109:73–83. - PMC - PubMed
    1. Brinkkoetter PT, Ising C, Benzing T. The role of the podocyte in albumin filtration. Nat Rev Nephrol. 2013;9:328–336. - PubMed
    1. Cheng YC, Chang JM, Chen CA, Chen HC. Autophagy modulates endoplasmic reticulum stress-induced cell death in podocytes: a protective role. Exp Biol Med (Maywood) 2015;240:467–476. - PMC - PubMed
    1. Chiang CK, Inagi R. Glomerular diseases: genetic causes and future therapeutics. Nat Rev Nephrol. 2010;6:539–554. - PubMed

MeSH terms