

The prognostic significance of Cdc6 and Cdt1 in breast cancer
- PMID: 28428557
- PMCID: PMC5430515
- DOI: 10.1038/s41598-017-00998-9
The prognostic significance of Cdc6 and Cdt1 in breast cancer
Abstract
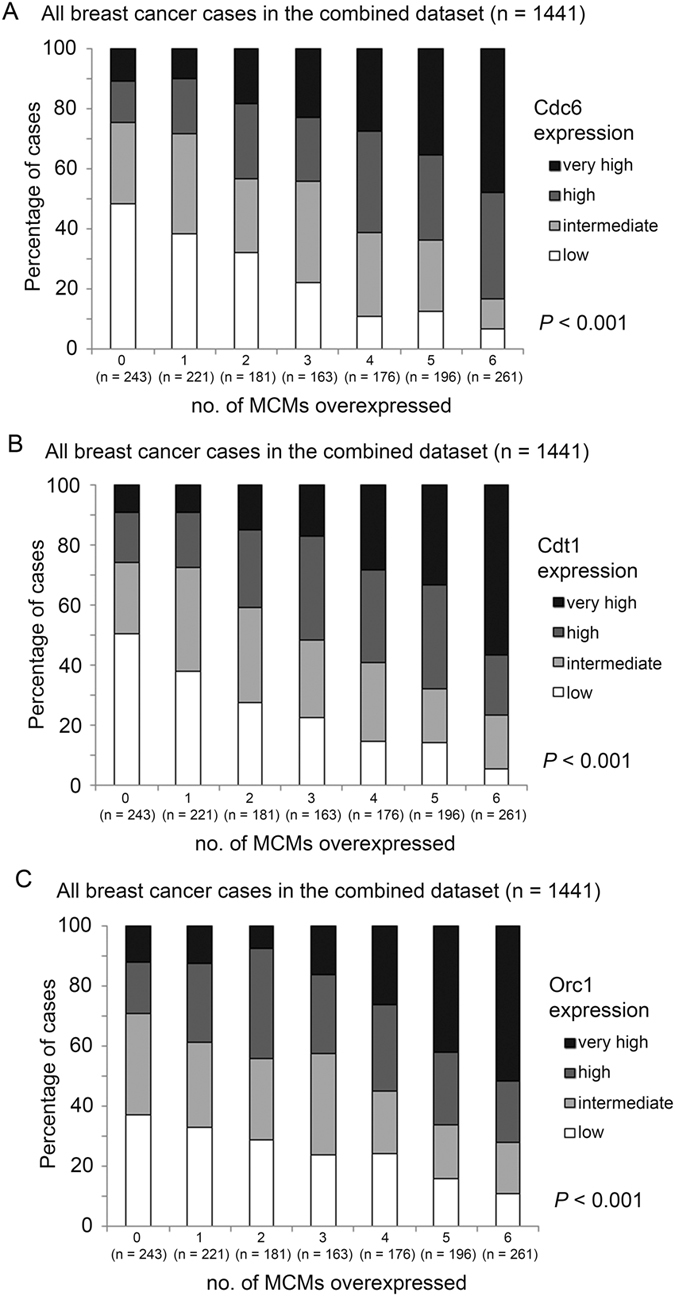
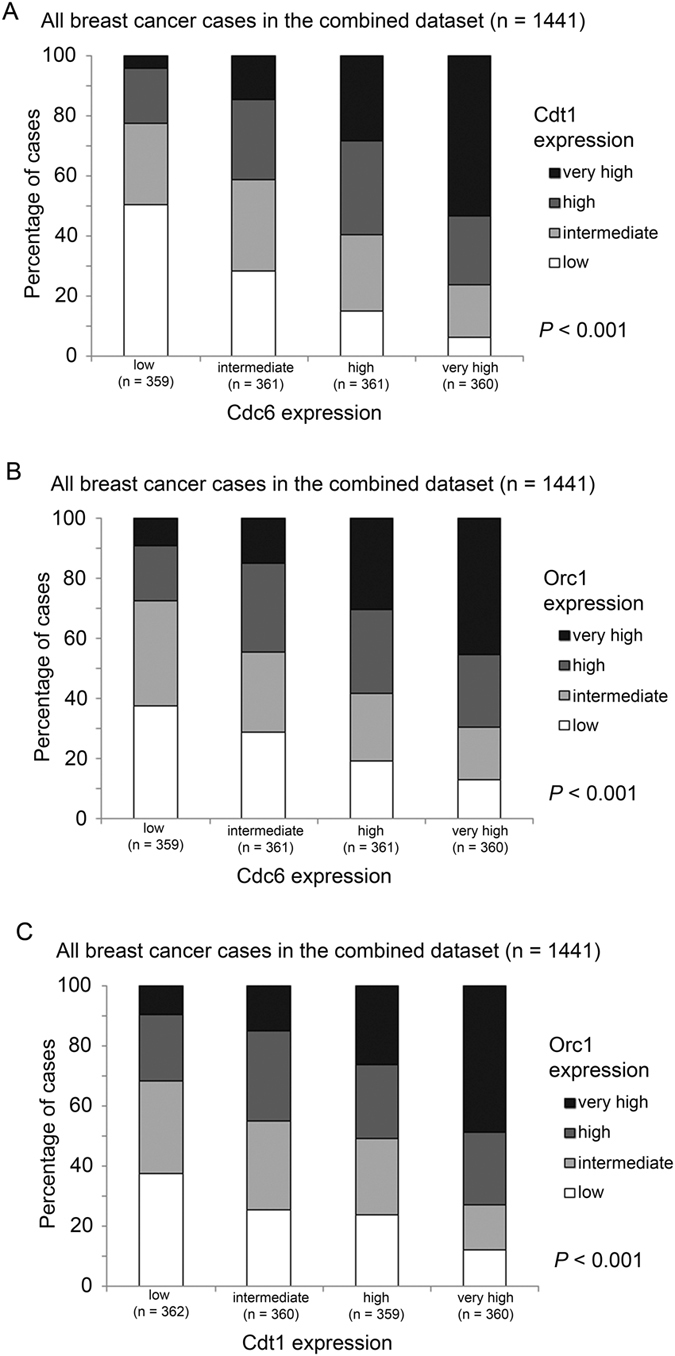
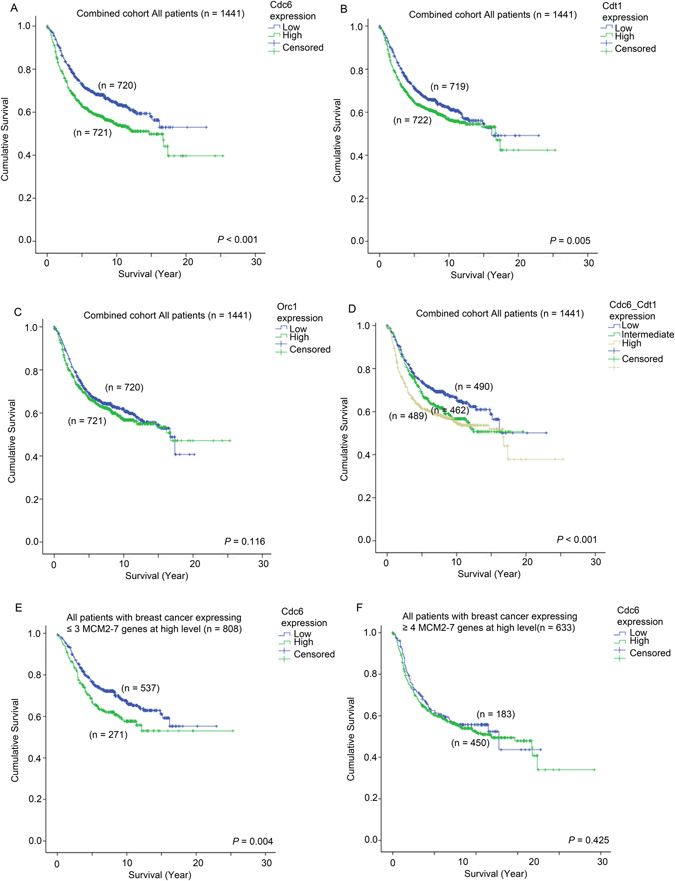
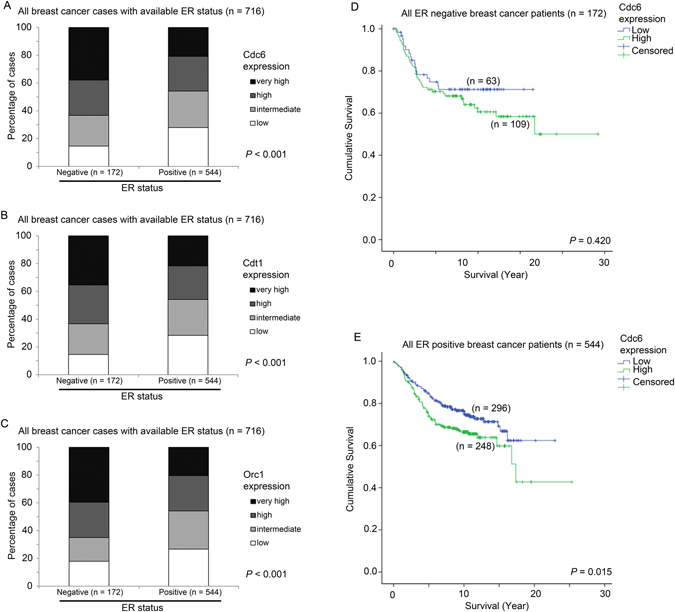
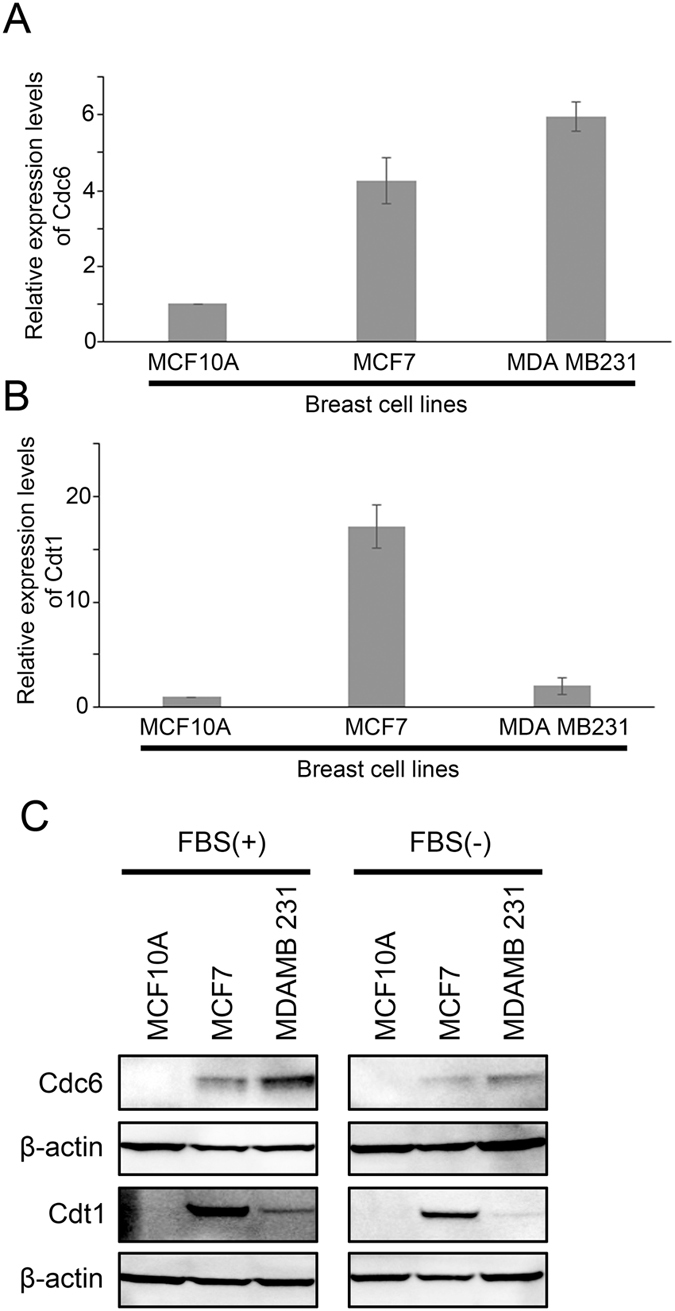
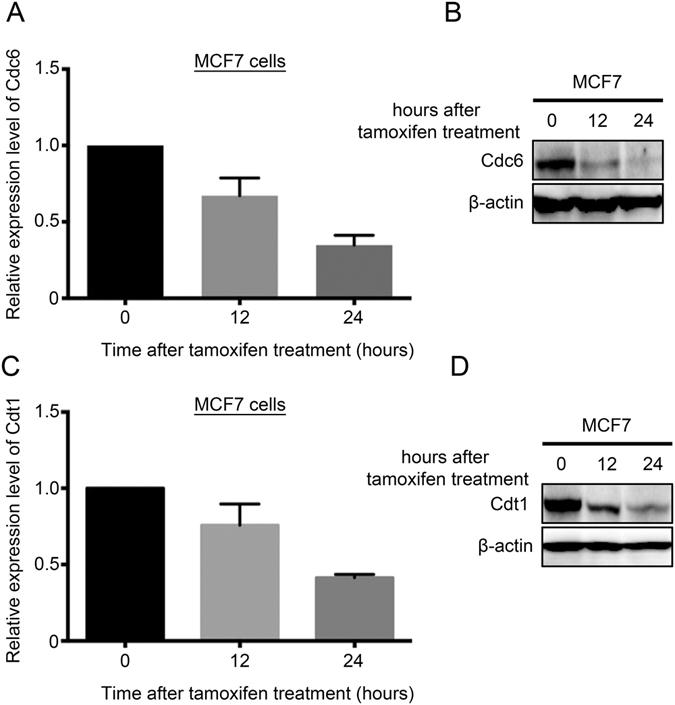
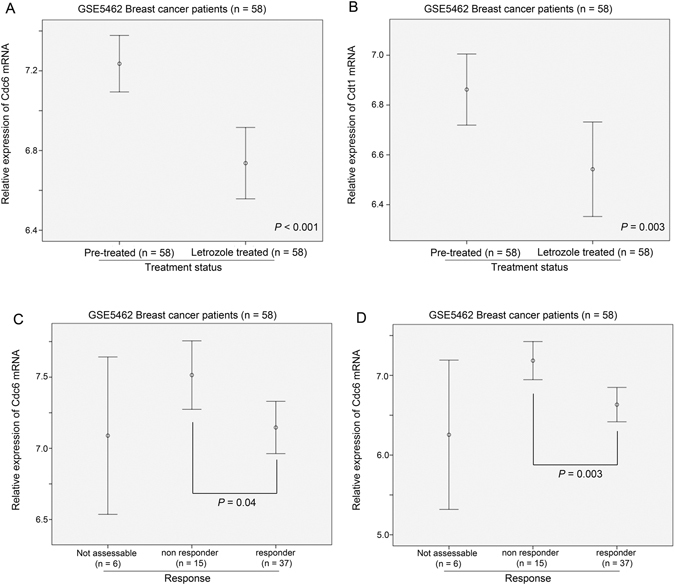
DNA replication is a critical step in cell proliferation. Overexpression of MCM2-7 genes correlated with poor prognosis in breast cancer patients. However, the roles of Cdc6 and Cdt1, which work with MCMs to regulate DNA replication, in breast cancers are largely unknown. In the present study, we have shown that the expression levels of Cdc6 and Cdt1 were both significantly correlated with an increasing number of MCM2-7 genes overexpression. Both Cdc6 and Cdt1, when expressed in a high level, alone or in combination, were significantly associated with poorer survival in the breast cancer patient cohort (n = 1441). In line with this finding, the expression of Cdc6 and Cdt1 was upregulated in breast cancer cells compared to normal breast epithelial cells. Expression of Cdc6 and Cdt1 was significantly higher in ER negative breast cancer, and was suppressed when ER signalling was inhibited either by tamoxifen in vitro or letrozole in human subjects. Importantly, breast cancer patients who responded to letrozole expressed significantly lower Cdc6 than those patients who did not respond. Our results suggest that Cdc6 is a potential prognostic marker and therapeutic target in breast cancer patients.
Conflict of interest statement
The authors declare that they have no competing interests.
Figures
Similar articles
-
RRM2 and CDC6 are novel effectors of XBP1-mediated endocrine resistance and predictive markers of tamoxifen sensitivity.BMC Cancer. 2023 Mar 30;23(1):288. doi: 10.1186/s12885-023-10745-1. BMC Cancer. 2023. PMID: 36997866 Free PMC article.
-
MicroRNA-125b upregulation confers aromatase inhibitor resistance and is a novel marker of poor prognosis in breast cancer.Breast Cancer Res. 2015 Jan 30;17(1):13. doi: 10.1186/s13058-015-0515-1. Breast Cancer Res. 2015. PMID: 25633049 Free PMC article.
-
In Vivo DNA Re-replication Elicits Lethal Tissue Dysplasias.Cell Rep. 2017 May 2;19(5):928-938. doi: 10.1016/j.celrep.2017.04.032. Cell Rep. 2017. PMID: 28467906
-
Redundant and differential regulation of multiple licensing factors ensures prevention of re-replication in normal human cells.J Cell Sci. 2009 Apr 15;122(Pt 8):1184-91. doi: 10.1242/jcs.041889. J Cell Sci. 2009. PMID: 19339550
-
Cdc6: a multi-functional molecular switch with critical role in carcinogenesis.Transcription. 2012 May-Jun;3(3):124-9. doi: 10.4161/trns.20301. Transcription. 2012. PMID: 22771947 Free PMC article. Review.
Cited by
-
CDC6 is up-regulated and a poor prognostic signature in glioblastoma multiforme.Clin Transl Oncol. 2021 Mar;23(3):565-571. doi: 10.1007/s12094-020-02449-w. Epub 2020 Jul 13. Clin Transl Oncol. 2021. PMID: 32661826
-
TGFβ1 Cell Cycle Arrest Is Mediated by Inhibition of MCM Assembly in Rb-Deficient Conditions.Mol Cancer Res. 2019 Jan;17(1):277-288. doi: 10.1158/1541-7786.MCR-18-0558. Epub 2018 Sep 26. Mol Cancer Res. 2019. PMID: 30257992 Free PMC article.
-
CUL4A Ubiquitin Ligase Is an Independent Predictor of Overall Survival in Pancreatic Adenocarcinoma.Cancer Genomics Proteomics. 2024 Mar-Apr;21(2):166-177. doi: 10.21873/cgp.20438. Cancer Genomics Proteomics. 2024. PMID: 38423594 Free PMC article.
-
Identification of a seven-cell cycle signature predicting overall survival for gastric cancer.Aging (Albany NY). 2022 May 10;14(9):3989-3999. doi: 10.18632/aging.204060. Epub 2022 May 10. Aging (Albany NY). 2022. PMID: 35537781 Free PMC article.
-
CDT1 Is a Novel Prognostic and Predictive Biomarkers for Hepatocellular Carcinoma.Front Oncol. 2021 Sep 24;11:721644. doi: 10.3389/fonc.2021.721644. eCollection 2021. Front Oncol. 2021. PMID: 34631549 Free PMC article.
References
Publication types
MeSH terms
Substances
LinkOut - more resources
Full Text Sources
Other Literature Sources
Medical
Miscellaneous
